Journal of Environmental Protection
Vol. 4 No. 8A2 (2013) , Article ID: 36268 , 9 pages DOI:10.4236/jep.2013.48A2011
Determining Environmental Impacts for Sensitive Species: Using Iconic Species as Bioindicators for Management and Policy
![]()
1Division of Life Sciences, Rutgers University, Piscataway, USA; 2Environmental and Occupational Health Sciences Institute, Rutgers University, Piscataway, USA; 3Consortium for Risk Evaluation with Stakeholder Participation, Vanderbilt University, Nashville, USA; 4Environmental and Occupational Medicine, Rutgers-Robert Wood Johnson Medical School, Piscataway, USA; 5Department of Civil and Environmental Engineering and CRESP, Vanderbilt University, Nashville, USA; 6Conserve Wildlife Foundation of New Jersey, Greenwich, USA; 7Endangered and Nongame Species Program, Department of Environmental Protection, Trenton, USA.
Email: burger@biology.rutgers.edu
Copyright © 2013 Joanna Burger et al. This is an open access article distributed under the Creative Commons Attribution License, which permits unrestricted use, distribution, and reproduction in any medium, provided the original work is properly cited.
Received May 26th, 2013; revised June 29th, 2013; accepted July 24th, 2013
Keywords: Assessment; Bioindicators; Contaminants; Endpoints Management; Public Policy; Fish; Birds
ABSTRACT
Environmental assessment of impacts, management, and policy are important aspects of protection of human health and the environment. Assessing the impacts of human activities requires selection of bioindicator species that can be used to assess, manage, and develop public policies that ensure ecosystem integrity, and therefore sustainability of social, cultural, and economic systems. With the use of Chinook Salmon (Oncorhynchus tshawytscha), Pacific Cod (Gadusmacrocephalus), Mallard (Anas platyrhynchos), and Red Knot (Calidris canutus rufa), we explore assessment and measurement endpoints, and their relationship to management and development of public policy. This combination of fish and birds provides a diversity of life histories, ecosystem roles, human values, and resource use to explore their use as bioindicators and endpoints. It also allows examination of 1) conservation and protection of species and biodiversity, 2) protection of ecosystems, 3) provision of goods and services, and 4) societal well-being.
1. Introduction
Environmental management, and ultimately development of environmental public policy, requires assessment of species within ecosystems, and monitoring to determine changes that can be used to predict population declines, loss of environmental resources, loss of goods and services, and effects of restoration and remediation, among others. At its heart, environmental assessment requires bioindicators, biomarkers, and other measures of the health and well-being of organisms and ecosystems [1-3]. Stressors play a key role in the health of any population, and stressors can be physical, chemical, and biological. All three can be either natural or anthropogenic. And all need to be assessed and monitored as a precursor to the management and the development of public policy. Habitat loss is one of the most important stressors species face, and such loss can be due to natural effects (e.g. displacement of sand in coastal regions, accretion and land subsidence), anthropogenic effects (e.g. development on land, in estuaries, and in the ocean), and global change (e.g. climate change, sea levels rise). Important components of successful management, however, are meaningful stakeholder involvement and community participation [4], including attention to environmental justice considerations [5,6].
In this paper we explore the relationship between environmental assessment and monitoring, measurement endpoints, management, and public policy by examining different categories of environmental assessment that are necessary for management and public policy. We use four aquatic species to illustrate how the biology and life history of each species, human values, and use of these species contribute to management goals and the development of public policy. In all cases the assessment endpoint is the overall health of the species such that its populations are sustainable, and they can continue to provide the goods and services that people value. The bioindicators considered are Chinook Salmon (Oncorhynchus tshawytscha), Pacific Cod (Gadus macrocephalus), Mallard (Anas platyrhynchos), and Red Knot (Calidris canutus rufa). These species are iconic to various stakeholders.
Our overall approach was to 1) review the relevant levels of environmental assessment and monitoring that apply directly to environmental and ecosystem management, providing some examples, 2) provide the ecological and human dimension characteristics that are important for examining assessment, monitoring, management and public policy needs for four bioindicators (2 fish and 2 bird groups), 3) develop assessment endpoints that can also be used for monitoring for four species within the fish and avian groups, and 4) discuss management options and public policy needs. We focus on anthropogenic effects on these species, as they are the ones that are amenable to management and the development of public policy. We also mention contaminants of concern for each species, and evaluate management options for each. The development of ideas, information on assessment and management, and examples of public policy development are given in the tables to highlight specific aspects.
Our selection of indicator species reflects different lifestyles, habitat use, environmental constraints and exposures, degree of human interest or exploitation, and different management opportunities. All of the species are of interest to one or more recreational, subsistence, or commercial stakeholders, are iconic and symbolic to some Tribes or groups of stakeholders, are managed or protected during some or all of their life cycle, and engender controversy about their management. The fish are managed by federal (National Marine Fisheries Service of National Oceanic and Atmospheric Administration) or state fisheries agencies, and the birds are managed by state and federal resource agencies, as well as Treaties between the United States, Mexico and Canada (Migratory Bird Treaty Act of 1918).
There are several levels of environmental assessment that are essential to evaluate the health and well-being of ecosystems, to manage these systems, and to develop viable, cost-effective and equitable public policies to sustain them (Table 1, [7]). Sustainability is management of opportunities and resources for future generations, and the ability of ecosystems to continue to provide goods and services for societies [8]. These assessment levels are also used to develop monitoring plans to determine trends before effects become catastrophic. Table 1 also provides examples of management implications for each assessment type, as well as public policy implications.
2. Bioindicator Characteristics
Below we briefly discuss life histories of the bioindicators, but the salient points for assessment are given in Table 2. We include their special value to people, resource use, and management and public policy implications because these provide the rationale for their use and importance.
2.1. Chinook Salmon
Salmon lay their eggs in freshwater, migrate to the sea as juveniles, and return years later as mature adults to breed and then die. They are heavily fished recreationally and commercially, and are culturally important to Native Americans [9]. Salmon declines have resulted in cultural deprivation for some Native American tribes that have been using Salmon from the Columbia River Basin for about 9000 years [10]. Five species of Salmon breed in the northwestern United States, and the Hanford Reach of the Columbia River (adjacent to the Department of Energy’s Hanford Site) is one of the most significant US spawning habitats for fall Chinook Salmon [11]. Salmon conservation in the Pacific Northwest is complicated by the hydroelectric system of dams, commercial and recreational harvesting, genetic distinctiveness of many “stocks”, and controversial supplementation by hatchery fish [12,13]. Sometimes hatchery fish produce more offspring that reach adulthood than wild Salmon [14]. Salmon runs have been severely impacted by dams that prevent access to their traditional upstream spawning areas [15]. The biggest habitat difficulty is the inability of Salmon to reach their traditional spawning grounds. One wildlife management conclusion is that spawning rivers should be returned to normative water flows, habitats, and communities [16].
Salmon eggs are laid in gravel at the bottom of streams and rivers, where they are vulnerable to contaminants in pore water from groundwater upwellings. Selection of nest sites within spawning areas (redds) is therefore critical to reproductive success, and spawning habitat is limited by deep water and low water velocity [15]. Important substrate characteristics are pebble count (pebbles or stones allow for water movement), grain size in the nesting area, water depth, and water velocity. The spawning areas need downward flow of water through the part of the nest where the eggs are located (eggs are about 20 cm below the river bottom surface) for oxygenation. Water must flow at least to these depths; Salmon prefer nesting in areas with water velocities greater than 1 m/s, and where stream flow fluctuations are reduced [17]. Landscape factors that account for Salmon recruitment include variations in the percent of land that was urban, proportion of stream length failing to meet water quality stan
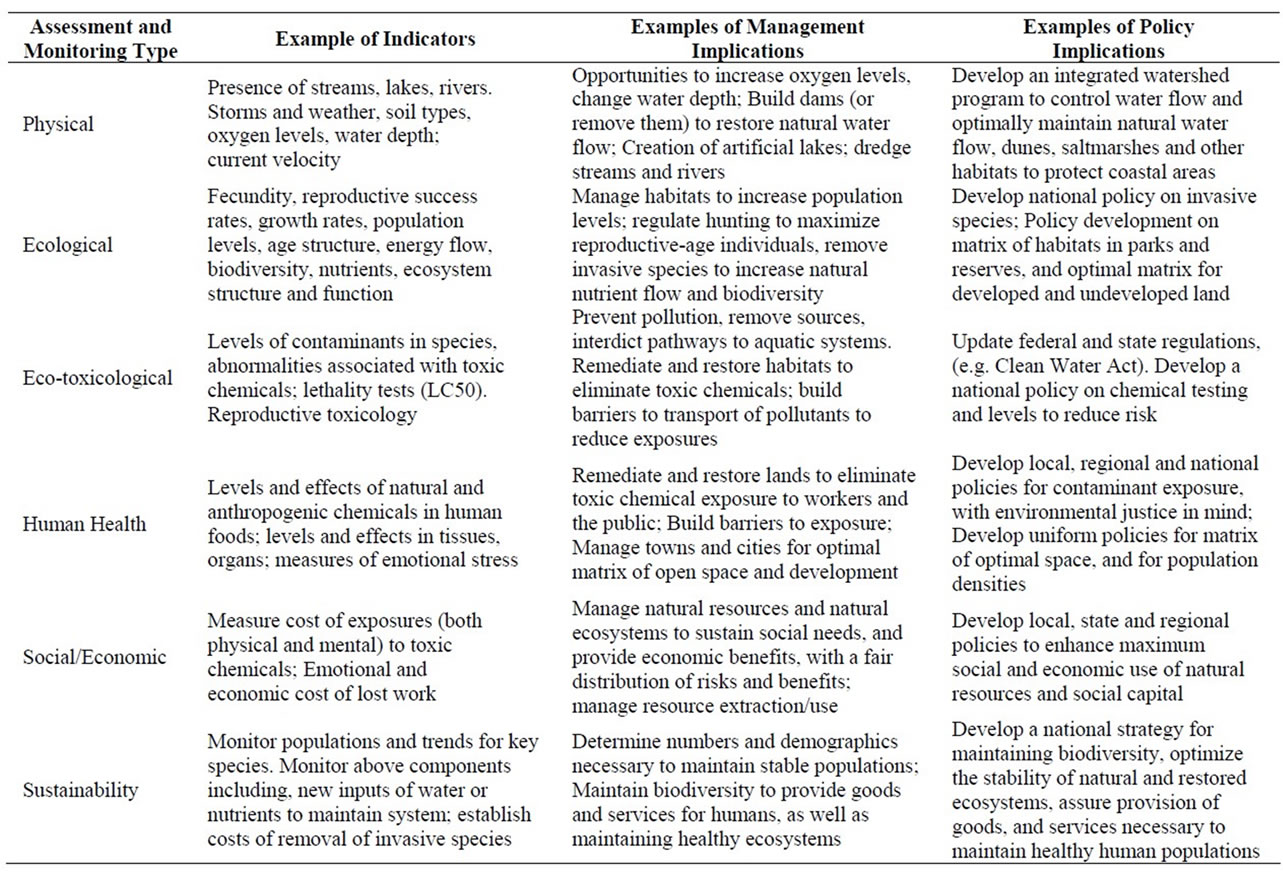
Table 1. Types of assessment and monitoring required for management and policy. Initial assessment types after Burger et al. (2013). We give examples in each category.
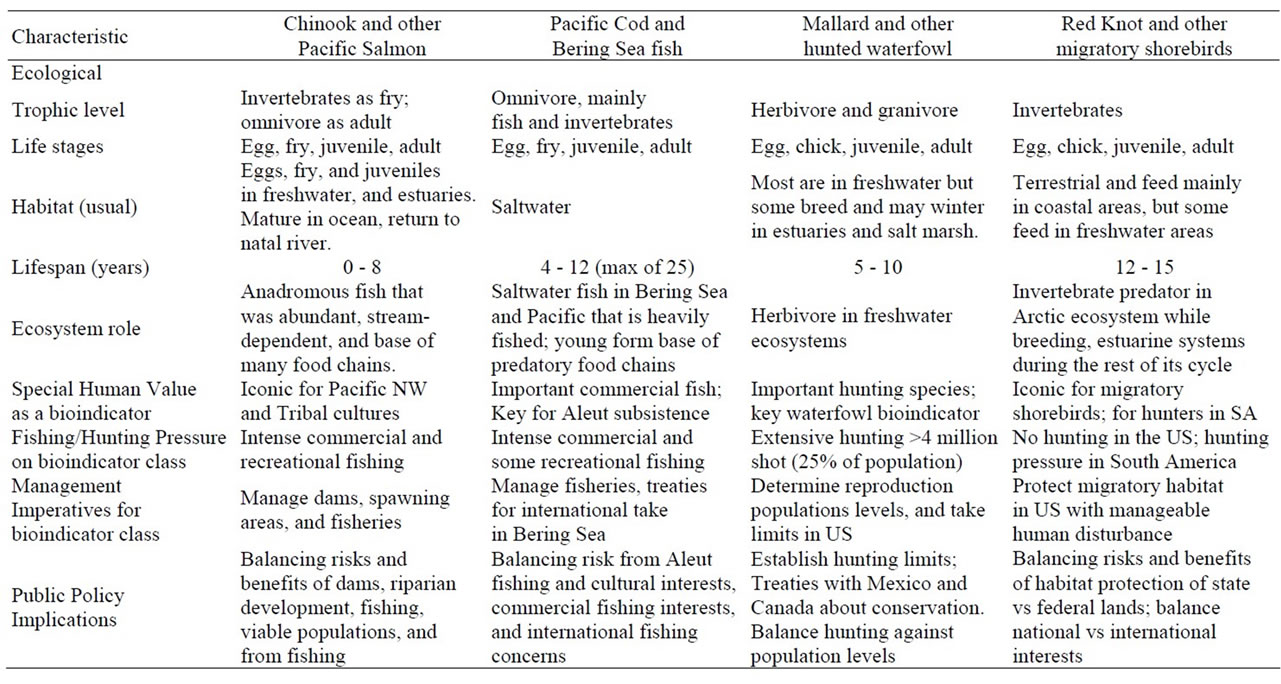
Table 2. Characteristics that result in competing ecological and societal/cultural demands, using sensitive and iconic species as bioindicators.
dards, and index of ability of streams to recover from sediment flow events [18]. Agricultural, industrial, and residential runoff also must be considered. Additionally, there is concern about the potential impacts of chromium (hexavalent) on Salmon eggs and young specifically at the Hanford site [11]. Understanding the levels of assessment, measurement endpoints, and management is critical to developing sound public policy. The Pacific Northwest is embroiled in major public policy debates about how to restore Pacific Salmon. Because of its importance to Native American tribes in the area, to recreational fishermen, and to ecosystem integrity in the northwestern US, it is critical to understand the factors affecting population health and stability.
2.2. Pacific Cod
Pacific Cod are ocean fish that live and feed near the bottom of the continental shelf of the northern Pacific Ocean [19]. They have an important ecosystem role as both prey (when they are small) and predator when they are larger. They are important prey for Halibut (Hippoglossus stenolepis), seals, and whales. Growth and maximum size are dependent on latitude (northern fish are larger), likely due to the longer growing season (e.g. total thermal energy received [19]. They are important and lucrative commercial fish from the Pacific [20], and are found in supermarkets throughout the US, especially given the crash of the Atlantic Cod fishery (Gadus morhua). They are also an important subsistence fish for the Aleuts living in the Aleutian Islands [21]. Because Cod are such an important subsistence and commercial fish, and have a key role in the food chain, it has been critical to examine contaminant levels, such as mercury, PCBs and radionuclides [22,23]. Pacific Cod release all their eggs in a single spawning event in the winter, and their eggs develop near the ocean bottom. Females increase their reproductive output by releasing a large number (millions) of eggs. Ocean temperature may play a role in egg survival, incubation time, and hatching rate [24], making water temperature an important variable. Cod move into deeper water in the fall, and return to shallow water in the spring.
2.3. Mallard
The Mallard is the most widely-distributed duck in North America and the World. In North America it breeds from the Aleutian Islands, south to Baja California and in the past century it has extended its breeding range across North America to the Atlantic Coast. It is a familiar pond and park species, and is hunted throughout North America. The Mallard’s success can be attributed to its broad habitat tolerance, hardiness in cold climates, catholic food tastes, and tolerance of people [25]. They nest in pothole lakes, marshes, farmlands, forests, urban parks, and backyards. They eat aquatic vegetation, seeds and agricultural crops. Like other species of ducks, males take no part in nest site selection, nest construction, incubation or care of the young; the pair bond is temporary. Females hide nests in grass, lay up to 15 eggs, and delay incubation until all eggs are laid (young hatch synchronously [25]). Newly hatched ducklings are precocial, able to walk and feed on their own, and they leave the nest, following the female to water, within a day or two. In urban areas, male Mallards sometimes protect females throughout incubation [26]. In shallow water, Mallards feed by tipping up, and reaching through the water to feed on the bottom vegetation. They also feed on grain in fields, and in woodlands on nuts and other vegetation [27].
The US Mallard population varies around a management goal of 8 million. In the mid-2000s breeding populations were at least 2 million below the goal [28]. The North American population is estimated at over 9 million [29]. Wintering Mallards use both freshwater and saltwater coastal marshes [30]. These marshes are vulnerable not only to habitat loss, but to salt water intrusion from channel dredging, and changes in sediment from levee construction [30]. The Louisiana marshes traditionally served as important overwintering habitat for dabbling ducks, but these marshes are disappearing at an alarming rate (about 100 km2/year [31]). Effective management or what the Fish and Wildlife Service calls “adaptive management” requires determining the relative effect of all sources of mortality. Natural mortality is higher than hunting mortality [32], but the annual Mallard Harvest is above 4 million birds [33], and hunters harvest about 20% - 25% of the autumn Mallard population [25].
2.4. Red Knot
Red Knots are medium-size sandpipers that breed in the Arctic and migrate long-distance (up to 30,000 km) to the southern hemisphere [34]. The eastern North American subspecies (Calidris c. rufa), winters along the Atlantic coast as far south as Tierra del Fuego in South America [35]. Knots have declined drastically in the past 30 years, and only 20,000 - 30,000 Knots remain in the Western Hemisphere, compared to over 100,000 in the late 1980s [36]. For most of the year, Knots feed on tiny invertebrates along the tideline or in mudflats [37], but on their northward spring migration, the birds depend on the eggs of Horseshoe Crabs (Limulus polyphemus) in Delaware Bay [36]. During their brief (two week) stopover, the Knots need to nearly double their weight to allow for the long migration, north to the Arctic, and to have sufficient fat resources to lay eggs upon arrival [38]. They arrive on the wet Arctic tundra just after snow melt, when food is still scarce, and females deplete their body fat to lay their clutch of 4 eggs. Some Knots migrate relatively short-distances to the southern US and the Caribbean, while others migrate to Tierra del Fuego, which results in very different habitat requirements. Of the four indicator species discussed, Red Knots migrate the longest distance, accounting for their risk [36]. Because Knots depend upon coastal and estuarine environments during most of their life cycle, Global warming and increased sea level will result in severe habitat loss for Knots because they spend more than 70% of their life cycle there; Galbraith et al. [39] predicted that major intertidal habitat losses for shorebirds in four key estuaries will likely range from 20% to 70%.
3. Measurement Endpoints, Stakeholder Involvement, Management and Public Policy
Assessment and measurement endpoints are critical for management and the development of public policy. Assessment endpoint refers to the quality to be assessed (e.g. healthy populations), while measurement refers to a variable that can be measured (e.g. number of breeding adults, number of young produced). However, metrics are most effective when a full range of stakeholders are involved in the development, gathering of relevant information, and use in determining management options and developing public policy [4]. Three aspects are described in Table 3, with brief descriptions for each of the indicators species given.
Measurement endpoints for Salmon relate to freshwater characteristics, mainly because Salmon are vulnerable to anthropogenic factors (including contaminants) there, and managers can more easily manipulate watershed conditions. Assessment endpoints include water flow, water depth, pebble size, bank slope, siltation, and dissolved oxygen (physical monitoring), conspecific nesting density, food availability and reproductive measures (ecological monitoring), contaminants and abnormalities in different stages (ecotoxicological monitoring). Other measurement endpoints include Salmon landings, size and health of the Salmon, contaminant levels toxic for consumption (human health monitoring), and monies derived from Salmon fishing licenses, fish hatcheries, and other businesses associated with Salmon fishing, as well as the cultural and nutritional benefits for Native American Tribes (cultural/economic monitoring) (Table 3).
Physical measurement endpoints for Pacific Cod are easier to define because they spend their entire life in one habitat (Northern Pacific) where the critical variable is food availability, which in turn depends on water temperature and growing season, currents, and visibility and total light exposure (Table 3). Ecological and eco-toxicological measurement endpoints for Cod are similar to those of Salmon. Similarly, the same pollutants can affect their growth, reproduction, and survival.
In Mallards, breeding success is dependent upon the number of available and suitable breeding sites with associated wetlands for foraging, thus measurement endpoint relate to nesting and foraging qualities, as well as hunting pressure and contaminants (Table 3). These include availability of wetlands and water depth, food, which in turn influence reproductive success, growth rates, and survival (Table 3).
Measurement endpoints for Red Knots include: percent snow cover and temperatures in the Arctic, predator cycles, amount of available tidal flats for feeding (physical monitoring, water depth) in coastal US, number of Horseshoe Crab eggs on migration stopovers, density of prey (invertebrates), reproductive success, survival, longevity, populations levels at particular stopover or wintering sites (ecological monitoring), contaminant levels in eggs, feathers and other tissues (ecotoxicology), and percent habitat without human disturbance (Table 3) In the Caribbean and South America Red Knots are captured for food.
4. Interests of Stakeholders: Mutual Concerns and Conflicts
There are many different “stakeholders” that are interested in, and affected by issues that surround the bioindicators discussed above. These include resource and regulatory agencies of US federal and Tribal governments, and state and local governments, as well as scientists, conservationists, Tribal members, resource users, and all other interested and affected parties (Table 4). Resource users may have a consumptive (fishing, hunting) or non-consumptive (aesthetic, bird watching) interest. Although their interests may sometimes differ, they overlap frequently. For most stakeholders, resource protection and the maintenance of healthy populations are of paramount importance, although the population levels deemed sufficient may differ. Further, some agencies or individuals are primarily interested in the welfare of the bioindicator, while others are interested in resource extraction, and still others are interested in the total relationship between the species and human needs and culture (e.g. Tribal interests [40]). Even so, reaching consensus among stakeholders is an important management goal that leads to more effective public policy.
5. Conclusions
For decades environmental management was in the realm

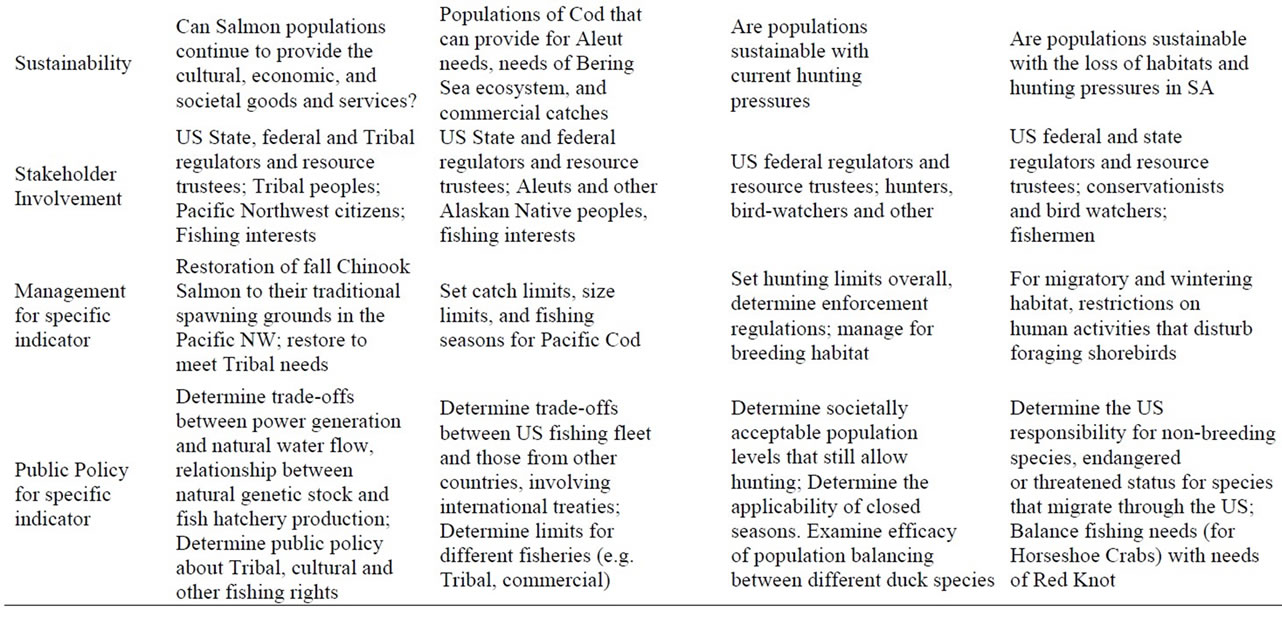
Table 3. Assessment and measurement endpoints for determining the impact of actions on populations, using several species as examples. management options and public policy decisions are examples of potential actions, and indicate the relationship between indicator measurement endpoints and actions for bioindicator species.
of “environmental managers”, scientists, conservationists and other who considered themselves professionals. In recent decades, however, the realization that reaching viable, equitable, and acceptable environmental decisions requires the involvement of consumers, Tribal governments (and their people) as well as a range of stakeholders [4,41,42]. Although differences in perceptions between different governments (US and Tribal), different agencies within governments (and between state and federal), and between governments and different stakeholders, may result from differences in information or interpretation of that information [43], it is clear that involvement of different stakeholders with different views should lead to better and more widely acceptable envi-
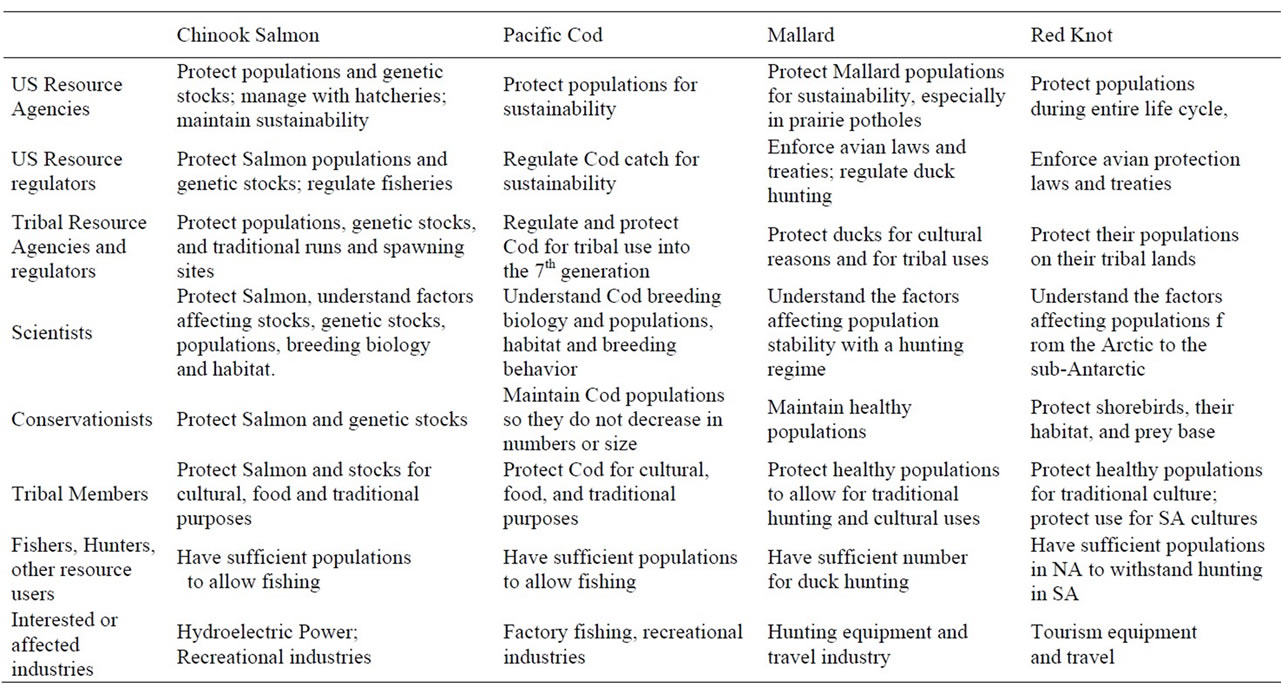
Table 4. Possible conflicts between managers, management goals and resource users. We list only some of the goals.
ronmental decisions [44,45]. Thus, it is extremely important to include the full range of stakeholders in environmental assessment, monitoring and management, and in the ultimate development of public policy, to assure ongoing public support for the management decisions and monitoring programs.
Environmental management is often required because of one or more of the following reasons: 1) natural environmental stressors, including competition and predation, 2) anthropogenic stressors, including landscape, physical, chemical and biological, and 3) global changes that can be natural or anthropogenic (e.g. climate change, El Nino events). In all cases, the populations of the indicator species discussed in this paper are partly threatened because they are classic cases of the “Tragedy of the Commons” [46,47]. That is, all four species are “used” by different stakeholder groups, and exploitation by one or several groups can decrease the availability of the species for other groups. Even though all four are “managed”, “harvested”, and variously “protected” during some or part of their life cycle, controversies still occur. Further our paper does not address how to integrate the results from the different assessment categories. This task will involve consensus discussions among stakeholders with different views.
Based on the combination of bioindicators discussed in this paper, we suggest that 1) there are many levels of assessment (physical to sustainability), 2) key measurement endpoints include human health and sustainability as well as the traditional physical, ecological and ecotoxicological endpoints, 3) there is great variation in life histories, reproductive potential, and population dynamoics, 4) the biology and life histories of species influence the key measurement endpoints for assessment, 5) assessment and measurement endpoints are essential to determining species and ecosystem management, 6) endpoints that direct management then lead to development of public policy, and 7) the above aspects require stakeholder involvement in all phases. We conclude that these suggestions will lead to better, more effective environmental management and development of better public policy.
6. Acknowledgements
We thank the following for valuable discussions and logistical help: L. Bliss, G. Bohnee, C. Chess, C. Duncan, M. Gilbertson, S. Golian, D. Jenkins, R. Jim, C. Minton, and H. Sitters. We thank the many organizations and individuals who contributed throughout this research. This project was mainly funded by the Consortium for Risk Evaluation with Stakeholder Participation (Department of Energy, DE-FC01-86EW07053), with additional funding from NIEHS ((P30ES005022), US Fish and Wildlife Foundation, NJ Department of Environmental Protection (Endangered and Nongame Program), Conserve Wildlife Foundation of New Jersey, Endangered and Nongame Species Program of the NJ Department of Environmental Protection, and Rutgers University. The views and opinions expressed in this paper are those of the authors, and do not represent the funding agencies.
REFERENCES
- European Environment Agency, “Environmental Indicators: Typology and Use in Reporting,” EEA, Copenhagen, 2003.
- U. Heink and I. Kowarik, “What are indicators? On the Definition of Indicators in Ecology and Environmental Planning,” Ecological Indicators, Vol. 10, No. 3, 2010, pp. 584-593. doi:10.1016/j.ecolind.2009.09.009
- J. Burger, “Bioindicators: Types, Development, and Use in Ecological Assessment and Research,” Environmental Bioindicators, Vol. 1, No. 1, 2006, pp. 22-39. doi:10.1080/15555270590966483
- National Research Council (NRC), “Public Participation in Environmental Assessment and Decision Making,” National Academy Press, Washington, D.C., 2008.
- Environmental Protection Agency (EPA), “Environmental Justice: Compliance and Environment,” EPA, Washington, D.C., 2009. http://www.epa.gov/environmentaljustice
- J. Burger and M. Gochfeld, “Conceptual Environmental Justice Model: Evaluation of Chemical Pathways of Exposure in Low-Income, Minority, Native American, and Other Unique Exposure Populations,” American Journal of Public Health, Vol. 101, Suppl. 1, 2011, pp. S64-S73.
- J. Burger, M. Gochfeld, C.W. Powers, L. Niles, R. Zappalorti, J. Feinberg and J. Clarke, “Habitat Protection for Sensitive Species: Balancing Species Requirements and Human Constraints Using Bioindicators as Examples,” Natural Sciences, Vol. 5, No. 5A, 2013, pp. 50-62.
- ESA (Ecological Society of America), “The Report of the Ecological Society of America Committee on the Scientific Basis for Ecosystem Management,” ESA, 1996. http://www.fs.fed.us/eco/ecmtext.htm
- CRITFC (Columbia River Inter-Tribal Fish Commission), “We are Salmon People,” 2013, CRITFC. http://critfc.org/salmon-culture/columbia-river-salmon/columbia-river-salmon-species
- V. L. Butler and J. E. O’Connor, “9000 Years of Salmon Fishing on the Columbia River, North America,” Quaternary Research, Vol. 62, No. 1, 2004, pp. 1-8. doi:10.1016/j.yqres.2004.03.002
- OHWB (Oregon Hanford Waste Board), “River without Waste: Recommendations for Protecting the Columbia River from Hanford Site Nuclear Waste,” 2002, USDOE, Hanford, Richland.
- S.-Y. Hyun, R. Sharma, J. K. Carlile, J. G. Norris, G. Brown, R. J. Briscoe and D. Dobson, “Integrated Forecasts of Fall Chinook Salmon Returns to the Pacific Northwest,” Fisheries Research, Vol. 125-126, 2012, pp. 306-317. doi:10.1016/j.fishres.2012.03.002
- K. K. Holsman, M. D. Scheuereil, E. Buhle and R. Emmett, “Interacting Effects of Translocation, Artificial Propagation, and Environmental Condition on the Marine Survival of Chinook Salmon from the Columbia River, Washington, USA,” Conservation Biology, Vol. 26, No. 5, 2012, pp. 912-922. doi:10.1111/j.1523-1739.2012.01895.x
- M. A. Hess, G. D. Rabe, J. L.Vogel, J. J. Stephenson, D. D. Nelson and S. R. Narum, “Supportive Breeding Boosts Natural Population Abundance with Minimal Negative Impacts on Fitness of a Wild Population of Chinook Salmon,” Molecular Ecology, Vol. 21, No. 21, 2012, pp. 5236-5250.
- T. P. Hanrahan, D. D. Dauble and D. R. Geist, “An Estimate of Chinook Salmon (Oncorhynchus tshawytscha) Spawning Habitat and Red Capacity Upstream of a Migration Barrier in the Upper Columbia River,” Canadian Journal of Fisheries and Aquaculture Science, Vol. 61, No. 1, 2004, pp. 23-33. doi:10.1139/f03-140
- R. N. Williams, P. A. Bisson, D. L. Botton, L. D. Calvin, C. C. Coutant, M. W. Erho Jr., C. A. Frissell, J. A. Lichatowich, W. J. Liss, W. E. McConnaha, P. R. Mundy, J. A. Stanford and R. R. Whitney, “Return to the River: Scientific Issues in the Restoration of Salmonid Fishes in the Columbia River,” Fisheries, Vol. 24, No. 3, 1999, pp. 10- 19. doi:10.1577/1548-8446(1999)024<0010:RTTRSI>2.0.CO;2
- J. R. Hatten, K. F. Tiffan, D. R. Anglin, S. L. Haeseker, J. J. Skalicky and H. Schallerm, “A Spatial Model to Assess the Effects of Hydropower Operations on Columbia River Fall Chinook Salmon Spawning Habitat,” North American Journal of Fisheries Management, Vol. 29, No. 5, 2009, pp. 1379-1405. doi:10.1577/M08-053.1
- J. Regetz, “Landscale-Level Constraints on Recruitment of Chinook Salmon (Oncorhynchus tshawytscha) in the Columbia River, USA,” Aquatic Conservation: Marine and Freshwater Ecosystems, Vol. 13, No. 1, 2003, pp. 35- 49. doi:10.1002/aqc.524
- O. A. Ormseth and B. L. Norcross, “Causes and Consequences of Life-history Variation in North American Stocks of Pacific Cod,” Journal of Marine Sciences, Vol. 66, No. 2, 2009, pp. 349-357
- K. M. Cunningham, M. F. Canino, I. B. Sples and L. Hauser, “Genetic Isolation by Distance and Localized Fjord Population Structure in Pacific Cod (Gadus macrocephalus): Limited Effective Dispersal in the Northeastern Pacific Ocean,” Canadian Journal of Fisheries and Aquatic Sciences, Vol. 66, No. 1, 2009, pp. 153-166. doi:10.1139/F08-199
- K. Hamrick and J. Smith, “Subsistence food use in Unalaska and Nikolski,” Aleutian Pribilof Island Association, Anchorage, 2003.
- J. Burger, M. Gochfeld, T. Shukla, C. Jeitner, S. Burke, M. Donio, S. Shukla, R. Snigaroff, D. Snigaroff, T. Stamm and C. Volz, “Heavy Metals in Pacific Cod (Gadus macrocephalus) from the Aleutians: Location, Age, Size and Risk,” Journal of Toxicology and Environmental Health, Vol. 70, No. 22, 2007, pp. 1897-1911. doi:10.1080/15287390701551159
- S. Hardell, H. Tilander, G. W. Smith, J. Burger and D. O. Carpenter, “Levels of Polychlorinated Biphenyls (PCBs) and Three Organochlorine Pesticides in Fish from the Aleutian Islands of Alaska,” PloS One, Vol. 5, No. 8, 2010, pp. 1-11. doi:10.1371/journal.pone.0012396
- J. J. Hart, “Pacific Fishes of Canada,” Fisheries Research Board of Canada, Ottawa, 1973.
- N. Drilling, T. Rodger and F. Mckinney, “Mallard (Anas platyrhynchos),” The Birds of North America Online Cornell Lab of Ornithology, Ithaca, 2012. http://bna.birds.cornell.edu/bna/species/658
- J. Burger, “A Naturalist along the Jersey Shore,” Rutgers University Press, 1996.
- H. M. Stevenson and B. H. Anderson, “The Bird Life of Florida,” University Press of Florida, Tampa, 1994.
- United States Fish and Wildlife Service (USFWS), “Waterfowl Population Status, 2011,” US Department of the Interior, Washington, D.C., 2011.
- S. Delany and D. Scott, “Waterbird, Population Estimates,” 4th Edition, Wetlands International, Wageningen, 2006, pp. 1-23.
- P. T. Link, A. D. Afton, R. R. Cox and B. E. Davis, “Use of Habitats by Female Mallards Wintering in Southwestern Louisiana,” Waterbirds, Vol. 34, No. 4, 2011, pp. 429-438. doi:10.1675/063.034.0405
- S. M. Gagliano, K. J. Meyer-Arendt and K. M. Wicker, “Land Loss in the Mississippi River Deltaic Plain,” Transactions of the Gulf Coast Association of Geology Society, Vol. 31, 1981, pp.: 295-300.
- J. F. Bergan and L. M. Smith, “Survival Rates of Female Mallards Wintering in the Playa Lakes Region,” Journal of Wildlife Management, Vol. 57, No. 3, 1995, pp. 570- 577. doi:10.2307/3809284
- R. V. Raftovich, K. A. Wilkins, S. S. Williams, H. L. Spriggs and K. D. Richkus, “Migratory Bird Hunting Activity and Harvest during the 2009 and 2010 Hunting Seasons,” US Fish and Wildlife Service, Laurel, 2011.
- A. J. Baker, P. M. Gonzalez, T. Piersma, L. J. Niles, L. J., I. L. S. Nascimento, P. W. Atkinson, N. A. Clark, C. D. T. Minton, M. K. Peck and G. Aarts, “Rapid Population Decline in Red Knots: Fitness Consequences of Decreased Fueling Rates and Late Arrival in Delaware Bay,” Proceedings of the Royal Society of London B, Vol. 271, No. 1541, 2004, pp. 875-882.
- J. Burger, L. J. Niles, R. R. Porter, A. D. Dey, S. Koch, and C. Gordon, “Migration and Over-wintering of Red Knots (Calidris canutus rufa) along the Atlantic Coast of the United States,” Condor, Vol. 114, No. 2, 2012, pp. 1-12.
- L. J. Niles, H. P. Sitters, A. D. Dey, P. W. Atkinson, A. J. Baker, K. A. Bennett, R. Carmona, K. E. Clark, N. E. Clark, C. Espoz, P. M. González, B. A. Harrington, D. E. Hernández, K. S. Kalasz, R. G. Lathrop, R. N. Matus, D. C. T. Minton, R. I. G. Morrison, M. K. Peck, W. Pitts, R. A. Robinson and I. L. Serrano, “Status of the Red Knot, Calidris canutus rufa, in the Western Hemisphere,” Studies in Avian Biology, Vol. 36, 2008, pp. 1-185.
- K. Withers, “Shorebird Use of Coastal Wetlands and Barrier Island Habitat in the Gulf of Mexico,” Science World Journal, Vol. 2, 2002, pp. 514-536. doi:10.1100/tsw.2002.112
- R. I. G. Morrison, N. C. Davidson and J. R. Wilson, “Survival of the Fattest: Body Stores on Migration and Survival in Red Knots, Calidris canutus islandica,” Journal of Avian Biology, Vol. 38, No. 4, 2007, pp. 479-487.
- H. Galbraith, R. Jones, R. Park, J. Clough, S. HerrodJulius, B. Harrington and G. Page, “Global Climate Change and Sea Level Rise: Potential Losses of Intertidal Habitat for Shorebirds,” USDA Forest Service Technical Report PSW-GTR-191, 2005.
- D. Landeen and A. Pinkham, “Salmon and His People,” Confluence Press, Lewiston, 1999.
- PCCRAM (Presidential/Congressional Commission on Risk Assessment and Management), “Risk Assessment and Management in Regulatory Decision-Making,” US Government Printing Office, Washington DC, 1997.
- J. Burger and M. Gochfeld, “Changes in Aleut Concerns Following the Stakeholder-driven Amchitka Independent Science Assessment,” Risk Analysis, Vol. 29, No. 8, 2009, pp. 1156-1169.
- J. Burger, M. Gochfeld and T. Fote, “Stakeholder Participation in Research Design and Decisions: Scientists, Fishers, and Mercury in Saltwater Fish,” EcoHealth, Vol. 10, No. 1, 2013, pp. 21-30.
- R. Munoz and M. D. Fox, “Research Impacting Social Contexts: The Moral Import of Community-Based Participatory Research,” American Journal of Bioethics, Vol. 11, No. 5, 2011, pp. 37-38. doi:10.1080/15265161.2011.562597
- NIEHS (National Institute of Environmental Health Sciences), “Environmental Justice and Community-based Research.” http://niehs.nih.gov/research/supported/programs/justice.
- G. Hardin, “The Tragedy of the Commons,” Science, Vol. 162, No. 3859, 1968, pp. 1243-1248. doi:10.1126/science.162.3859.1243
- J. Burger and M. Gochfeld, “The Tragedy of the Commons 30 Years Later,” Environment, Vol. 40, No. 10, 1998, pp. 4-13. doi:10.1080/00139159809605104