Journal of Environmental Protection
Vol.4 No.6(2013), Article ID:33328,7 pages DOI:10.4236/jep.2013.46069
Comparison of a Soil Vulnerability Map for Tetracycline Soil Contamination at a Global and Local Scale
![]()
Research Centre in Animal Health, CISA-INIA, Ctra Algete-El Casar s/n, Madrid, Spain.
Email: torre@inia.es
Copyright © 2013 Ana De la Torre et al. This is an open access article distributed under the Creative Commons Attribution License, which permits unrestricted use, distribution, and reproduction in any medium, provided the original work is properly cited.
Received February 28th, 2013; revised March 30th, 2013; accepted April 27th, 2013
Keywords: Tetracyclines; Soil Contamination; Vulnerability Map; Europe; GIS
ABSTRACT
Recently, de la Torre [1] provided an approach for assessing the vulnerability of European soils for tetracyclines, fluoroquinolones and sulfamides contamination using a spatial risk assessment. It allowed identifying areas where vulnerable soil more occur, providing useful information for policies designed to reduce contamination. In the current study, this approach was applied to a local level, the autonomous region of Castile and León (C&L), located in the north-west part of Spain. High accurate and reliable source data were employed to generate a soil vulnerability map for tetracyclines in the study area, attempting to improve the release and consequence risk prediction. More specifically, pig density, temperature and soil use risk estimators were improved using data from national or local databases. Result comparison between the European and the present approach showed a good agreement demonstrating the utility of the European vulnerability map to be employed not only at global level but also for deciding how to allocate limited resources on national or subnational environmental surveillance programs of antibiotics. The model application at local level using more accurate data from national or local sources, afforded a better understanding of the spatial distribution of the risk, mainly associated with the higher accuracy of the national land use database SIOSE. It could offer a useful tool for local management of the risk, such as the management of animal manures fertilization on soil.
1. Introduction
Within the last decade, a more complex investigation of antibiotic substances has been undertaken in order to permit an assessment of the environmental risks they may pose [2,3]. An increasing number of studies covering antibiotic input, occurrence, fate and effects have been published but field data are yet large scarce for which the problem cannot be reliably quantified. For this reason, different countries have conducted a priorization of veterinary antibiotics [4-6] and have initiated monitoring programmes for the characterization of antibiotic distribution in the environment.
Since the consistent and accurate data required for the assessment analysis under consideration is a massive amount, very expensive or time-consuming to collect, the use of predictive models should be considered as a valuable tool. The utility of GIS-based predictive models has been previously demonstrated for assessing environmental quality on organic and inorganic contamination on soils and waters at an European [7-11] and national scale [12,13]. Risk maps for antibiotic contamination have also been provided for Europe for both surface waters [14] and soils [1].
But for any study that has a spatial component, the accuracy and precision of the results depend on the geographical scale and correctness of the source data set. In the approach developed by de la Torre [1] for assessing the vulnerability of European soils to antibiotic contamination, source data of all risk estimators were gathered from global distribution maps created through the spatial disaggregation of sub-national statistical data or by satellite. Therefore, this European vulnerability map is useful to compare risk level among countries and for identifying the most important areas at risk. The model application to local level requires the use of precised source data from the area under study. It would allow to deeper analyze the risk for the local scenario and would facilitate tacking decisions by local authorities to manage prevention actions against soil contamination from antibiotics excreted through animal manure.
The study presented here, is intended to apply the approach developed by de la Torre [1] at a local scale (the authonomous region of Castile and León) to create a vulnerability soil map for tetracyclines using spatially precise information of pig density, temperature and soil land use. Comparison between the results of the present approach and the European vulnerability soil map for tetracyclines published by de la Torre [1] will be done in order to identify the benefits of the risk assessment analysis performed at local level.
2. Material and Methods
A risk analysis to measure soil vulnerability to tetracyclines contamination has been performed in the Castile and León region (C&L) (Madrid, north-west of the Iberian Peninsula) that is not only the largest region of Spain, but as well the third largest region of all the European Union.
2.1. Study Area
Castile and León covers an area of 94,273 km2, or 18.6% of Spanish territory. It is an inland region whose main features are a large surface area, low population density and a sizeable rural community. Agriculture remains a key sector in the production structure, mainly located in the central plain of the region. Most of the cultivated area is devoted to cereals, especially barley, although maize and sunflowers are becoming more and more important. Castile and León is the second most important region in pig population in Spain (14.6%) and produces 6,936,686 m3 of manure per year [15].
In administrative terms, C&L is divided into nine provinces, Avila, Burgos, León, Palencia, Salamanca, Segovia, Soria, Valladolid and Zamora.
2.2. Risk Analysis
The risk analysis has been based on the approach developed by de la Torre [1] that consists of four steps: release assessment, exposure assessment, consequence assessment and risk estimation.
Briefly, release of antibiotics into the environment through the agricultural reuse of animal manure was indirectly assessed as livestock density, assuming that the amount of antibiotics released into the environment is proportional to livestock production. Exposure was estimated as the antibiotic potential to contaminate soil using a qualitative standard approach adapted from ISO 15175 [16]. According to the ISO, the antibiotic potential to contaminate soil is a function of its binding and permanence potential. The binding rate is estimated as a combination of the soil organic carbon content (%) and the antibiotic adsorption value (Koc, l/kg) whereas the permanence rate combines the mean temperature (˚C) and the antibiotic degradation value (DT50, days). Consequence was modeled based on soil uses. Since veterinary medicines are released into the environment primarily when manure from medicated animals is applied to the land as fertiliser, agricultural and pasture soil uses were the target area. Finally, risk was estimated by combining release, exposure and consequences using spatial multicriteria decision analysis.
2.3. Risk Estimators
Overall, six well known risk estimators were considered in the approach based on common antibiotic (degradation and adsorption potential), environmental (temperature and organic carbon content) and socio-economical (animal density and land uses) properties.
For comparison proposals between vulnerability soil maps for tetracyclines performed at global scale (1: 10,000) and at local level, similar information about antibiotic risk estimators was employed in both cases. Therefore, to conduct the local approach, data on tetracyclines (oxytetracycline, tetracycline and chlortetracycline) was gathered from de la Torre [1]. Only information about environmental or socioeconomical risk estimators was improved. Source data are briefly described in Table 1 and compared with the source data of the map performed at global scale.
The geographic location of each farm and the number
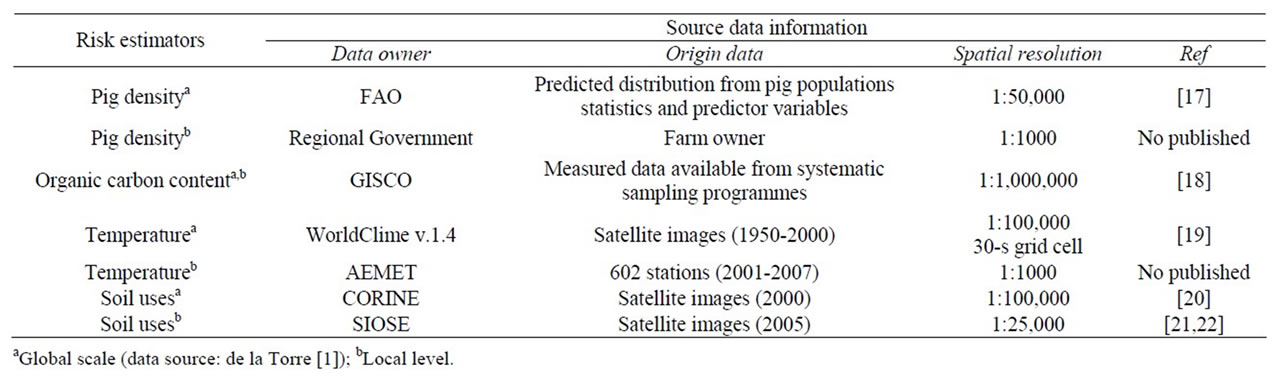
Table 1. List of source data used for mapping risk estimators.
of pigs were obtained from the Regional Government of C&L Region. A kernell map of pig density was generated to be used in the risk analysis.
The mean monthly temperature data were obtained from the observations at the stations of the synoptic and climatological network of the Spanish Meteorological Agency (AEMET). Local data from 602 weather stations from the period 2001-2007 were recorded. Kernell maps of mean temperature were generated for each month to be used in the risk analysis.
The geo-referenced information about land uses was obtained from the Land Cover and Use Information System of Spain (SIOSE) [21,22]. Agricultural and livestock settlements, pastures and herbaceous vegetation (ID code 212, 231, 232, 290, 300, 701, 831) were used for generating a soil use map to be used in the risk analysis.
Information about as the organic carbon content on soil was gathered from the same data source previously employed at global scale, due to more detailed and homogeneous data were not found for the area under study.
2.4. Vulnerability Map
The vulnerability map (grid cell size, 1 km2) was prepared by integrating release, exposure and consequence layers according to de la Torre [1]. The three layers were normalized between 0 and 1 as well as the final outcome. The higher the value of this risk score, the more vulnerable the soil is for tetracyclines. Results were presented using mean and max risk scores by province and visual outputs were represented using risk maps. The study was carried out using ArcGIS 9.3.1 (ESRI©).
3. Results and Conclusions
The vulnerability map for tetracycline contamination on soils performed here incorporates improvements in three of the four environmental and socioeconomical risk estimators susing national or local databases (Table 1).
The most relevant improvement was achieved for the land use risk estimator (Figure 1). SIOSE offered a spatial resolution (1:25,000) higher than the CORINE (Coordination of information on the environment) database used in the global approach (1:100,000). Moreover, SIOSE employed reference date from 2005 instead 2000, using polygonal geometry with minimum mapping unit from 0.5 to 2 ha [23]. It allowed identifying that the agricultural area is mostly located in the central portion of the area under study, corresponding to the typical cereal plateau of the C&L region [24]. It represents more than two thirds of the C&L surface (more than 5,783,831 hectares) mostly yielding cereals such as barley, wheat and corn [25]. The homogeneity and simplification that characterize this agricultural landscape is the result of a process influenced by the physical conditions and the productive specialization in the region [24].
Pig density was improved employing the most updated and disaggregated data for the area under study, that is information on the geographic position and pig census of farms. It provided the best picture of the pig density’s geographical distribution showing the highest values in Segovia, the province with the major swine population of the C&L region (37% of the total) [26] (Figure 2). It should be noted that the pig density map generated at global scale showed similar results (Figure 2). The local level approach employs observed data whereas the global approach is based on predicted livestock densities modeled from observed livestock densities (national or subnational agricultural statistics on livestock populations) and predictor variables (environmental land-cover and land-use criteria such as anthropogenic, demographic, topographic, land cover, temperature, water and moisture, general climatic). This suggests that the georeferenced European data on pig density from FAO (Food and Agriculture Organization) [17] act as a good predictor at sub-national level. Something similar occurred when the temperature risk estimator was improved at local level, showing a similar range of values and a similar geographical distribution than in the global approach. Higher
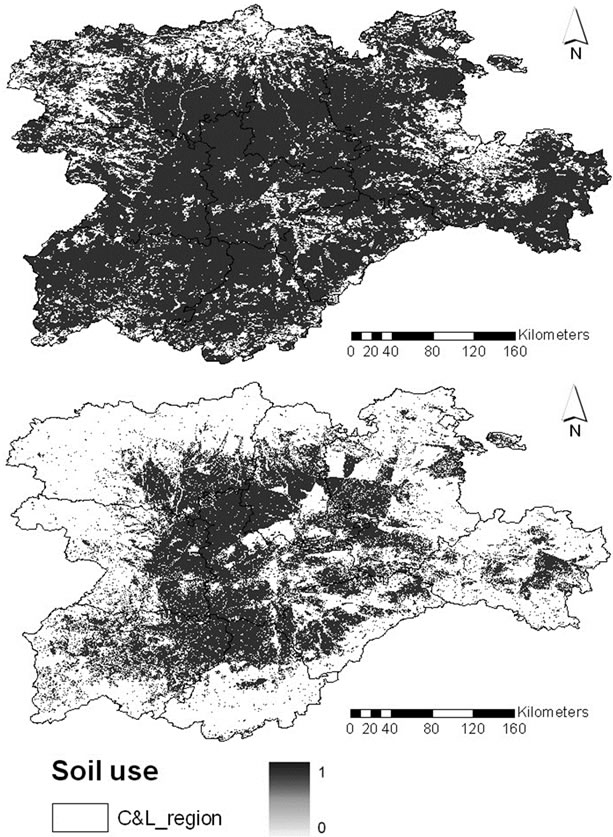
Figure 1. Soil use map of the authonomous region of Castile and León (Spain) generated at global scale (up) and at local level (down).
temperatures were observed in the central plateau whereas lower temperatures were observed in the surrounding mountains. Additionally, the consideration of monthly mean temperature data in the risk analysis performed at local level, allowed to observe an annual and seasonal
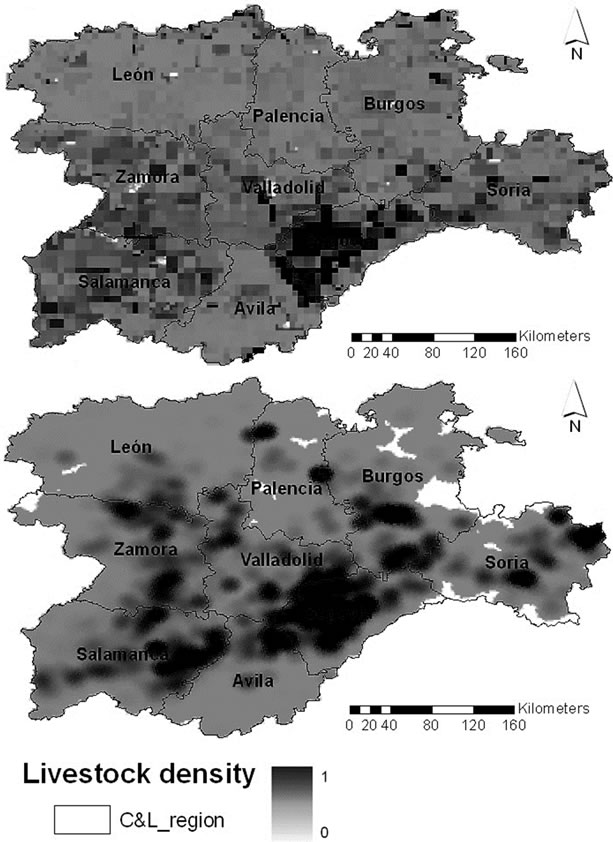
Figure 2. Pig density map of the authonomous region of Castile and León (Spain) generated at global scale (up) and at local level (down).
pattern of temperature variation similar than those previously described for this region [27,28]. Mean monthly values ranged from 4.8˚C in the coldest month to 21.5˚C in the warmer one, but grid temperature variations resulted in a slight variation of the permanence ranking. It is due to variations up to 3 degrees of temperature fall within the same pre-defined permanence category.
Organic carbon was the only risk parameter that could not be improved due to geo-referenced, measured and harmonized data on soil properties are rarely available at local level. At the present time, the most homogeneous and comprehensive data on the organic carbon of European soils remain those that can be extracted from the European Soil Database [29].
Overall, results of the vulnerability map for tetracycline contamination on soils generated at local level were consistent with the risk values of the global approach into the study region. Only slightly higher values were found using the approach at a local level (max = 0.74; mean = 0.05) versus the global scale (max = 0.55; mean = 0.03) (Table 2). Segovia, the C&L province with the major swine population, showed the highest values in both cases (max = 0.74, mean = 0.18 (local level); max = 0.58, mean = 0.02 (global scale)). These results correspond to relative risk values rather than absolute ones. Under this consideration, both vulnerability maps have been able to show the relative variability of the risk within the study area. Moreover, the temporal study performed at local level did not achieve relevant findings to the risk assessment as it showed very little variation in the risk score. Risk values between January and December showed variations of 0.02 - 0.07 (mean) and 0.1 - 0.2 (maximum) depending on the province. This occurs because temperature has been described as one of the less influential risk estimator in the model [1].
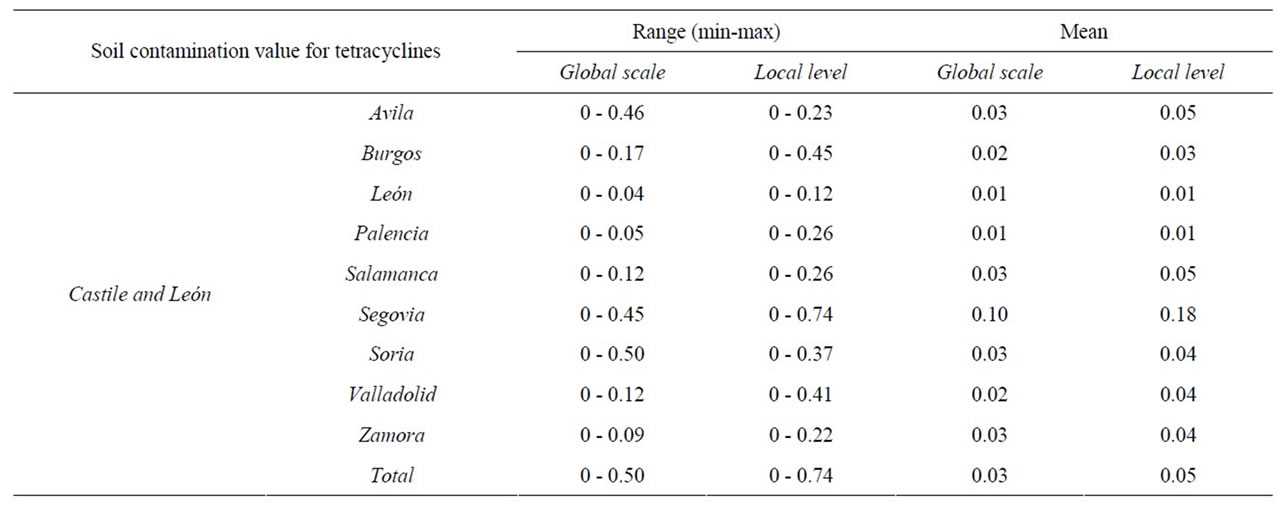
Table 2. Results of the vulnerability map of the authonomous region of Castile and León (Spain) to tetracycline contamination at global scale and at local level.
As could reasonably be expected, local approach provides a better understanding of the spatial predictions of tetracycline soil contamination (Figure 3). Risk areas are mainly concentrated in the central part of the region as a result of the highest accuracy of the soil land use risk estimator. Only where agricultural and pasture uses have been identified, antibiotics can be preset coming from animal manure applied as fertilizer to the land.
These results provide two important findings. The first one is the consistence between the vulnerability map performed at global scale and at local level. This means that the global approach has great potential as a predicttive modeling of antibiotic contamination on soil. The vulnerability map of the European Union soils to antibiotic contamination developed by de la Torre [1] can be successfully used for evaluating the contamination potential of antibiotics not only over large areas but also at smaller administrative level (national or subnational). The target beneficiaries include Ministries, European and National medicine agencies and scientifics who can use this methodology to produce maps for policy formulation, for instance to identify areas considered most at risk from soil contamination by antibiotics and for deciding how to
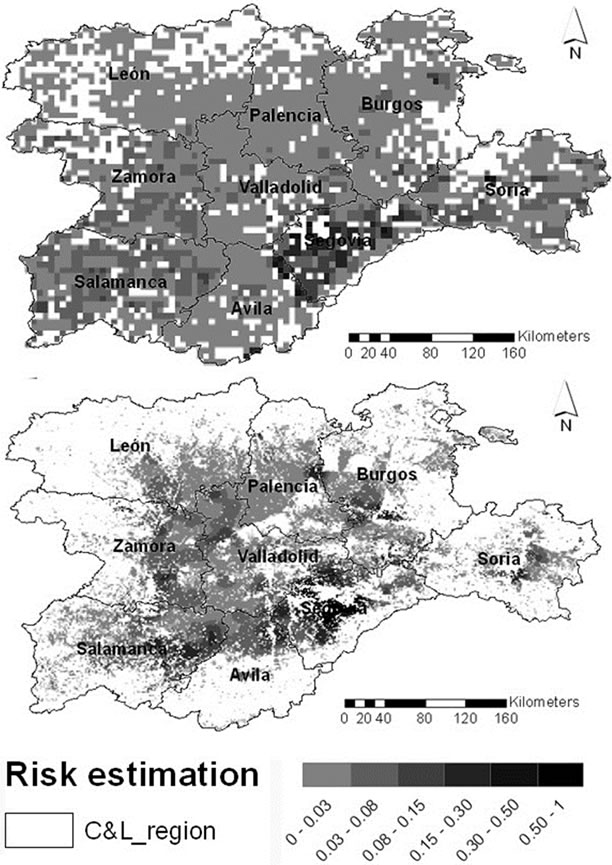
Figure 3. Soil vulnerability map of the authonomous region of Castile and León (Spain) generated at global scale (up) and at local level (down).
allocate limited resources among European or national environmental surveillance programs of antibiotics.
The second finding is that when the model is applied at a local level, results usually are more realistic and adjusted to the region of study, offering a useful tool for local management of the risk, such as the management of animal manures fertilization on soil to prevent the risk posed by antibiotics excreted on them. To achieve it, the local approach should be implemented with other parameters to evaluate the agricultural land suitability to receive organic fertilizers. In a recent study performed with sewage sludge [30], the authors identified groundwater contamination, distance to urban areas, metals concentration in soil and crop type as the most important criteria for defining the agricultural land suitability. Given that, we believe that the vulnerability map of soil to antibiotic contamination at local level can be easily implemented to be used to advice and guide policy makers toward more confident decisions, based on an extensive group of criteria.
In conclusion, the comparison between the vulnerability map for antibiotic contamination on soils generated at a global scale and a local level showed a reasonably good agreement between the results. The approach can be successfully used for evaluating the contamination potential of antibiotics over large areas and at national or subnational level using the same input data. This favors the tool application for the national decision making process and for the improvement of the surveillance programms of the European countries. At local scale, the inclusion of additional risk estimators for defining the agricultural land suitability, could orientate the local management of the risk, such as the management of antibiotic-enriched manures as soil fertilizers.
4. Acknowledgements
This work was financially supported by the projects RTA2010-00066-CO2-01 and S2009-AGR-1489. We gratefully acknowledge the assistance of the Regional Government of Castile and León (C&L) and the Animal Health Department and VISAVET center from the Veterinary School (Complutense University of Madrid) for providing pig data.
REFERENCES
- A. de la Torre, I. Iglesias, M. Carballo, P. Ramírez, M. J. Muñoz, “An Approach for Mapping the Vulnerability of European Union Soils to Antibiotic Contamination,” Science of the Total Environment, Vol. 414, 2012, pp. 672- 679. doi:10.1016/j.scitotenv.2011.10.032
- A. K. Sarmah, M. T. Meyer and A. B. A. Boxall, “A Global Perspective on the Use, Sales, Exposure Pathways, Occurrence, Fate and Effects of Veterinary Antibiotics (VAs) in the Environment,” Chemosphere, Vol. 65, No. 5, 2006, pp. 725-759. doi:10.1016/j.chemosphere.2006.03.026
- R. Wei, F. Ge, S. Huang and R. Wang, “Occurrence of Veterinary Antibiotics in Animal Wastewater around Farms in Jiangsu Province, China,” Chemosphere, Vol. 82, No. 10, 2011, pp. 1408-1414. doi:10.1016/j.chemosphere.2010.11.067
- A. B. A. Boxall, L. A. Fogg, P. Kay, P. A. Blackwel, E. J. Pemberton and A. Crosxford, “Priorisation of Veterinary Medicines in the UK Environment,” Toxicology Letters, Vol. 142, No. 3, 2003, pp. 207-218. doi:10.1016/S0378-4274(03)00067-5
- A. Capelton, C. Courage, P. Rumsby, P. Holmes, E. Stutt, A. B. Boxall and L. S. Levy, “Prioritising Veterinary Medicines According to Their Potential Indirect Human Exposure and Toxicity Profiles,” Toxicology Letters, Vol. 163, No. 3, 2006, pp. 213-223. doi:10.1016/j.toxlet.2005.10.023
- Y. Kima, J. Junga, M. Kimb, J. Parkc, A. B. A. Boxall and K. Choi, “Prioritizing Veterinary Pharmaceuticals for Aquatic Environment in Korea,” Environmental Toxicology and Pharmacology, Vol. 26, No. 2, 2008, pp. 167- 176. doi:10.1016/j.etap.2008.03.006
- N. H. Batjes and E. M. Bridges, “Soil Vulnerability to Pollution in Europe,” Soil Use and Management, Vol. 9, 1993, pp. 25-29. doi:10.1111/j.1475-2743.1993.tb00923.x
- N. H. Batjes, V. W. P. Van Engelen and L. R. Oldeman, “Proposed Assessment of the Vulnerability of European Soils to Pollution Using a Soter Shell Approach,” Land Degradation & Development, Vol. 4, No. 4, 1993, pp. 223-231. doi:10.1002/ldr.3400040405
- C. R. Meinardi, A. H. W. Beusen, M. J. S. Bollen, O. Klepper and W. J. Willems, “Vulnerability to Diffuse Pollution and Average Nitrate Contamination of European Soils and Groundwater,” Water Science and Technology, Vol. 31, No. 8, 1995, pp. 159-165. doi:10.1016/0273-1223(95)00368-W
- C. Giupponi and I. Vladimirova, “A GIS-Based Screening Model for Assessing Agricultural Pressures and Impacts on Water Quality on a European Scale,” Science of the Total Environment, Vol. 359, No. 1-3, 2006, pp. 57- 75. doi:10.1016/j.scitotenv.2005.07.013
- A. Pistocchi, P. Vizcaino and M. Hauck, “A GIS ModelBased Screening of Potential Contamination of Soil and Water by Pyrethroids in Europe,” Journal of Environmental Management, Vol. 90, No. 11, 2009, pp. 3410- 3421. doi:10.1016/j.jenvman.2009.05.020
- W. De Vries, P. F. A. M. Römkens and L. T. C. Bonten, “Spatially Explicit Integrated Risk Assessment of Present Soil Concentrations of Cadmium, Lead, Copper and Zinc in the Netherlands,” Water Air and Soil Pollution, Vol. 191, No. 1-4, 2008, pp. 199-215. doi:10.1007/s11270-008-9617-z
- J. Caudeville, R. Bonnard, C. Boudet, S. Denys, G. Govaert and A. Cicolella, “Development of a Spatial Stochastic Multimedia Exposure Model to Assess Population Exposure at a Regional Scale,” Science of the Total Environment, Vol. 15, No. 432, 2012, pp. 297-308. doi:10.1016/j.scitotenv.2012.06.001
- M. K. Schneider, C. Stamm and K. Fenner, “Selecting Scenarios to Assess Exposure of Surface Waters to Veterinary Medicines in Europe,” Environmental Science & Technology, Vol. 41, No. 13, 2007, pp. 4669-4676. doi:10.1021/es062486a
- B. Molinuevo, “Anaerobic Digestion of Livestock Wastes: Vegetable Residues as Co-Substrate and Digestate PostTreatment,” Ph.D. Dissertation, University of Valladolid, 2010.
- ISO 15175, “Soil Quality—Characterization of Soil Related to Groundwater Protection,” ISO Copyright Office, CH-1211, Geneva 20, 2nd Edition, 2004, p. 60.
- W. Wint and T. Robinson, “Gridded Livestock of the World. Rome, Italy: Food and Agricultural Organisation,” 2007. http://www.fao.org/AG/againfo/resources/en/glw/GLW_dens.html
- R. J. A. Jones, R. Hiederer, E. Rusco, P. J. Loveland and L. Montanarella, “The Map of Organic Carbon in Topsoils in Europe,” European Soil Bureau Research Report No. 17, Office for Official Publications of the European Communities, Luxembourg, 2004, 26 p.
- R. J. Hijmans, S. E. Cameron, J. L. Parra, P. G. Jones and A. Jarvis, “Very High Resolution Interpolated Climate Surfaces for Global Land Areas,” International Journal of Climatology, Vol. 25, No. 15, 2005, pp. 1965-1978. doi:10.1002/joc.1276
- European Environment Agency, “Dominant Landscape Types of Europe, Based on CORINE Land Cover 2000,” 2008. http://www.eea.europa.eu/data-and-maps/figures/dominant-landscapetypes-of-europe-based-on-corine-land-cover-2000-1
- ING, “Sistema de Información de Ocupación del Suelo en España. Estructura de la base de Datos SIOSE—MF2,” Versión 2.1, Equipo Técnico Nacional SIOSE, 2011. 31 p. http://www.ign.es/siose/Documentacion/Modelo_de_datos_SIOSE/Base_de_datos_SIOSE2005_MF2_%20v2.1.pdf
- SIOSE, “Documento Técnico SIOSE 2005,” Versión 2, D. G. Instituto Geográfico Nacional, Servicio de Ocupación del Suelo, S.G. de Cartografía. http://www.ign.es/siose/Documentacion/Guia_Tecnica_SIOSE/Doc_tecnico_SIOSE2005_v2.pdf
- N. Valcarcel, G. Villa, A. Arozarena, L. Garcia-Asensio, M. E. Caballlero, A. Porcuna, E. Domenech, J. J. Peces, “SIOSE, a Successful Test Bench towards Harmonization and Integration of Land Cover/Use Information as Environmental Reference Data,” The International Archives of the Photogrammetry, Remote Sensing and Spatial Information Sciences, Vol. 37, No. B8, 2008, pp. 1159-1164.
- M. Alario, “Paisajes de los Secanos Cerealistas de Castile and León,” Polígonos, Revista de Geografía, Vol. 21, 2011, pp. 19-49.
- J. Briz, “Evaluation of the Common Market Organization in the Cereal Sector. National Report-Spain,” 2005. http://ec.europa.eu/agriculture/eval/reports/cereals/spain.pdf
- MAGRAMA, “Actividades del Ministerio Durante 2011,” 2011. http://www.magrama.gob.es/es/ministerio/servicios/publicaciones/ii.i._ganader%C3%ADa_tcm7-213203.pdf
- A. L. Labajo, “Analysis of Temporal Behavior of Climate Variables Using Artificial Neural Networks: An Application to Mean Monthly Maximum Temperatures on the Spanish Central Plateau,” Atmósfera, Vol. 24, No. 3, 2011, pp. 267-285.
- J. L. Labajo, A. L. Labajo, M. Egido, Q. Martín, C. Morales and M. T. Ortega, “Analysis of the Maximum Daily Temperature Evolution on the Spanish Central Plateau,” Atmósfera, Vol. 25, No. 3, 2012, pp. 235-252.
- R. J. A. Jones, R. Hiederer, E. Rusco, P. J. Loveland and L. Montanarella, “Estimating Organic Carbon in the Soils of Europe for Policy Support,” European Journal of Soil Science, Vol. 56, No. 5, 2005, pp. 655-671. doi:10.1111/j.1365-2389.2005.00728.x
- A. Passuello, O. Cadiach, Y. Perez and M. Schuhmacher, “A Spatial Multicriteria Decision Making Tool to Define the Best Agricultural Areas for Sewage Sludge Amendment,” Environment International, Vol. 38, No. 1, 2012, pp. 1-9. doi:10.1016/j.envint.2011.07.013