Journal of Environmental Protection
Vol.3 No.11(2012), Article ID:25053,9 pages DOI:10.4236/jep.2012.311170
Mining and Seasonal Variation of the Metals Concentration in the Puyango River Basin—Ecuador
![]()
1Chemical Research Institute, San Andrés University, La Paz, Bolivia; 2Health Environment Development Foundation (FUNSAD), Quito, Ecuador; 3Rio de Janeiro University, Rio de Janeiro, Brasil.
Email: maugegarcia@hotmail.com
Received August 2nd, 2012; revised September 1st, 2012; accepted October 2nd, 2012
Keywords: Heavy Metals; Gold Mining; Puyango River Basin
ABSTRACT
The Puyango River Basin covers approximately an area of 4400 km2, it is located in Southern of Ecuador, with Calera and Amarillo rivers as tributaries. In this region, one of the main activities is small scale gold and silver mining. Currently there are 110 processing plants on the bank of Calera and Amarillo rivers, causing a significant degradation of natural resources. A seasonal comparison of metal concentrations in surface water, sediments and particulate matter from the Puyango River and its effluents is made. It was done a differentiation between natural contaminations with the anthropogenic one generated by mining activity. Samples were taken during dry season (2004) and rainy season (2006), and analyzed physicochemical parameters, anions and cations and the concentrations of heavy metals. The results show a clear influence of gold mining in Puyango River contamination, starting with its tributaries, Calera and Amarillo rivers, which have the highest concentrations of heavy metals from the basin, corresponding with the location of the mineral processing plants.
1. Introduction
The study area is located at East between 645513.93 and 9583432.64 and 9558839.96 West between 569100.97 at Southwest of Ecuador and covers a total area of approximately 4400 km2. This area is located in the Puyango River Basin with its many tributaries. There is an altitudinal gradient from 2000 to approximately 100 m.a.s.l.
The geographical area covered by the project area is located in the foothills of the Western Cordillera of the Andes to the west; this feature is perhaps one of the dominant facts of determining the sector.
The winds that bring moist air masses from the Pacific Ocean, the humid air masses that move from the Pacific penetrate the middle and upper basin of the river to the area Puyango imposing a maritime regime, determining two seasons: a rainy winter from January to April and a dry summer May to November or December, where the average annual rainfall is 1160 mm.
The main axis of the basin is the Pindo-Puyango River, wich from the mining area goes trough 120 km until the Peru border. The Puyango River basin covers different towns of Loja and El Oro provinces, where is developed activities as agriculture, livestock, mining and tourism. The most relevant for this study are Zaruma and Portovelo cities.
Mining is the most important activity in the highest zone of the Basin (Zaruma-Portovelo) and exists since pre-Columbian times. Ecuadorian historians speak that mines were known and exploited since Inca [1], this operation continued in the colonial period. Viceroy Francisco de Toledo chosen these sites in 1570 for mining exploitation in Ecuador. This activity was unsuccessful because the Spanish conquerors chose for mining Bolivia and Peru [2], with consequent environmental impacts inherited in the colonial period [3].
Mining was reactivated in 1896 trough the entrance of the South American Development Company (SADCO), a subsidiary of a US Vanderbilt Company [4], with which appears an industrial form of exploitation mining in Ecuador. The company left the country a few years after the end of II World War (1950). As a result of multiple economic, social and political aspects of Ecuador, in 1980’s in the southwest and southeast there were several forms of mining production, among which is the extraction of gold by amalgamation with mercury. At begin of 2000’s claims of mining companies were consolidating, process that leaves aside the social and environmental implications [5]. In the last decade reinforces the small-scale mining with concessions of 150 hectares and extractions of approximately 100 tons per day and investments to achieve a maximum of one million dollars [5].
Various forms of mining activities were consolidated in the highest part of the Puyango River Basin (Zaruma and Portovelo cities) with individual, family and mining companies forms of productive organizations. Mining in this area is characterized by metal type (gold) as tunnel mining, located in the Cordillera Vizacaya. There are also a hundred processing plants distributed in Calera and Yellow Rivers, tributaries of Puyango.
The labor process in mining has two great moments; one is made in the mines, which gives the raw ore and the other, in processing plants [6].
Processing plants are located on the bank of rivers Calera and Amarillo and various processes are performed for enriching raw ore to obtain gold or silver. It begins with size reduction of the raw ore using chilean mills, continues with gravimetric concentration until obtain a concentrate, it enters to the phase of amalgamation and burning with mercury emissions to air and water. A great part of the useful material goes to the phase of leaching with use of cyanide. It is used pools of leaching or agitation that after extract the metals for leaching; tailings are eliminated to the rivers. The final phases of dressing techniques include calcination, smelting and refining that, like other phases, it is used many chemicals substances (zinc, nitric acid) that contaminate the environment by different ways [7].
Mining in these processing plants pollutes rivers Calera and Amarillo by throwing cyanidation tailings, foam flotation, nitric acid residues and other residues. The most worrying because their impact on human health is the presence of heavy metals like mercury, lead, zinc, arsenic, cadmium and manganese, in addition to high concentrations of cyanide [8]. In addition is the soil erosion from the farming along the Puyango River Basin.
There have been few studies about the presence of metals resulting from mining in the Puyango River Basin [9-12], nevertheless, all talked about the influence of mining in the presence of metals in different parts of the rivers. These studies where focus on a circumscribed area of the basin, especially in the upper basin, the present study was conducted throughout the basin, including the origins of the rivers, the mining area, the middle Basin and the low Basin, near to the border with the neighboring country Peru. As well as a study in a neighboring country, Colombia [13], we also sampled the river in dry and rainy season.
It is well known that the geodynamics of the metals is complex, that is why several studies in America and around the world have considered important the determination of metals, especially mercury in particulate matter and/or sediments and material dissolved in water [14-18].
In addition, the present study has the particularity that includes the principal axes and tributaries of the Puyango River Basin. This allowed to distinguish the presence of heavy metals from mining of which comes from soil erosion of the riverbanks. The influence of seasons (dry and rainy), pH and conductivity were related with contamination. The metals selected for study are the most important to human health (lead, mercury, manganese and arsenic). We also studied the relationship between concentrations of cyanide in the river with the bacterial activity and potential methylation of mercury, about which there is another article [8].
This article focuses on the analysis of seasonal variation of physicochemical parameters and heavy metal concentrations in both seasons (dry and raining seasons); in surface waters, sediments and particulate matter, and identifying the influence of mining pollution of mercury, lead, manganese and arsenic.
The results have served to take measures to prevent health alterations, for example, discussing with communities that the river has high levels of metals in particulate matter. The result of these dialogues is the use of water filters to retain the particulate material. Subsequently and as a result of the strengthening of their organizations and networks of plants obtained drinking water. They are the uses of research results to improve the quality of people life.
2. Methodology
We designed an environmental sampling plan along the entire Puyango River Basin. Selection of sampling points was made based on criteria of representativeness, access to 20 sampling points, sites affected by mining and sites without much anthropogenic influence. Was considered also geological issues and geography of the Puyango River Basin including all tributaries of the main axis of the river. Sampling was conducted in the main transect and all tributaries over a length of approximately 160 kilometers. Table 1 shows the sampling points with their codes, name of the river and their geographical altitudes.
Water, sediments, particulate matter and soil were taken in each point and in two seasons (dry season, 2001 and rainy season, 2006). Physicochemical parameters, major cations and anions, metals and metalloids (Pb, Hg, Mn and As) were analyzed.
Triplicate samples were taken for subsequent statisticcal analysis. At pristine points, which corresponding to highest part of the river Basin (points 1 to 4), we verified the absence of mining activities and other anthropogenic activities, basic aspect for comparison the results with those found in the other sampling points. Other points were selected at convergence of tributaries with the main
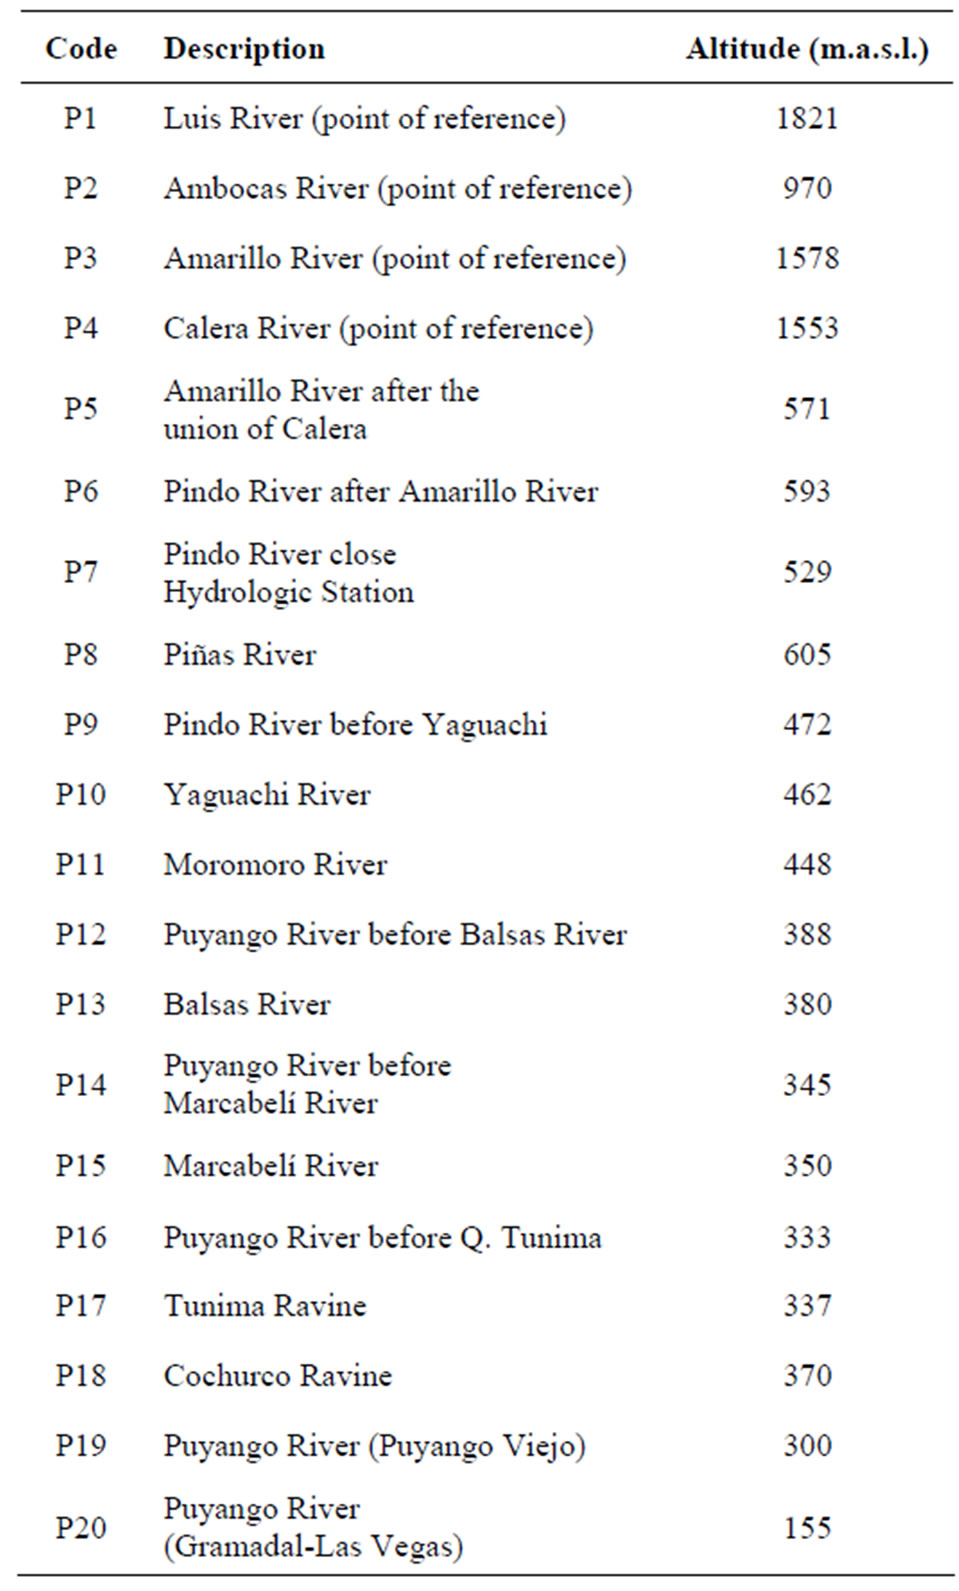
Table 1. Sampling points, Puyango River Basin.
axis of the river and after that union. As Figure 1 shows, the selected sampling points allow to have a better idea of the dynamics of contamination or dilution of each Puyango River Basin tributaries. The sampling points located immediately after the processing plants were taken as a special references for analysis. Overall, the sampling network consists of 20 points, including PindoPuyango River and tributaries of the middle and lower Basin.
Montgomery [19] protocols, enriched by Roulet [20] were followed for sampling, which in summary is: Sampling of surface water with a peristaltic manual pump, operated by battery, with hoses treated previously with nitric acid and rinsed with water “milliQ”. Water passed through a filter of 0.2 μm EPM2000, samples were standardized and collected in bottles of different materials (dark glass, polypropylene and teflon), depending of type of analysis. Bottles also were treated with nitric acid and with ultrapure water. Immediately after collecting, the samples were added ultra pure nitric acid and stored under refrigeration.
Polypropylene flasks of 1 liter were used for particulate material analysis, collecting water from the river directly, then, the material was captured in glass fiber filters, previously heated to 300˚C, cooled and heavy (0.7 μm, GFF Whatman, Brentford, London, United Kingdom). It was used also polycarbonate membrane of 0.45 μm. Sediments were collected in representative points, using Petri boxes of 10 cm diameter and then were passed through a nylon sieve of 250 μm. Both, the sediments and particulate matter were dried in an oven at 45˚C [21].
Conductivity, temperature and pH were measured in field with Oakton PC 300, after respective calibration; Eh was also measured in field with CONSORT equipment.
Lead, arsenic and manganese were analyzed by atomic absorption spectrophotometry with graphite furnace (GFAAS), AAnalyst 100. Mercury in water was analyzed by spectrophotometry and cold vapor atomic fluorescence (CVAFS) [22].
For analyzes of heavy metals in sediments and particulate material, samples were dried at 45˚C and digested with a mixture of hydrochloric acid and nitric acid and finally they were analyzed through GFAAS.
The detection levels for solid materials (sediment) were of 5.5 µg/kg for lead, 4 µg/kg for arsenic and 5 µg/kg for manganese. Were taken as a reference solution SPS-WW1, Batch 108.
3. Results
Seasonal variation was observed in both physicochemical parameters and heavy metal concentrations in surface water, sediments and particulate matter. There is a clear influence of mining activities in these concentrations; following paragraphs show the details
4. pH and Conductivity
Surface waters: values of pH are higher in dry season than in rainy season, due to a neutralization effect by the increase of precipitations, however, in some cases pH values are increased because the lime (CaO), used to precipitate metals and to avoid toxic effects of cyanide, used in gold leaching processes.
In Amarillo River, after the union with Calera River (point 5) and Cochurco Ravine (Point 8), pH is alkaline (8.92) due to higher concentrations of elements in dry season, the presence of carbonates and bicarbonates and probably because the presence of calcium oxide, both groups coming from tailings thrown into the rivers. It is important to remember that Point 5 is the area immediately located after the biggest zone of the processing plants. Puyango River receives the largest discharge of tailings and effluents from these plants.
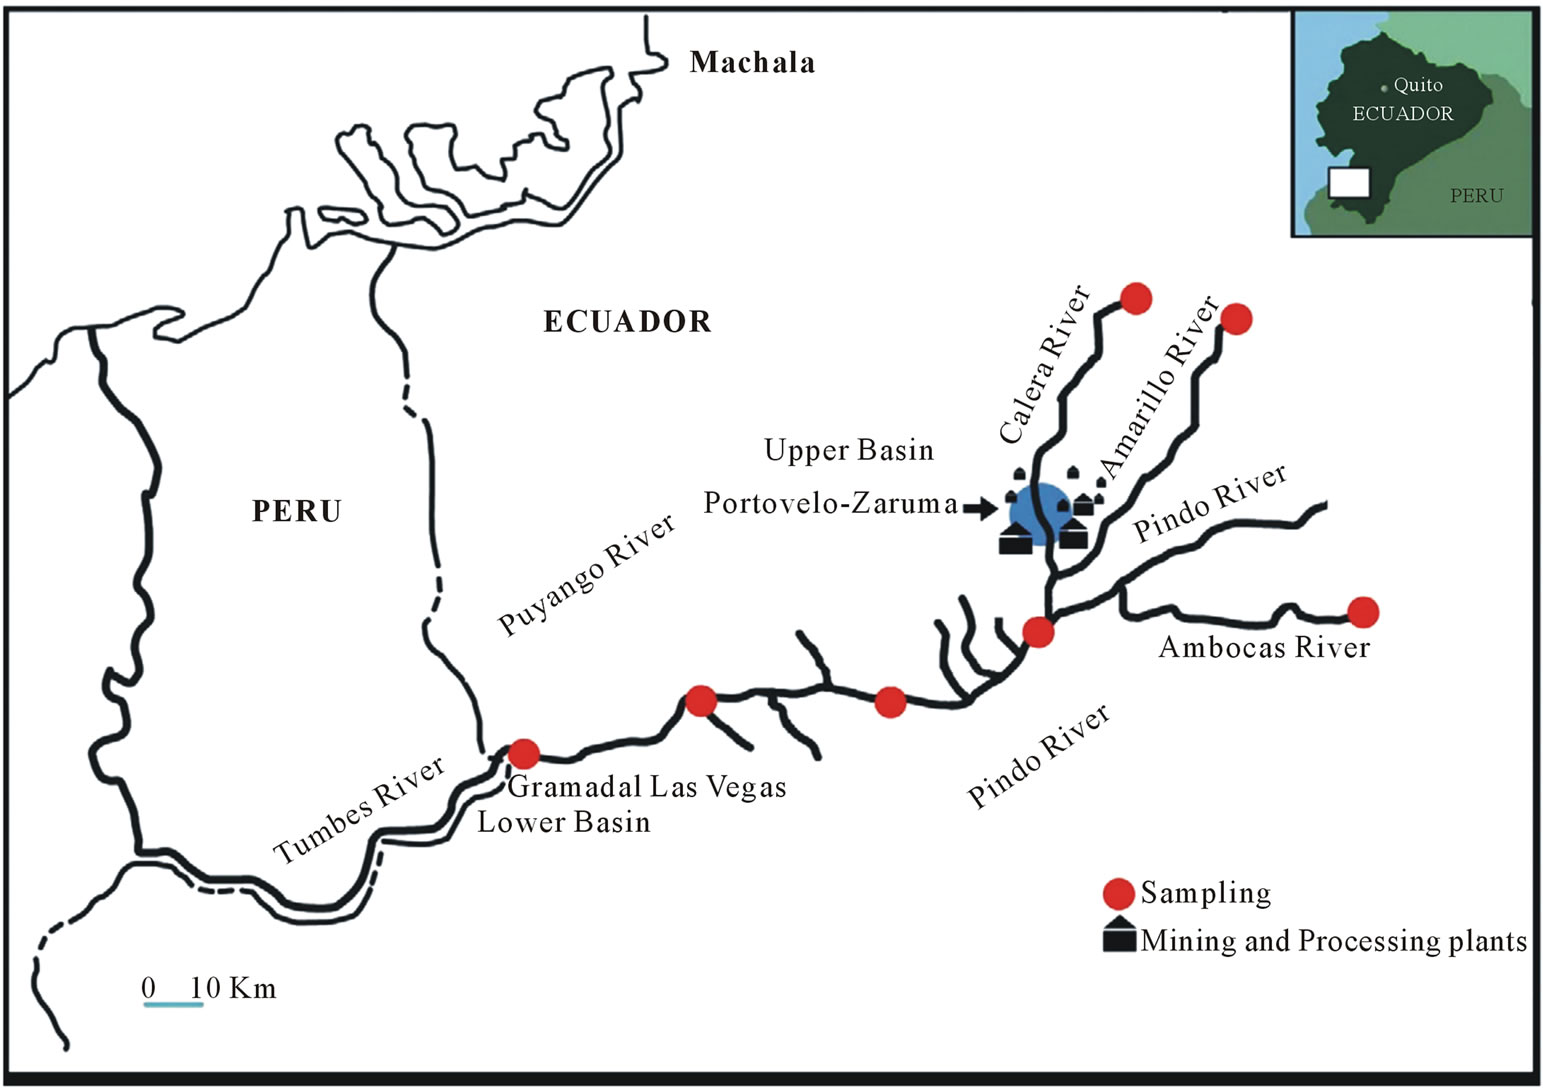
Figure 1. Sampling points of the Puyango River Basin.
Figure 2 shows seasonal variation of pH in both water and sediments. pH values ranging from slightly alkaline to slightly acid that in rainy season is clearly the tendency to neutrality because flux of rivers is increased.
Conductivity has low values at pristine points (areas not affected by the mining pollution), which means a minimum concentration of salts. In contrast, concentration of dissolved salts is notably higher in points with high mining influence, with conductivity that reaches 160 μS/cm. It decreases in most of the tributaries but increases again in the last points (lower Basin), place to which arrive dissolved elements from processing plants area and meddle part of the Basin. There are cations, anions and also heavy metals.
 5. Metalloids and Metals
5.1. Manganese
In pristine points (1 to 4), the concentration of manganese in water during rainy season (Med 1.0 µg/L) is higher than in dry season (Med 0.6 µg/L). It could be due to effect of dissolution of rocks with natural content of manganese, due to the action of rainfall. In the point 5, a mining area, Mn concentration in winter (63 μg/L) is lower than in summer (159 μg/L). Concentration of manganese are diluted because the increase of precipitation. From 7 to 20 points, in rainy season, increases the concentration of manganese in the main river and tributaries, which may be related to the increased flow that permit mobilization of manganese from the sediments. The most relevant aspect is that in the two stations, the highest levels of manganese found in the processing plant (point 5).
Manganese levels in sediments are higher in dry season, in pristine points, in the area of plants and distal points of the basin. In a similar way for water, manganese, levels reach higher concentrations in the area of the processing plants (1490 µg/g dry season and 809 μg/g rainy season).
The phenomenon is the same in particulate matter per unit of volume; manganese reaches high levels in the mining area (527 g/L in dry season and 197.5 mg/L in rainy season). It is clear that in the last two points, area inhabited by several families, in rainy season there are high levels of Mn (970 μg/L), exceeding even levels of mining area. The volume and force of the flux move the sediments that become part of suspended particulate matter (SPM), material that is abundant in point 20 (408 mg SPM/L, unlike to 140 mg SPM/L in mining area and 3 mg SPM/L as average at pristine points) (Figure 3).
5.2. Lead
Lead in water and in pristine points has low concentrations and they are even lower in rainy season (Med 0.11 µg/L) due to dilution. In contrast, lead concentrations in area of mines are high (30.9 µg/L in dry season and 23.9 µg/L in rainy season). There is a tendency to higher values of lead in lower basin and in the rainy season, probably related to the contribution of lead from sediments and
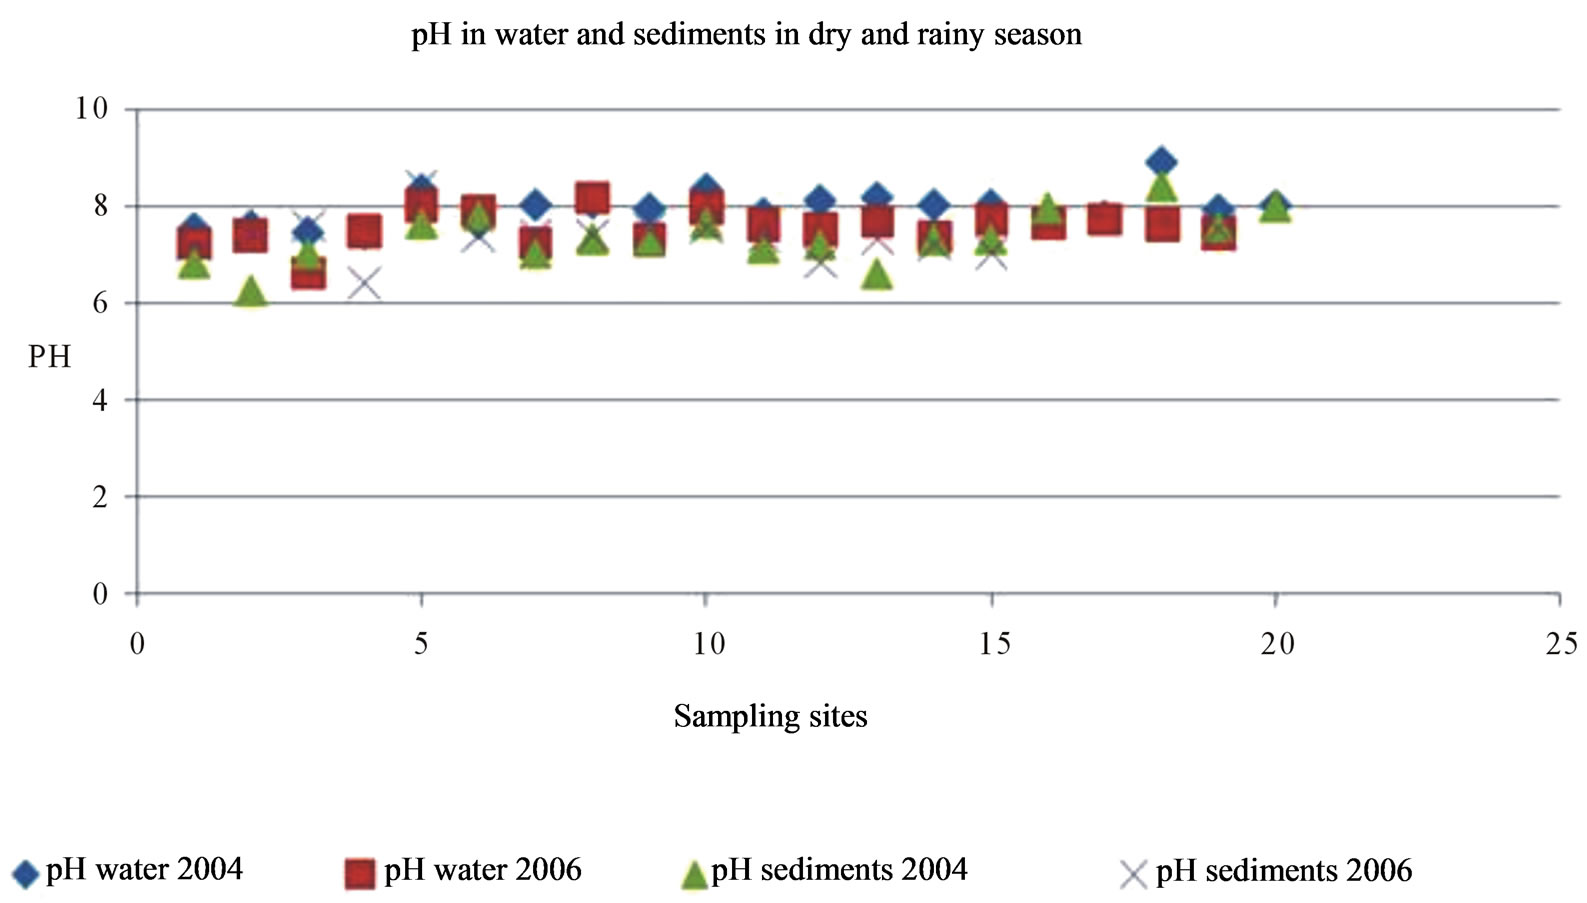
Figure 2. pH in water for seasons, Puyango River Basin.
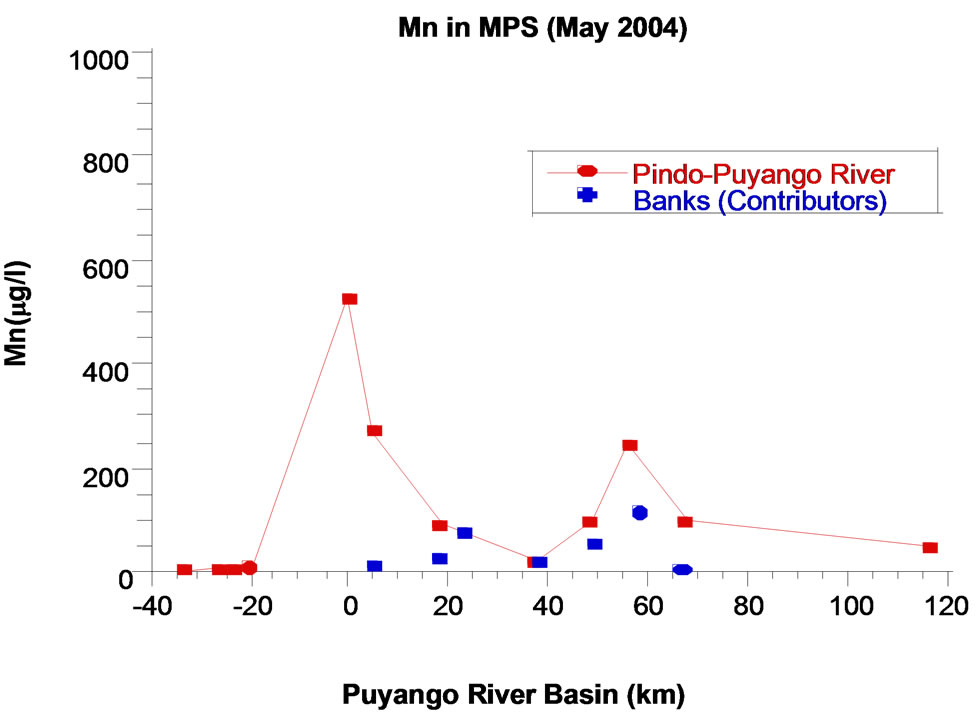
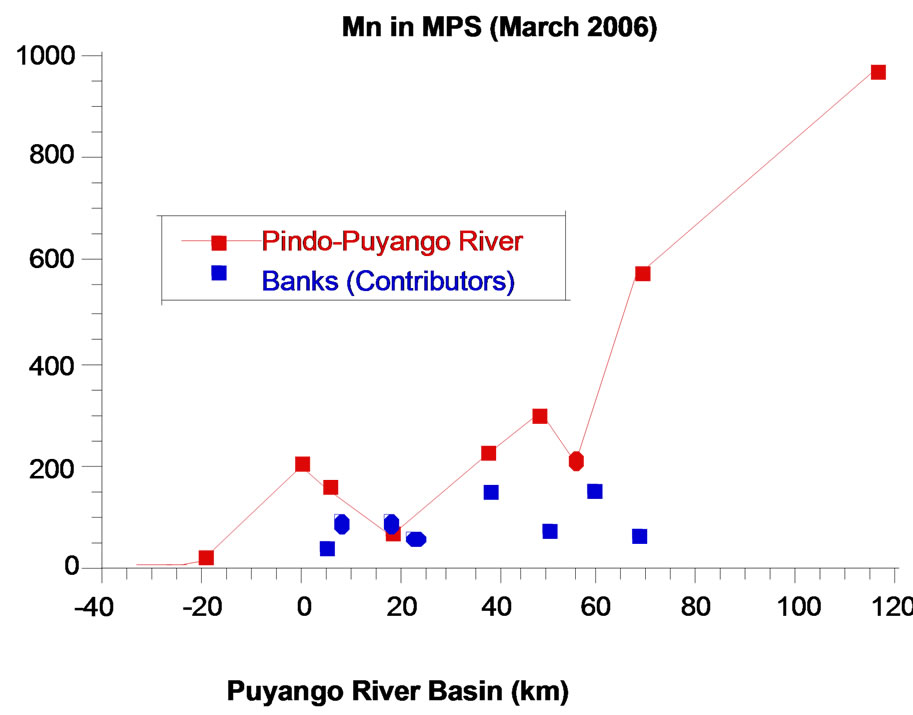
Figure 3. Manganese in particulate matter per unit of volume, Puyango River Basin.
erosion of the Puyango Basin, but these values do not exceed levels of mining area.
Values in sediments of pristine points are very low, with slight predominance in dry season (Med 47.5 µg/g). In contrast, the levels are very high in mining area, in both dry season (440 µg/g) and the rainy season (1090 μg/g), period when the concentrations decreased due to a dilution effect. Lead concentrations in sediments in Lower Basin are high in rainy season (265 µg/g), as well as the values of lead in water, reflecting the dissolution of minerals containing lead in this place.
Lead profile in particulate material is similar to the manganese. Values are very low in pristine points (Med 0.8 (µg/L in dry season and 0.54 µg/L in rainy season), instead, they increase considerably in mining area, mainly in dry season (648.7 µg/L). In the lower basin, during the rainy season, values increase over the values of the mining area. As we said before, the force of the water influences the presence of particulate matter and metals (Figure 4).
5.3. Mercury
Mercury in water and in mining area has high concentrations (7.01 ng/L in rainy season and 2.26 ng/L in dry season), related to Hg in pristine points (Med 1.46 ng/L in dry season). It is important to remember that gold is amalgamated with mercury in processing plants and waste is eliminated to water bodies. Seasonal variation of mercury is not very significant downstream and the values are lower than mining area.
Mercury in sediments and pristine points has relatively low concentrations (Med 55 ng/g in dry season and Med 50 ng/g in rainy season), in contrast, mercury concentrations in mining area are quite high in dry and rainy seasons (820 ng/g and 450 ng/g respectively). Concentrations decrease downstream, however, values are elevated in distal point and in rainy season (220 ng/g). It is the same as other metals (Figure 5).
The mercury profile in the particulate matter is similar to lead and manganese, with the respective elevations in mining area and highest concentrations at the last point in rainy season, generally with low values, below detection limits at various sampling points.
5.4. Arsenic
Arsenic concentrations in surface waters in pristine points are similar in both seasons and at very low levels, the highest value is in rainy season (0.63 µg/L). As increases significantly in mining area, more in dry season
(25 µg/l) than in rainy season (5.93 µg/L). Levels at lower basin are similar to mining area, in both dry and rainy seasons (9.0 and 8.41 µg/l respectively), above reference value to drinking water [23] (Figure 6).
As in sediments has high concentrations (161 µg/g) in point 1 (pristine point), source is natural for the presence of arsenopirites in this region, however, points 5, 6, 9 and 12 have the highest concentrations of the basin from mining and mineral dissolution of arsenic. They have high concentrations as 3260 µg/g.
As happen with other chemicals, arsenic concentrations in particulate matter and in mining area are the highest (138 µg/L in dry season). This element is high in rainy season (153 µg/L) because pH is alkaline and this increases the mobility of arsenic from natural sources but also receives arsenic concentrations from mining, deposited in sediments and after mobilized from them.
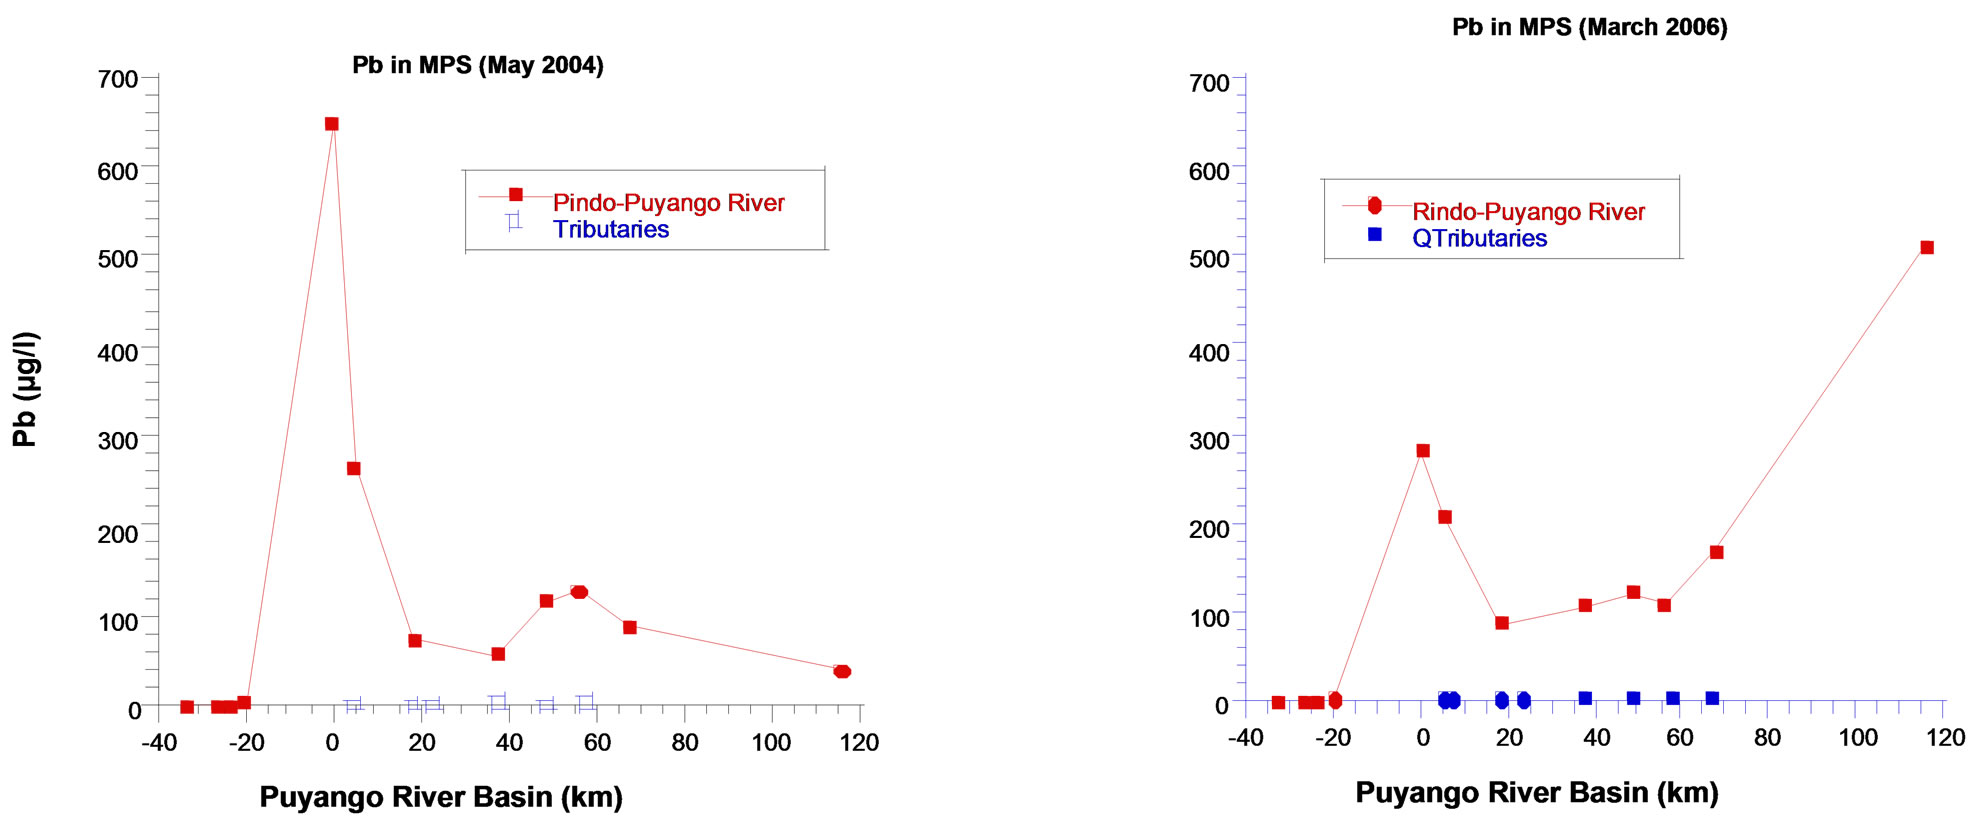
Figure 4. Lead in particulate matter per unit of volume, Puyango River Basin.
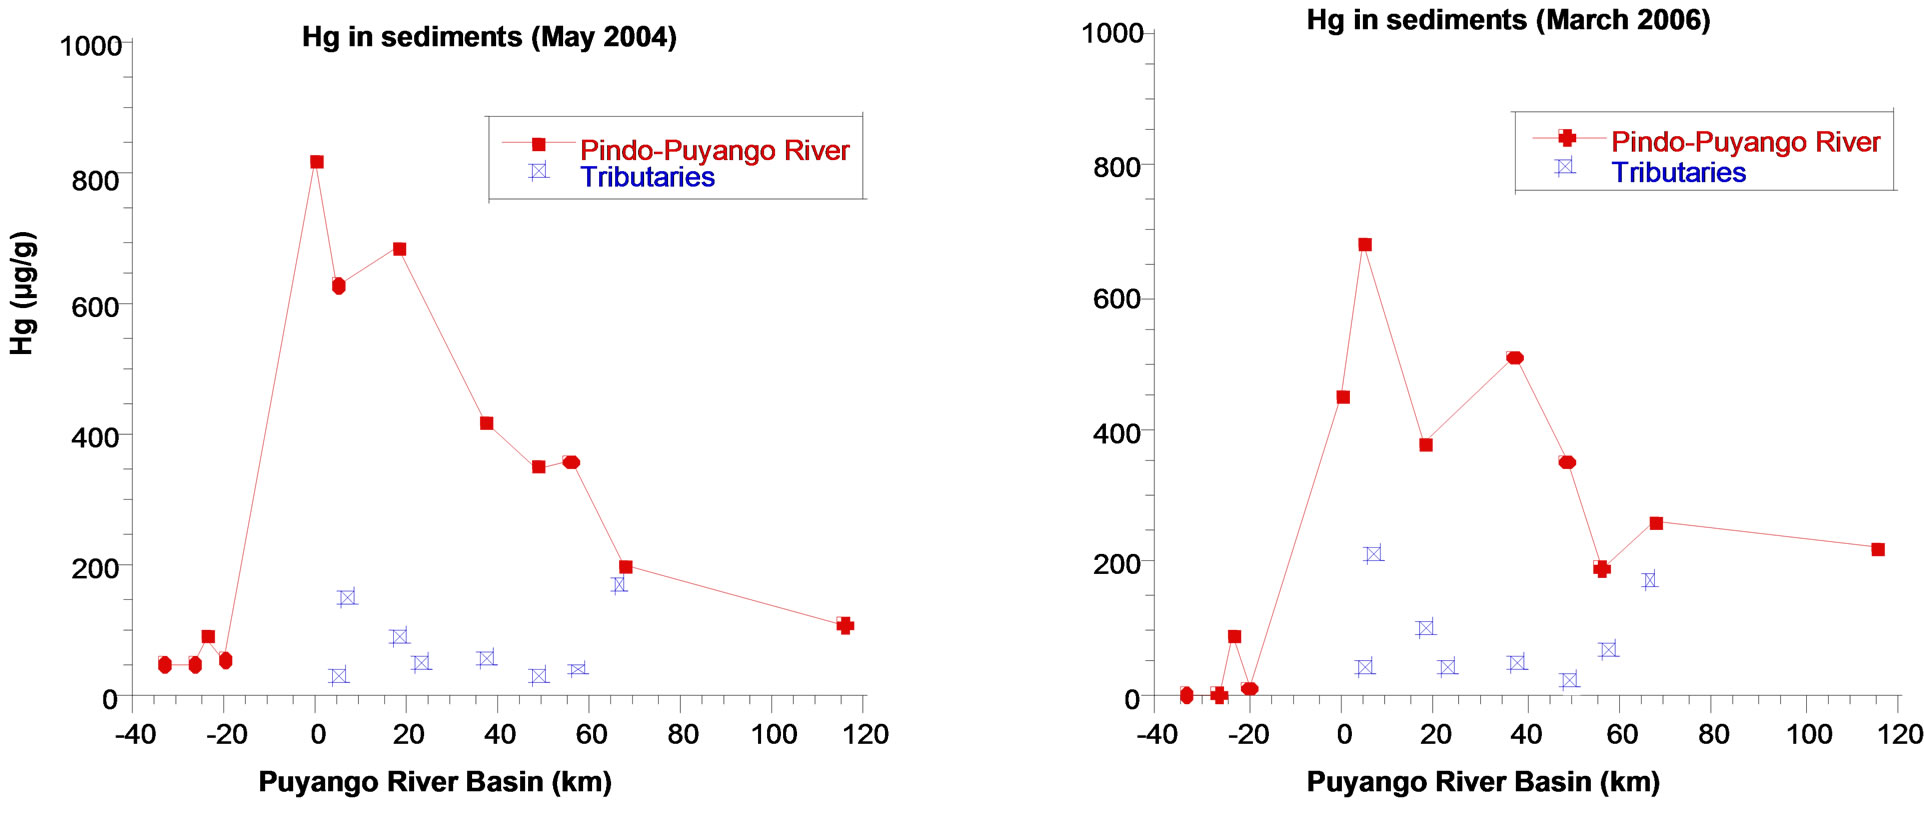
Figure 5. Hg in sediments in the Puyango River Basin (ng/g).
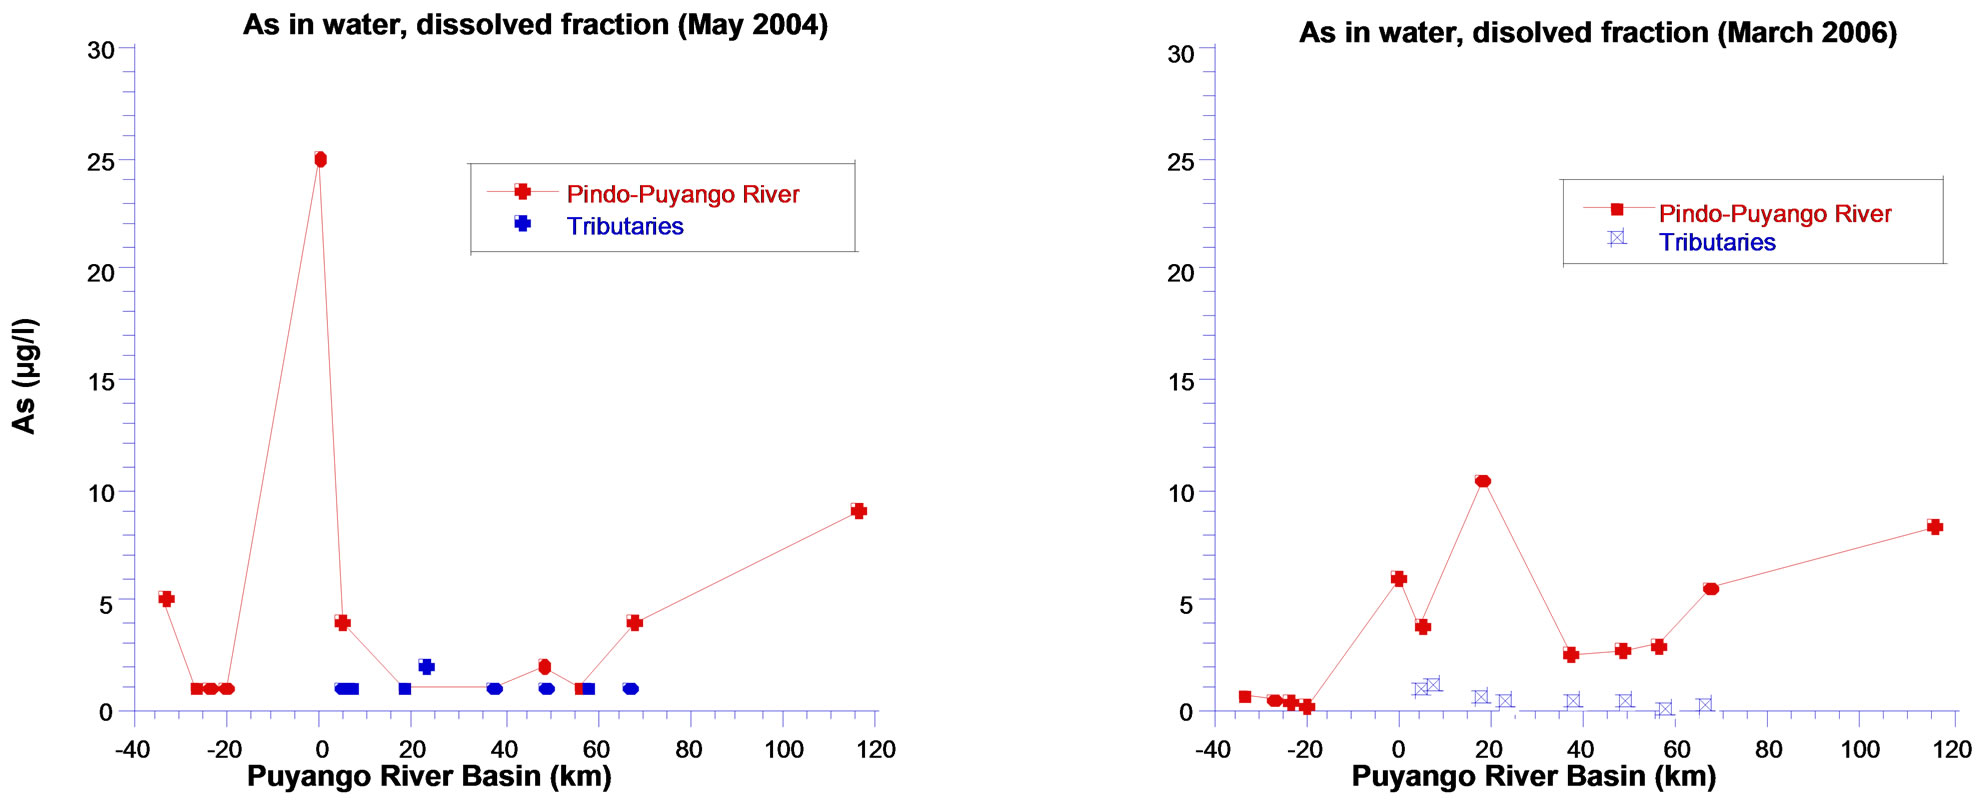
Figure 6. Arsenic in fraction dissolved in the water in Puyango River Basin.

6. Discussion
Puyango River Basin has a clear difference between pristine points and mining area. The first one presents natural levels o metals; instead, mining area has important anthropogenic pollution. Based on results and with reference to the Ecuadorian legislation contained in the Unified Text of Secondary Legislation of the Ministry of Environment, TULAS [24], Puyango River Basin has high values of lead, manganese and arsenic, which represent a risk to health of the population. This region is usually neutral to slightly alkaline pH with conductivity values showing a low concentration of salts in pristine points and some tributaries. The main problem of this region is an intense mining activity and use of contaminants such as mercury and direct discharge of tailings and effluents from processing plants into the rivers, that contribute to high level of these metals. The study shows high values of arsenic, mercury, manganese and lead in points corresponding to mining area. It was found manganese values of 159 µg/L in surface water, in this sector, being 100 µg/L maximum acceptable limit according TULAS. The same happen with lead values, 63 µg/L, being the limit of 50 µg/L. Conditions are better at some points however, most of these chemicals experienced elevation in all substrates at last point corresponding to Gramadal-Las Vegas. Manganese levels reached values of 970 µg/L in rainy season and in this part of the basin, exceeding about ten times the reference values TULAS for drinking water. It is remarkable because in that sector, people consumed water from the river without any treatment, nor filtration. High levels there are with lead (510 µg/L) and arsenic (153 µg/L), being accepted by TULAS limit of 50 µg/L. This contamination has implications for health, for example, in tests on children in this basin, we found that those with higher levels of manganese in their bodies (detected by hair analysis) are children from Gramadal-Las Vegas. In addition, close association was found between levels of manganese and low scores of intellectual abilities of these children (these results are subject of another article). Impact of manganese on human health, more than 115 miles from source of contamination is an example of how mining impacts far away from it, according to the habits, origin and use of resources that population consumes. Population up stream knows that river water is not good to drink. They have other alternatives.
It is also significant the variation in the concentrations of toxic elements between the rainy and dry season.
A particular phenomenon happens with mercury concentrations in water that do not exceed 7 ng/L in mining area and 4.25 ng/L in lower basin. In contrast, there is a large difference in the levels of mercury in sediments comparing values of pristine points and that of mining area. Concentrations are not more than 55 ng/g, instead, in mining area reach values of 820 ng/g and in the lower basin reaches 220 ng/g. These findings may suggest that mercury transforms into organic mercury (MeHg) and pass the food chain up to the human body, however, the study found almost absence of methylmercury in the main axis of Puyango River, phenomenon attributed to low bacterial activity in its ability to methylate mercury, which is associated clearly with the concentrations of cyanide, pollution from mining, details of this interesting phenomenon are found in an article [8].
“Mercury, manganese and lead, at toxic levels, inhibit the functioning of the nervous system. Neurobehavioural tests are used to assess motor, sensory, and cognitive functions. Poor performance on these tests has been linked to metal toxicity. We get some impacts of heavy metals in other component of our study. In 229 adult men working in, or living near, the mining areas, elevated blood mercury and lead seemed to be associated with poor performance on neurobehavioural tests. Increased concentrations of manganese in the hair of girls (2.9 - 7.4 mg/g) were associated with decreased scores on the cognitive Raven test (p = 0.009) and the digits test (p = 0.03). In children, increased concentrations of mercury in hair (0.1 - 4.3 mg/g) was associated with decreased performance on Santa Ana dexterity (p = 0.005), digits (p = 0.01), and finger tapping (p = 0.04) tests.
The values of mercury in the Puyango River Basin shown in some places higher values than studies in an urbanized Mediterranean area, which main source of contamination is the industrie, with concentrations of Hg and MeHg in sediments between 0.04 and 0.64 µg/g [25].
Comparing the values of mercury with other regions such as China, which also has mining regions that extract gold using mercury, river water showed concentrations of this element of 1.0 ng/l (Puyango basin also shows higher values surface water) and sediments from 100 to 300 ng/kg [26].
Some studies in the Amazon region showed that a major source of mercury pollution in the atmosphere is burning of the gold-mercury amalgam, which releases into the atmosphere from 30 to 170 tons of mercury per years. Atmosphere emissions account for 45% and 87% of the total mercury emitted by the amalgamation and burning of gold.
Other studies in the Brazilian Amazon show absence a clear profile of mercury emissions mercury from gold mining areas, whereas high concentrations were found in natural soil. Erosion and deforestation are the main source of mercury deposited in aquatic systems [27-29]. In contrast, this study shows mining impact throughout the entire basin and throughout the year.
A study in northeastern Argentina, site that has a history of having high concentrations of arsenic, determined that all sampling values exceeded the maximum allowed under the Law of Argentina (0.05 mg/L) [30]. This study showed that pollution comes from natural sources such as in pristine points the Puyango River Basin.
Lead was found at elevated levels in sites with direct influence of mining activities, accumulated in sediments and decreasing in lower basin. Values are not significantly different in the dry season and the rainy season, which indicates no significant dissolution of this element in the rainy season because pH does not allow the dissolution of lead salts. There is no sudden change of pH in the entire basin.
The results have helped to take some protective measures in lower river basin of Puyango, such as filtration systems and use of local sources to obtain dinking water. It was found high values of mercury (0.1 to 0.5 mg/L) in the Lake Vaner of Sweden, one of the reservoirs largest freshwater in this country and significantly affected by mercury pollution for more than fifty years. Mercury was removed almost entirely after applying remediation processes [31]. By contrast, in rivers like Puyango, with intense mining activity, reducing the metal contamination depends of profound changes in mining practice. In the upper basin, we can get some institutional policies to control the pollution from mining [32] (creation of operating units of study and control, municipal bylaws to prevent anarchy and polluting work of processing plants and greater control with the Ministry of Environment and not Renewable Natural Resources).
7. Acknowledgements
This study was financially supported by the International Development Research Center (IDRC-CRDI), Ottawa, Canada, www.idrc.ca.
REFERENCES
- M. Cortazar, “El Oro de Portovelo,” MC Editors, Soboc Grafic, Quito, 2005, p. 152.
- T. Bustamante and R. Lara, “El Dorado o la Caja de Pandora, Matices Para Pensar la Minería en Ecuador,” Flacso Sede Ecuador, Quito, 2010, p. 145.
- M. E. Garcia, et al., “History of Mining around the Poopo Lake and Environmental Consequences,” Vatten, Vol. 61, 2005, pp. 243-248.
- R. Paredes, “Oro y Sangre en Portovelo, el Imperialismo en el Ecuador,” Artes Gráficas, Quito, 1938, p. 228.
- A. Acosta, “La Maldición de la Abundancia,” CEP-Abya Yala, 1ra Edición, Quito, 2009, p. 239.
- O. Betancourt, “Para la Enseñanza e Investigación de la Salud y Seguridad en el Trabajo,” FUNSAD-OPS/OMS, Primera Edición, 1999, pp. 171-232.
- M. Priester and T. Hentschel, “Small-Scalle Gold-Mining Processing Techniques in Developing Countries,” GATEGTZ, Vieweg, 1992, pp. 15-81.
- J. R. D. Guimaraes, O. Betancourt, R. Barriga, E. Cueva and S. Betancourt, “Long-Range Effect of Cyanide on Mercury Methylation in a Gold Mining Area in Southern Ecuador,” Science of the Total Environment, Vol. 409, No. 23, 2011, pp. 5026-5033. doi:10.1016/j.scitotenv.2011.08.021
- F. Hruschka and C. Salinas, “Estudio Colectivo de Impacto Ambiental y Plan de Manejo Ambiental para las Plantas de Beneficio Mineral Aurífero ubicadas en la Vega del Río Calera/Salado,” CENDA-COSUDE, Projekt Consult, Mimeo, Zaruma, 1996.
- Prodeminca, “Evaluation of Impacts in the Mining District of Zaruma-Portovelo and the Puyango River Basin. Proyecto Desarrollo Minero y Control Ambiental, Prodeminca, Swedish Environmental Systems,” Ministerio de Energia y Minas del Ecuador, Quito, 1998, p. 212.
- N. H. Tarras-Wahlberg, A. Flachier, S. N. Lane and O. Sangfors, “Environmental Impacts and Metal Exposure of Aquatic Ecosystems in Rivers Contaminated by Small Scale Gold Mining: The Puyango River Basin, Southern Ecuador,” Sciences of the Total Environment, Vol. 278, No. 1-3, 2001, pp. 239-261. doi:10.1016/S0048-9697(01)00655-6
- P. C. Velasquez-Lopez, M. M. Veiga and K. Hall, “Mercury Balance in Amalgamation in Artisanal and SmallScale Gold Mining: Identifying Strategies for Reducing Environmental Pollution in Portovelo-Zaruma, Ecuador,” Journal of Clean Production, Vol. 18, No. 3, 2010, pp. 226-232. doi:10.1016/j.jclepro.2009.10.010
- J. Marrugo, L. Benitez and J. Olivero, “Distribution of Mercury in Several Environmental Compartments in an Aquatic Ecosystem Impacted by Gold Mining in Northern Colombia,” Arch Environ Contam Toxicol, Vol. 55, 2008, pp. 305-316. doi:10.1007/s00244-007-9129-7
- L. M. Bourgoin, et al., “Mercury Pollution Due to Gold Mining in the Bolivian Amazonian Basin. Mercury as a Global Pollulant,” 5th International Conference, Río de Janeiro, 1999, p .152.
- Bravo, et al., “Assessment of Mercury Levels in Soils, Waters, Bottom Sediments and Fishes of Acre State in Brazilian Amazon,” Water, Air, and Soil Pollution, Vol. 147, No. 1-4, 2003, pp. 61-77.
- R. Cesar, et al., “Mercury, Copper and Zinc Contamination in Soils and Fluvial Sediments from an Abandoned Gold Mining Area in Southern Minas Gerais State, Brazil,” Environmental Earth Science, Vol. 64, No. 1, 2011, pp. 211-222.
- J. R. D. Guimaraes, O. Malm and M. Meili, “Mercury in Soils, Sediments and Fish around the Poconé Gold Mining Area, Pantanal, Brazil: Some Movilisation but No Health Risks. Mercury as a Global Pollulant,” 5th International Conference, Río de Janeiro, 1999, p. 154.
- J. Howard, et al., “Total Mercury Loadings in Sediment from Gold Mining and Conservation Areas in Guyana,” Environ Monit Assess, Vol. 179, No. 1-4, 2011, pp. 555- 573. doi:10.1007/s10661-010-1762-3
- S. Montgomery, et al., “Total Dissolved Mercury in the Water Column of Several Natural and Artificial Systems of Northern Quebec Canada,” Canadian Journal of Fisheries and Aquatic Sciences, Vol. 52, No. 11, 1995, pp. 2483-2492.
- M. Roulet, et al., “Mercury and Other Trace Metals Dispersion from Gold Mines in the Puyango River, Ecuadorian Andes,” 6th International Conference on Mercury as a Global Pollulant, Japan, October 2001.
- O. Betancourt, N. Alberto and R. Marc, “Small-Scale Gold Mining in the Puyango River Basin, Southern Ecuador: A Study of Environmental Impacts and Human Exposures,” EcoHealth, Vol. 2, No. 4, 2005, pp. 323-332. doi:10.1007/s10393-005-8462-4
- O. Betancourt, et al., “Environmental and Health Impacts of Small Scale Gold Mining in Ecuador (Phase 2),” Informe Técnico, FUNSAD, 2007.
- ATSDR, “Tox Guide for Arsenic As,” CAS 7440-38-2, 2005. www.atsdr.cdc.gov.toxiguides/toxguide-2.pdf
- Gobierno del Ecuador, “Texto Unificado de Legislación Secundaria del Ministerio del Ambiente, Libro VI, Anexo 1, Norma de Calidad Ambiental y de Descarga de Efluentes: Recurso Agua,” Registr Oficial, Edición Especial 2, 2003.
- C. Abi-Ghanem, “Mercury Distribution and Methylmercury Mobility in the Sediments of Three Sites on the Lebanese Coast, Eastern Mediterranean,” Achieves of Environmental Contamination Toxicology, Vol. 60, 2010, pp. 394-405.
- Y. H. Lin, M. X. Guo and W. M. Gan, “Mercury Pollution from Small Gold Mines in China,” Water, Air, and Soil Pollution, Vol. 97, No. 3-4, 1995, pp. 233-239.
- M. Roulet, M. Lucotte, R. Canuel, N. Farella, M. Courcelles, J. R. D. Guimarães, D. Mergler and M. Amorim, “Increase in Mercury Contamination Recorded in Lacustrine Sediments Following Deforestation in Central Amazonia,” Chemical Geology, Vol. 165, No. 3-4, 2000, pp. 243-266. doi:10.1016/S0009-2541(99)00172-2
- M. Roulet, M. Lucotte, N. Farella, G. Serique, H. Coelho, C. J. Passos, E. D. De Jesus Da Silva, P. S. de Andrade, D. Mergler, J. R. D. Guimaraes and M. Amorim, “Effects of Recent Human Colonization on the Presence of Mercury in Amazonian Ecosystems,” Water, Air and Soil Pollution, Vol. 112, No. 3-4, 1999, pp. 297-313. doi:10.1023/A:1005073432015
- M. Roulet, M. Lucotte, A. Saint-Aubin, S. Tran, I. Rhéault, N. Farella, E. D. De Jesus Da Silva, J. Dezencourt, C. J. Sousa Passos, G. Santos Soares, J. R. D. Guimarães, D. Mergler and M. Amorim, “The Geochemistry of Hg in Central Amazonian Soils Developed on the Alter-DoChão Formation of the Lower Tapajós River Valley, Pará State, Brazil,” The Science of the Total Environment, Vol. 223, No. 1, 1998, pp. 1-24. doi:10.1016/S0048-9697(98)00265-4
- P. Motta, “Hierro y Manganeso en Aguas Superficiales y Subterráneas,” Argentina, 2005.
- A. Danielsson, “A Large Scale Mercury Variation in Lake Vaner, Sweden, 2001.
- O. Betancourt, et al., “Impacts on Environmental Health of Small-Scale Gold Mining in Ecuador,” In: D. F. Charron, Ed., Ecohealth Research in Practice: Innovative Applications of an Ecosystem Approach to Health, Springer, New York, 2012.