Journal of Environmental Protection
Vol. 3 No. 8 (2012) , Article ID: 21759 , 9 pages DOI:10.4236/jep.2012.38092
Impact of Simulated Airborne Soot on Maize Growth and Development
![]()
University of Pannonia, Veszprem, Hungary.
Email: *anda-a@georgikon.hu, Illes.bernadett86@gmail.com
Received May 5th, 2012; revised June 7th, 2012; accepted July 9th, 2012
Keywords: Black Carbon; Maize; Evapotranspiration; Albedo; Dry Matter Yield
ABSTRACT
Various effects of the dry deposition of soot on maize were investigated in Keszthely (Hungary) in two consecutive years. In order to be able to study a wider range of weather conditions, some of the plants were placed in a Thornthwaite-Matter type evapotranspirometer and given ad libitum water supplies. Pollution with airborne black carbon was simulated throughout the season by distributing rates of 3 g·m–2 a week using a motorised dust sprayer. Among the plant growth parameters, the leaf area index was increased by 3% - 14%, depending on the year, suggesting that the plants were able to absorb the carbon settling on the leaves. The black carbon reduced the albedo of the canopy by 17.5% - 21.8%, depending on the year, forcing the polluted maize to absorb more energy. Part of this surplus energy was utilised for increased evapotranspiration (3.9% and 11% in the two years) and to raise the surface temperature of the canopy by 1˚C - 2˚C during the mid-day hours. The effect of the contamination on maize was more intense in the hot, dry year. The unfavourable effect of soot on maize fertilisation could be observed as a significant increase in the number of deformed ears, leading to a reduction in grain dry matter. The reduction in dry matter yield for polluted maize grown with irrigation in the evapotranspirometer was far less severe than that on non-irrigated plots, suggesting that irrigation was the most obvious solution for mitigating the negative effects of contamination with airborne soot.
1. Introduction
Black carbon (BC) is one of the end products of incomplete combustion, but due to the multiplicity of techniques used to determine its composition, various definitions are to be found in the literature [1]. It is generally agreed that in addition to char, charcoal and ash, soot is a regular component of BC [2]. Soot, a combustion-generated carbonaceous compound, is absorbed by and stored in the soil, influencing its properties, fertility and water retention [3-6]. The effect of BC on the environment, based chiefly on analyses of the consequences of forest burning [7,8], appears to be ambiguous. Although some of the BC arising from burning remains in the soil, enriching its carbon content, the process of forest burning may also have negative effects. As the carbon stored in the soil, which is usually of biomass origin, increases the microbial activity of the soil, it reduces the humus content [9]. A further disadvantage of soot in the soil could be its high adsorption capacity, which may bind heavy metals and pesticides [2,10]. If these enter the food chain, they have a negative effect on all the links in the chainand especially on humans, at the end of the chain.
BC has a significant effect on the global carbon cycle [11], acting as a carbon sink from the more rapid bioatmosphere carbon cycle to the slower (long-term) geological carbon cycle [12].
Whether arising from burning or from road traffic, soot first comes into contact with plants from the air. Nevertheless, there are few data in the literature on the effect of solid contaminants falling on plants in the form of dry deposition [13]. It is unlikely that the effect of soot absorbed from the soil is the same as that of the black carbon settling on the canopy. The aim of the research was thus to determine the effect of atmospheric soot on the albedo (reflection of irradiation), evapotranspiration and some growth parameters of maize. Frequent low rates of soot were applied to simulate the effect of airborne soot deposition from exhaust fumes under field conditions. It was hoped to discover what effect soot of atmospheric origin, the high carbon content of which could act as a nutrient for plants, had on the yield and on certain parameters of maize. The mechanism by which soot can be readily taken up from the soil due to its strong binding to minerals was described by [14]. By contrast, the possible binding of atmospheric soot and the mechanism by which this could take place has not yet been discussed in the literature.
2. Materials and Methods
A field experiment was set up at the Agro-meteorological Research Station in Keszthely, Hungary (46˚45'N, 17˚14'E, 102 m above sea level) to investigate the effect of soot (BC) on the evapotranspiration and various parameters of maize in two consecutive growing seasons (2010 and 2011). A Swiss-bred maize hybrid, Sperlona (FAO 340), which has a short growing season, was sown at a plant density of 70,000 plants per hectare, a density widely applied under Hungarian climatic conditions for growing grain maize.
Nutrients (180, 80 and 120 kg·ha–1 N, P and K, respectively) were applied in the end of March, immediately prior to sowing. The maize was sown in the field (evapotranspirometers included) on 23 and 22 April in 2010 and 2011, respectively. Emergence occurred in the field plots on the same date as that of the maize planted on the ET tanks (on 1 May and 2 May in 2010 and 2011, respectively). The usual agronomic procedures (plant protection, weed control) recommended for the location by the staff of the University of Agricultural Sciences, Keszthely, were applied. The harvest dates of the two consecutive years were 23 September and 17 September.
Of the two water supply treatments, the rainfed variant was sown in field plots (C), while compensation evapotranspirometers (ET) of the Thornthwaite-Matter type were used for the ad libitum or irrigation treatment. Evapotranspirometers were used for two reasons: on the one hand, to provide an irrigated treatment, and on the other, to extend the observation period. By providing ad libitum water supplies, it was possible to simulate a wet year in which the water supplies were quite different than in the “dry” treatment, thus making it possible to study the effect of two different types of weather conditions in a single year.
The ET chambers or tanks were metal containers with a volume of 4 m3 (2 × 2 m in area, 1 m in depth), filled with a monolith from the surrounding field, layered as in the natural state. The field of ET experiment covered an area of 0.7 ha. Due to the fixed nature of evapotranspirometers, the experiment was laid out in a block design with four replications, while the dry plots were arranged in a randomised complete block design with four replications. The plots had the same area (4 m2) as the evapotranspirometers. Among the terms in the net balance, the latent heat was calculated on the basis of the energy required to evaporate 1 mm water (2.45 MJ/m2) [15]. The energy reaching the soil was calculated with the [16] formula on the basis of global radiation penetration using extinction coefficients recorded locally [17]. The source of sensible heat was the residual energy (net balance— soil heat flux—latent heat). The energy bound by photosynthesis was ignored due to the negligible amount involved.
Extra field plots measuring 0.3 ha were used for albedo measurements. Pyranometers of the CMA-11 type (Kipp & Zonen, Vaisala) were installed in the centre of these plots on columns of adjustable height. The sensors were raised each week as the plants grew, so that they were always at least 1.5 m above the canopy. Data were collected using a Logbox SD datalogger (Kipp & Zonen, Vaisala) in the form of 20-minute means of samples taken every 6 seconds. Traditional meteorological data, including global radiation, were obtained from the local QLC-50 meteorological station.
The pollutant applied in the experiment was the form of BC used by the Hankook Tyre Company (Hungary) to improve the wear resistance of tyres. This chemically pure BC contained fully graphitised soot particles free of other pollutants (heavy metals, etc.). Although such pure BC does not exist in nature, its use was important for the reproducibility of the experiment. It is clear that if pure soot proves to have any damaging effect, this will be compounded in reality due to the strong binding affinity of associated contaminants to soot. The characteristic size distribution of the soot was 10% of the total quantity below 3.13 μm, 50% below 18.8 μm and 90% below 50.6 μm. To simulate atmospheric dry deposition, relatively small doses were applied (3 g·m–2), repeated at weekly intervals. This rate was chosen to simulate moderate pollution and was determined after a consideration of the wide range of values given in the literature [18,19]. A motorised sprayer (SP 415) widely used in agricultural practice was used for the dry dispersal of this small dose.
The leaf area index was measured each week on the same 12 sample plants in each treatment using an LI 3000A automatic planimeter (LI-COR, Lincoln, NE, USA). Phenological phases were also recorded.
After canopy closure the canopy surface temperature was sensed remotely between noon and 2 pm on cloudless days using an infrared thermometer (RAYNGER II model, Raytek, Santa Cruz, CA, USA) with an optic angle of 8˚ and a spectral range of 8 - 12 µm. The instrument was hand-held at about 1 m above the crop at an angle of 30˚ below the horizontal. Each value recorded was the average of 20 - 30 temperature readings, measured every 2 s, and this was repeated three to five times. The emissivity was set to 0.98.
At the end of the season, the dry matter (DM) content of the plants (shoot and grain separately) was determined after drying to constant weight at 60˚C.
The experimental settings, design and abbreviation of the treatments were placed in Table 1.
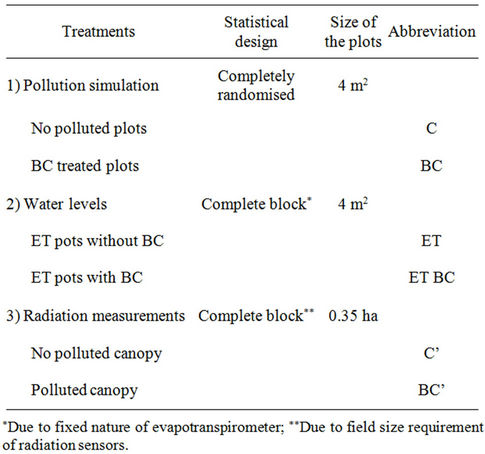
Table 1. Summary of the experimental procedures and abbreviation.
The treatments were replicated four times. The impact of the treatments was analysed with one-way ANOVA, using the Duncan’s or Games-Howell simultaneous average comparison tests as a supplement. The basis of the assumption was whether Levene’s test on the studied variable gave a difference for the variance. Univariate analysis of variance was applied to detect between treatments effects (irrigation, pollution). In time series analysis (LAI and daily evapotranspiration) paired t-test was applied. Data analysis was performed using the SPSS program package (SPSS Statistics 17.0; IBM Corporation, New York, US).
3. Results and Discussion
3.1. Weather Conditions with Plant Growth and Development
The weather conditions in the two vegetation seasons differed considerably, both from each other and from the long-term mean. While 2010 had average temperatures but rainfall supplies 51% higher than the long-term mean, the growing season in 2011 was 1.2˚C warmer than average, with less than half the normal rainfall quantity (–56%). At the given location, this year was drier than any recorded during the period 1901-2000 (Figure 1). In both years the differences from the long-term mean were least pronounced in July, which coincides with the most sensitive developmental phase of maize (tasselling), so this may have been favourable for plant growth. The month of August, however, was characterised by a record monthly rainfall sum of 180 mm in 2010, while in 2011 it marked the start of an extremely dry period that was 2˚C - 3˚C warmer than average.
The length of the growing season was the same in both years in the irrigated treatment (ET), while on the rainfed plots the season was 1 - 1.5 weeks shorter in 2011. In this year canopy closure occurred 10 days earlier in the dry treatments and although this difference decreased by a few days during ripening, the plants on the dry plot were around a week ahead of the others throughout the vegetation cycle. The drying down of the leaves was also faster in 2011.
Soot contamination had no effect on the length or start date of the phenophases regardless of the year. Although the drying down of the leaves of soot-treated plants took about a week longer in 2010, this took place after full
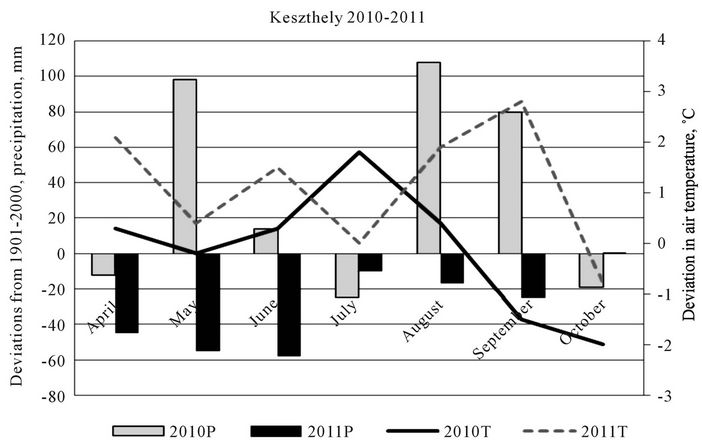
Figure 1. Differences from climate norms (1901-2000) for monthly mean temperature (T) and precipitation sums (P) in the two years of the study.
maturity, so it did not influence the length of the vegetation cycle. This slower drying down was not observed in the hot dry year of 2011.
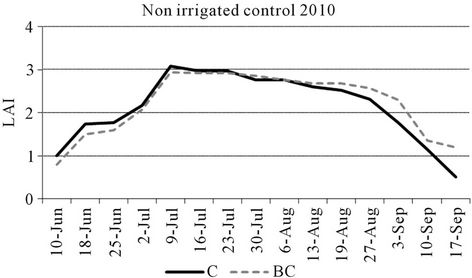
Although there was no significant difference between the years in terms of mean leaf area (Figure 2), in 2011 the greater leaf area in the vegetative phase of plant development and the more intensive drying down caused by drought from the end of July led to lower values of LAI than in the same periods of the previous year. In terms of yearly means, the values were 3.5% - 6.8% lower in 2011 than in 2010, except in the case of irrigated, soot-contaminated plants, where an increase of 4% was observed in 2011 (though these differences were not significant).
Surprisingly, soot was found to increase the LAI of maize irrespective of the weather, to an extent depending on the year. In the wet year of 2010 the leaf area of polluted plants rose by 4% in the irrigated and 3.2% in the non-irrigated treatment (differences not significant). In the dry hot year, soot had a greater effect, with a significant increase in leaf area of 14.8% (p < 0.001) in the rainfed plot and 11.4% (p < 0.001) in the ET treatment.
3.2. Changes in Irradiation and Water Regime Parameters
The shape of the evapotranspiration curves gave a good reflection of the weather in the given year (Figure 3). While in 2010, with rare exceptions, the daily evapotranspiration sums only exceeded 4 mm in July, in 2011 this level was reached in late June and was maintained, except for a few short periods of cooler weather, until the end of August, thus considerably increasing. The warmer weather in 2011 increased the amount of water lost by non-polluted maize by 34.5% (p < 0.001). A substantial year effect was also observed for the soot-treated plants; in the hot dry year of 2011 the polluted maize utilised 23.8% (p < 0.001) more water than in the previous year.
In both years soot caused a significant rise in evapotranspiration, but the extent of this increase differed considerably. In 2010, which was cooler, with good rainfall supplies, the water utilisation of the soot-treated stand was only 3.9% higher, while in the dry year of 2011 this figure was almost three times higher (11%). The date on which the plants had the greatest water consumption was not influenced by the soot treatment (23 July in 2010 and 9 July in 2011). The pollution resulted in a moderate (0.2 mm/day) increase in the daily evapotranspiration maximum in 2010, while this value was much greater in 2011 (1.2 mm/day). Observations indicated that the warmer the weather, the greater the effect of soot on evapotranspiration.
There was no significant difference in the annual mean evapotranspiration per unit leaf area in either year (data
 (a)
(a)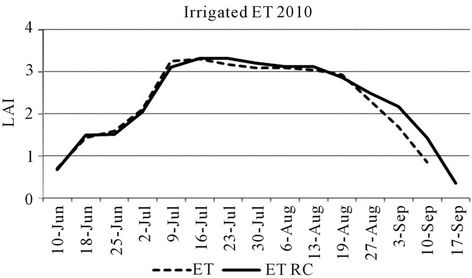 (b)
(b)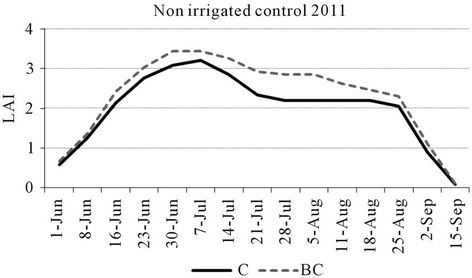 (c)
(c)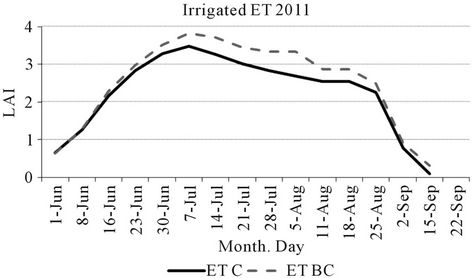 (d)
(d)
Figure 2. (a)-(d) Changes in the rainfed (C) and irrigated (ET) maize leaf areas based on weekly LAI values. (a) and (b) represent data for 2010, while (c) and (d) data for 2011. Abbreviation BC means soot polluted treatments.
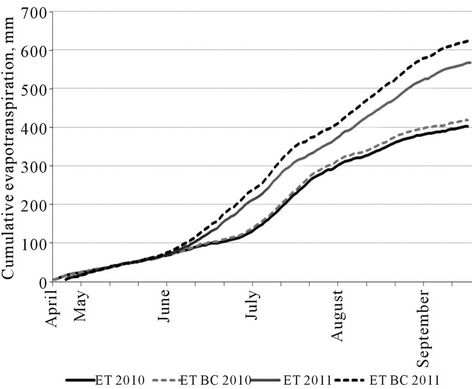
Figure 3. Cumulative values of daily evapotranspiration in the two years of the study. Dotted lines represent polluted treatments. The lower pair of curves is those for the wet year and the upper pair those for the dry year, when water consumption was greater. ET: Evapotranspirometer (without pollution); BC: Black carbon use.
not shown). Although the evapotranspiration of contaminated plants was around 7% more intense than that of the control plants in the first third of the vegetation period in 2010, this difference decreased and became non-significant for the vegetation period as a whole. In 2011 a 1% - 2% increase in the water loss per unit leaf area of soottreated plants was only observed in July, and then not on every occasion, so this had an insignificant effect on the annual mean.
Part of the radiation reaching the canopy is reflected, some passes through the canopy to the ground, while the remainder enriches the energy reserves of the plants. The energy bound by the canopy acts as a source for various energy-requiring processes, such as evapotranspiration, photosynthesis and warming processes. The greatest proportion of the energy absorbed by the plant stand is latent heat, which may represent as much as two-thirds of the total energy if sufficient moisture is available. Of the three energy-using processes, the smallest quantity of energy, only a few percent of the total energy, is utilised for photosynthesis, i.e. yield formation, even in the case of a C4 crop like maize.
Measuring the albedo is the simplest way of quantifying the reflection of irradiation from various surfaces, and the higher the value of this parameter, the greater the loss of global irradiation from the stand due to reflection. Of all the parameters studied, the albedo gave the most stable values in terms of both the year and the effect of pollution. The annual means were 17.37% in 2010 and 16.91% in 2011 on the control plot, and 14.58% in 2010 and 13.59% in 2011 for soot-polluted maize (Figure 4). The wet weather in 2010 caused slower drying down,
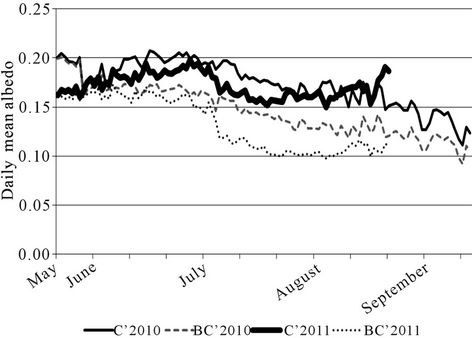
Figure 4. Changes in albedo over the year, based on daily means. Daily means were determined from 20-minute means/hourly means of samples taken every 6 seconds. C’: Control plot; BC’: Polluted treatment. Continuous and broken lines represent the not polluted and soot polluted crop canopy, respectively.
thus lengthening the data series, while in 2011 the dry vegetation season resulted in earlier ripening, so albedo measurements were discontinued sooner. Regardless of the year, soot pollution caused a considerable reduction in the mean value of the albedo over the vegetation season, amounting to 17.5% in 2010 (p < 0.001) and 21.8% in 2011 (p < 0.001). It can thus be seen that the difference caused by soot pollution was somewhat greater in the hot dry year than in the wet year. The effect of contamination was more moderate in the early part of the vegetation period, increasing later as a consequence of the repeated treatments. In the case of hot dry weather the curves describing the polluted and control treatments exhibited somewhat greater differences. Regardless of the treatment, a certain amount of weather dependence was observed in the daily changes, making the shape of the curves more uniform on cloudy, wet days. Over the long term, the deposited soot made the colour of the canopy darker, thus reducing the albedo and forcing the plants to absorb more energy. Some of the surplus energy was used to satisfy the energy requirements of greater evapotranspiration.
The direction of changes in energy distribution in response to BC did not differ greatly in the two years, but the deviations were greater in 2011, so these values were used to illustrate the results. In 2011 the annual mean of the net balance was 4.6% higher in the soot-polluted treatment. Due to the greater leaf area, 8.2% less energy reached the soil of the polluted stand, while the amount of energy bound by the canopy increased to a slightly greater extent (10.7%) (Figure 5). The greater evapotranspiration of the contaminated maize raised the value of latent heat compared to that of the control stand, with an associated reduction in the sensible heat in the polluted
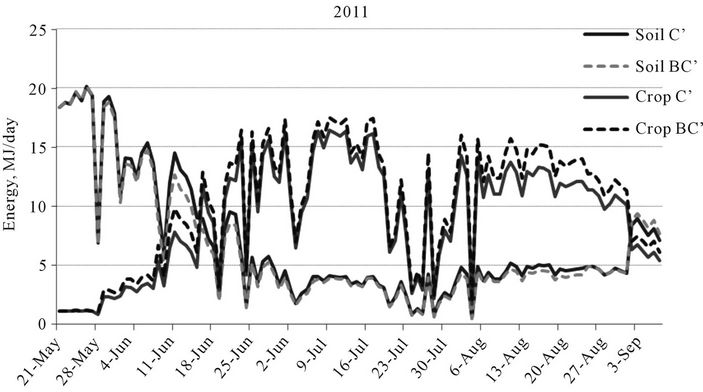
Figure 5. Effect of soot on the amount of energy reaching the soil (lower two lines) and remaining in the canopy (upper two lines) in 2011, based on radiation parameters recorded on 0.3 ha plots. C’: Not pollution canopy; BC’: Soot contaminated canopy.
treatment (Figure 6). The sensible to latent heat ratio was 45:55 for the soot-treated plants, compared with 39:61 in the control. Some of the surplus energy remaining in the stand was used to meet the energy requirements of the increased evapotranspiration of polluted plants. This surplus was hardly 4% in the wet year of 2010, while in 2011 the rise in the annual evapotranspiration sum of polluted maize was almost three times as great (11%), with an associated increase in the energy requirement. The remainder of the surplus energy absorbed by polluted maize raised the canopy temperature by 0.6˚C - 2.4˚C when the sun was high in the sky on clear days, and this value was relatively independent of the year. A greater level of evapotranspiration was probably required in 2011 to maintain the canopy temperature at the same level as in the cooler, wetter year despite the soot pollution.
3.3. Yield of Maize
In 2010 the supplementary water supplies in the ET tanks only had a significant effect on the shoot dry matter, which was 16.7% (p < 0.001) greater than in the rainfed plots, due to the more intensive vegetative development of the plants. It is interesting to note that in 2010 the grain dry matter was not significantly increased by supplementary water supplies; in fact the grain dry matter in the rainfed plot tended to be slightly higher than that in the ET tanks. This confirmed a phenomenon observed in previous years, that in wet years the plentiful rainfall combined with the continuous water supplies in the ET tanks resulted in the soil becoming saturated, leading to a lack of aeration, which has a negative effect on the yield.
The ability of soot contamination to reduce dry matter production was observed for all dry matter parameters
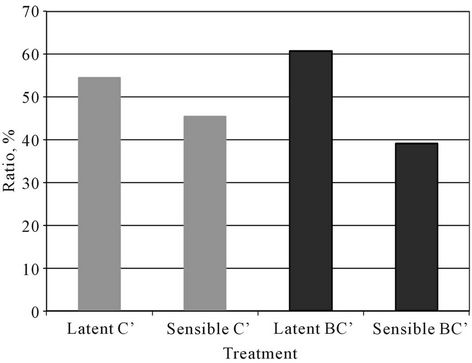
Figure 6. Values of sensible and latent heat, the two most important consumers of canopy energy, in the two treatments (C’: Control canopy; BC’: Soot-polluted canopy) during 2011.
examined (Table 2), but this effect was only significant for the rainfed plot (p < 0.026). The beneficial effect of supplementary water supplies on the grain yield of polluted maize could be detected even in the wet year of 2010, as the reduction in grain dry matter was 12.4% (p < 0.037) on the rainfed plot, but only 2.2% (non-significant) in the ET treatment.
Despite the greater leaf area, the TDM of polluted plants was 8% - 9% lower in both water supply treatments in 2010, though this difference was not significant.
When the two treatment effects (irrigation and pollution) were analysed together, a significant difference was only found for irrigation in 2010 (Table 3).
As in the previous year, only the reduction in the grain yield of the contaminated plot was significant in 2011
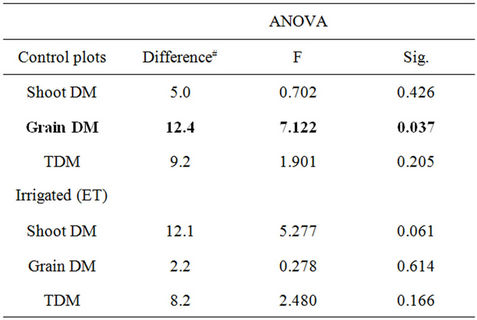
Table 2. Effect of soot on the dry matter content of the shoot, yield DM and whole plant (TDM) in 2010 (#Difference between the control and soot-polluted treatments, expressed as a percentage).
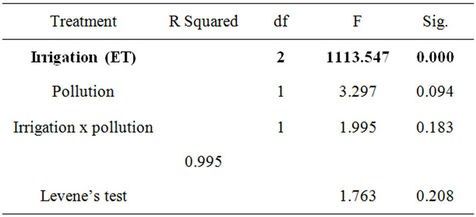
Table 3. Test of between-water treatments effects for yield DM in 2010.
(Table 4). This yield loss was around 5% greater than in 2010. Although soot pollution also tended to reduce the shoot DM and TDM, the differences were not significant. The ability of irrigation to counterbalance the effect of pollution on the grain yield was again observed in 2011, with a non-significant 3% loss in yield DM in soot-polluted maize. Although the shoot dry matter contents of soot-treated plants were slightly higher than in the control plants in both the rainfed and ET treatments (figures with minus signs in the table), suggesting that higher LAI values were associated with greater vegetative production, this difference was not statistically significant.
As in the previous year, the effects of pollution and irrigation on the yield were only significant in the case of irrigation in 2011 (Table 5).
The negative effect of soot was manifested in a reduction in grain yield in the non-irrigated treatment, regardless of the year. The carbon content of the soot also had a positive effect, increasing the leaf area in both years and the shoot DM in 2011. It should be noted, however, that these differences were not always significant.
The reduction in yield was caused by an increase in the number of deformed ears, the proportion of which was 10.7% in 2010 and 20.7% in 2011 on the contaminated plot, compared to a very low percentage in the
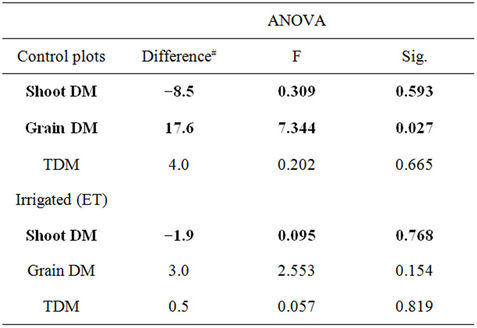
Table 4. Effect of soot on the dry matter content of the shoot, yield and whole plant (TDM) in 2011 (#Difference between the control and soot-polluted treatments, expressed as a percentage. Figures in bold italics with minus signs indicate an increase in the polluted treatment compared with the control).
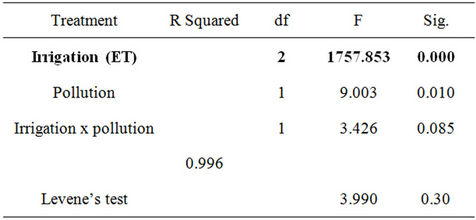
Table 5. Test of between-water treatments effects for grain DM in 2011.
control maize. Deformed ears were also produced in the polluted ET treatment in both years, but the proportion was much lower (3.8% and 7%). Deformed ears were only found very rarely in the control ET tanks, and only in 2011.
4. Conclusions
Soot pollution had practically no effect on the plant development rate, though in the wet year the drying down of the leaves was somewhat protracted. However, this took place after full maturity, so it had no real effect on the length of the maize vegetation period.
The polluted plants had higher annual mean values of LAI, depending on the year. In the wet year of 2010 the increase in the LAI of the soot-treated canopy was nonsignificant in both water supply treatments, while the changes were more intense in the hot dry year of 2011, when BC caused a significant increase of over 10% in the leaf area at both water supply levels. This greater transpiration surface may have been one reason for the higher values of evapotranspiration recorded for polluted plants in 2011. The more pronounced consequences of soot in the dry year (LAI, evapotranspiration, albedo) may have been linked with the cleansing effect of rain in the wet year. In dry years more BC remains on the plant surface, some of which may be absorbed by the plant in the same way as foliar fertilisers and used as a carbon source to increase the leaf area. This indicates that carbon may act as a nutrient for plants not only through the soil [4], but also through the leaves, from atmospheric deposition.
In both years soot pollution caused a significant reduction in the albedo. Once the canopy closed, apart from the slight daily changes caused by the weather conditions, the soot pollution caused an ever increasing reduction in the albedo. This lower albedo value forced the polluted maize to absorb more energy. The presence of BC resulted in a difference of over 20% in the dry hot year (2011), while this difference was almost 5% lower in the wet year.
The negative effect of soot could be detected as a grain yield reduction, which reached a significant level in the rainfed plot. The cause of this reduction was found to be an increase in the number of deformed ears due to poorer fertilisation. Irrespective of the year, the supplementary water supplies in the ET treatment were able to compensate for the yield losses caused by pollution. On areas exposed to soot pollution (areas near the highways), a reduction in grain dry matter is to be expected, together with an increase in the water requirements, particularly in dry years. The measurements indicated that BC does not reduce the dry matter content of the vegetative organs; in fact, that of the leaf area may even increase slightly. In dry years the yield losses can be reduced by irrigation, while in wet years this is compensated for by the cleansing effect of rainfall.
5. Acknowledgements
The financial and infrastructural support of the State of Hungary and the European Union in the frame of the TÁMOP-4.2.1/B-09/1/KONV-2010-0003 and TÁMOP- 4.2.2/B-10/1-2010-0025 projects are gratefully acknowledged.
REFERENCES
- T. P. Jones, W. G. Chaloner and T. A. J. Kuhlbusch, “Proposed Bio-Geological and Chemical Based Terminology for Fire-altered Plant Matter,” In: J. S. Clark, H. Cachier, J. G. Goldammer and B. J. Stocks, Eds., Sediment Records of Biomass Burning and Global Change, Vol. 1, Springer-Verlag, Berlin, 1997, pp. 9-22. doi:10.1007/978-3-642-59171-6_2
- E. D. Goldberg, “Black Carbon in the Environment,” Wiley Publication, New York, 1985.
- C. M. R. Alexis, A. Chabbi, V. Chaplot, D. P. Rasse and C. Valentin, “Black Carbon Contribution to Soil Organic Matter Composition in Tropical Sloping Land under Slash and Burn Agriculture,” Geoderma, Vol. 130, No. 1-2, 2006, pp. 35-46. doi:10.1016/j.geoderma.2005.01.007
- B. Glaser, “Prehistorically Modified Soils of Central Amazonia: A Model for Sustainable Agriculture in the Twenty-First Century,” Philosophical Transactions of the Royal Society of London—Series B: Biological Sciences, Vol. 362, No. 1478, 2007, pp. 187-196. doi:10.1098/rstb.2006.1978
- J. M. Novak, W. J. Busscher, D. L. Laird, M. Ahmedna, D. W. Watts and M. A. S. Niandou, “Impact of Biochar Amendment on Fertility of a Southeastern Coastal Plain Soil,” Soil Science, Vol. 174, No. 2, 2009, pp. 105-112. doi:10.1097/SS.0b013e3181981d9a
- C. Knoblauch, A. A. Maarifat, E. M. Pfeiffer and S. M. Haefele, “Degradability of Black Carbon and Its Impact on Trace Gas Fluxes and Carbon Turnover in Paddy Soils,” Soil Biology and Biochemistry, Vol. 43, No. 9, 2011, pp. 1768-1778. doi:10.1016/j.soilbio.2010.07.012
- S. Brodowski, W. Amelung, L. Haumaier and W. Zech, “Black Carbon Contribution to Stable Humus in German Arable Soils,” Geoderma, Vol. 139, No. 1-2, 2007, pp. 220-228. doi:10.1016/j.geoderma.2007.02.004
- J. Lehmann and S. Sohi, “Comment on ‘Fire-Derived Charcoal Causes Loss of Forest Humus’,” Science, Vol. 321, No. 5894, 2008, pp. 1295-1298.
- D. A. Wardle, M. C. Nilsson and O. Zackrisson, “Fire-Derived Charcoal Causes Loss of Forest Humus,” Science, Vol. 320, No. 5876, 2008, p. 629. doi:10.1126/science.1154960
- G. Cornelissen, O. Gustafsson, T. D. Bucheli, M. T. O. Jonker, A. A. Koelmans and P. C. M. V. Noort, “Extensive Sorption of Organic Compounds to Black Carbon, Coal, and Kerogen in Sediments and Soils: Mechanisms and Consequences for Distribution, Bioaccumulation, and Biodegradation,” Environmental Science & Technology, Vol. 39, No. 18, 2005, pp. 6881-6895. doi:10.1021/es050191b
- T. A. J. Kuhlbusch and P. J. Crutzen, “Black Carbon, the Global Carbon Cycle, and Atmospheric Carbon Dioxide, Chapter 16,” In: J. S. Levine, Ed., Biomass Burning and Global Change, Vol. 1, 1996, The MIT Press, Cambridge, pp. 160-169.
- M. S. Forbes, R. J. Raison and J. O. Skjemstad, “Formation, Transformation and Transport of Black Carbon (Charcoal) in Terrestrial and Aquatic Ecosystems,” Science of the Total Environment, Vol. 370, No. 1, 2006, pp. 190-206. doi:10.1016/j.scitotenv.2006.06.007
- D. M. Olszyk, A. Bytnerowitcz and B. K. Takemoto, “Photochemical Oxidant Pollution and Vegetation: Effects of Mixtures of Gases, Fog and Particles,” Environmental Pollution, Vol. 61, No. 1, 2003, pp. 11-29. doi:10.1016/0269-7491(89)90259-5
- S. Brodowski, B. John, H. Flessa and W. Amelung, “Aggregate-Occluded Black Carbon in Soils,” European Journal of Soil Science, Vol. 57, No. 4, 2006, pp. 539-546. doi:10.1111/j.1365-2389.2006.00807.x
- H. G. Jones, “Plants and Microclimate,” Cambridge University Press, Cambridge, 1983.
- M. Monsi and T. Saeki, “Uber den Lichtfaktor in den Pflanzengesellschaften und Seine Bedeutung für die Stoffproduktion,” Japanese Journal of Botany, Vol. 14, 1953, pp. 22-52.
- A. Anda and Z. Loke, “Radiation Balance Components of Maize Hybrids Grown at Various Plant Densities,” Journal of Agronomy & Crop Science, Vol. 191, No. 3, 2005. pp. 202-209. doi:10.1111/j.1439-037X.2005.00124.x
- P. H. Freer-Smith, K. P. Beckett and G. Taylor, “Deposition Velocities to Sorbus aria, Acer campestre, Populus deltoids X tricocarpa Beaupré, Pinus nigra and X Cupressocyparis leylands for Coarse, Fine and Ultra-Fine Particles in the Urban Environment,” Environmental Pollution, Vol. 133, No. 1, 2005, pp. 157-167. doi:10.1016/j.envpol.2004.03.031
- B. A. K. Prusty, P. C. Mishra and P. A. Azeez, “Dust Accumulation and Leaf Pigment Content in Vegetation near the National Highway at Sambalpur, Orissa, India,” Ecotoxicology and Environmental Safety, Vol. 60, No. 2, 2005, pp. 228-235. doi:10.1016/j.ecoenv.2003.12.013
NOTES
*Corresponding author.