Journal of Environmental Protection
Vol. 3 No. 1 (2012) , Article ID: 16874 , 14 pages DOI:10.4236/jep.2012.31011
Degradation of Phenolic Compounds in Creosote Treated Wood Waste by a Mixed Microbial Culture Augmented with Cellulolytic-Thermophilic Actinomaycets Thermobifida fusca
![]()
Department of Process Engineering and Applied Science, Dalhousie University, Halifax, Canada.
Email: abdel.ghaly@dal.ca
Received October 18th, 2011; revised November 12th, 2011; accepted November 15th, 2011
Keywords: Composting; Bioremediation; Mesophilic; Thermophilic; Phenolic Compounds; Wood Waste
ABSTRACT
Creosote is used for preservation of railway ties and timbers, electric utility poles, marine and foundation piling, fences and garden furniture. Creosote-treated wood waste may cause potential contamination of soil and water if they are not disposed properly. Creosote contains over 300 organic compounds including polycyclic aromatic hydrocarbons, phenolic compounds and heterocyclic organic compounds, many of which are toxic to human and can cause damage to kidney, liver, eyes and skin. The feasibility of using a composting technique inoculated with the cellulose degrading actinomycetes Thermobifida fusca as a mesophilic/thermophilic bioremediation option to degrade phenolic compounds in creosote treated wood waste was evaluated. The temperature profile of bioremediation process clearly identified mesophilic and thermophilic phases in both experiments. Different degradation rates were observed in the mesophilic and thermophilic phases. Fluctuations of pH was observed in both experiment as the result of the breakdown of organic nitrogen to ammonium in the first week and the formation of organic acids and the loss of ammonium with the exhaust gases in the latter stage. The moisture content decreased in both trials because of the net loss of water with the exhaust gas. Both experiments achieved similar reductions in total carbon and TKN, volatile solids and phenolic compounds, cellulose and lignin indicating similar levels of microbial activities during the composting process. The stability and maturity of the final products were also similar. The inoculation of the cellu-lolytic-thermophilicactinomycetes Thermobifida fusca did not manifest observable differences in degrading cellulose, lignin and phenolic compounds compared with the control.
1. Introduction
Creosote has been the compound of choice for use as a wood preservative and waterproofing agent for railway ties, cross ties, bridge timbers, utility poles, marine and foundation piling and other outdoor agricultural and recreational facilities [1-5]. Because of its excellent fungicide and insecticide properties, the application of creosote significantly extend the service life of wood products for up to 30 years or more [6]. Bestari et al. [7] reported that the life expectancy of marine wood pilings was extended from 10 to 40 years and 75% of creosote was still left in the treated wood at the end of this period.
Depending on the sources and preparation procedures, the components of creosote may vary in concentration and types. Typically, creosote distilled from crude coke oven tar may consist of 75% of polycyclic aromatic hydrocarbons (PAHs), 2% - 17% phenolic compounds, 10% - 18% heterocyclic organic compounds and minor aromatic amines [3]. The presence of the toxic PAHs and phenolic compounds make creosote treated wood harmful for the environment at the end of its service life and direct or indirect human exposure to creosote treated wood may cause damage to kidney, liver, bladder, eyes and skin carcinogen [3]. Current disposal practices of creosote-treated wood waste such as incineration and landfill are problematic because of the release of components such as PAHs and furans and the possible migration of contaminants can cause soil, groundwater and surface water deterioration [4]. More than 300 organic compounds of creosote (polycyclic aromatic hydrocarbons, phenolic compounds and other heterocyclic organic compounds) are not easily degraded in the environment with the conventional disposal practice. Therefore, there is a need for an effective degradation technique for the pollutants in creosote-treated wood waste in order to minimize the disposal of wood waste in landfills and to convert the wood waste into value added product.
Composting of wood waste is a beneficial treatment option for creosote-treated wood waste as the wood substance can be converted into humus during these volumedecreasing processes of mineralization and humification. If the contaminants in the waste are properly degraded, the final value-added product can be used as a soil amendment [8-10]. The temperature of the composting process is important as it affects the microbial reaction rate and the activity of microorganisms. A stable product requires a long period of thermophilic phase (a temperature higher than 55˚C). Typically during the composting process, the thermophilic phase lasts no longer than 2 - 3 days [11-13]. In order to accelerate the maturing process, a prolonged thermophilic phase is required. Given that mesophilic cellulolytic microorganisms would be severely deactivated under temperature higher than 37˚C, thermophilic fungi or bacteria would be better decomposers under elevated temperature environment [14]. Therefore, the inoculation of cellulolytic thermophilic microorganisms may help to achieve a fast bioremediation process.
Actinomycetes (bacteria which grow as branching hyphae) have an important role in carbon cycle because they have the ability to produce thermostable cellulolytic enzymes [15] and are well adapted to the penetration and degradation of organics such as lignocellulose [16] The thermophilicactinomycete, Thermobifida fusca, has been reported to produce cellulases that can hydrolyze the cellulose chain into cellobiose, glucose and intermediate oligosaccharides [17] and has also been used in several hydrocarbon bioremediation studies [18-20]. Tuncer et al. [16] found the optimum temperature for the extracellular lignocellulolytic enzyme produced by Thermobifida fusca BD25 to be 50˚C at a pH of 7.0 - 8.0. Kleeberg et al. [18] reported 20-fold higher biodegradation of 1,4-butanediol, adipic acid, terephthalic acid and aliphatic-aromatic copolyesters in presence of Thermobifida fusca. Witt [19] reported 99.9% degradation of aliphatic-aromatic copolyesterEcoflex® in presence of Thermobifida fusca at 55˚C after 22 days.
The main aim of this study was to evaluate the possibility of using a composting process augmented with the actinomycete Thermobifida fusca as a thermophilic bioremediation option for the degradation of cellulose and phenolic compounds in creosote treated wood waste.The focus in this study was on phenolic compounds because extensive studies have been conducted on PAHs, but few reports were found in the literature on phenolic compounds.
2. Experimental Apparatus
The experiments were carried out in a specially designed three bioreactor composting system (Figure 1). The bioreactors were horizontally fastened into a main frame. Each bioreactor was made of polyvinyl chloride cylinder (PVC/711, IPS Corporation, Gardena, Canada) and had an inside diameter of 203 mm, a length of 520 mm and a wall thickness of 5 mmwhich provideda space for 3.5 kg (wet-basis) of the compost mixture plus 25% of the volume as a head space (Figure 2). A fixed circular PVC plate of 203 mm diameter and 6 mm thickness was glued intothe back end of the cylinder. A removable circular plexiglas plate of 203 mm diameter and 6 mm thickness was installed on the front end of the cylinder. A circular window of 64 mm diameter was left on the removable circular plate for sampling purposes (Figure 2). The window was closed with a rubber stopper (No. 13) when it was not in use. The cylinders were insulated with a 38.1 mm thick fiberglass while the removable circular plates were insulated with a 38.1 mm thick Styrofoam layer.
Each bioreactor had three holes at the bottom for supplying air to the bioreactor. A hole at the top was used for the exhaust gas. The pressure regulated air passed through a desiccator and then through a flow meter (No 32461-14, Cole-Parmer Instrument Company, Vernon Hills, Illinois, USA). The flow meter had a 10 cmscale and a range of 0.0566 - 0.566 m3/h. The exhaust gas passed through a scrubber containing waterto remove aerosol and water soluble organic compounds, then through another scrubber to remove any airborne PAH compounds.
A removable 10.5-mm diameter solid stainless steel shaft was mounted on two bearings inside each bioreactor (Figure 2). There were 5 stainless steel collars on the shaft on each of which, a bolt of 69 mm length and 6 mm diameter was mounted. A thermallyprotected electric motor (Model No. 127P1486/B, D.C., Sigma Instruments, Braintree, Massachusetts, USA) was used to rotatethe mixing shaft (5.76 rpm).
The data acquisition unit consisted of a master unit (Multiscan 1200), thermocouple/volt scanning card (MTC/24) and Tempviewsoftware(Omega, Stamford, Connecticut, USA). The temperature sensors (type T thermocouples, Cole Parmer, Chicago, Illinois, USA) were inserted through specially constructed fitting on the bottom of the bioreactors and were located far enough from the inlet air holes (65 mm away) to minimize the influence of inlet air temperature. A personal computer was used to run the data acquisition system and store the data.
3. Experimental Procedure
3.1. Collection and Preparation of Wood Waste
C & D wood was collected from a C & D site (Yartmouth, Nova Scotia) and screened to remove visible nonbiodegradable materials. It was then sieved using USA Standard Testing Sieve with 12.5 mm opening (USA Standard Testing Sieve, ATM, Milwaukee, Wisconsin, USA). Fresh compost (Miller Compost Corporation, Dartmouth, Nova Scotia) was mixed with the wood waste at a ratio of 1:1 as a source of composting microbial culture and bioavailable nutrients. The C:N ratio was adjusted using urea [CO(NH2)2] and the moisture content was adjusted to 60% using distilled water.breviations in the title or heads unless they are unavoidable.
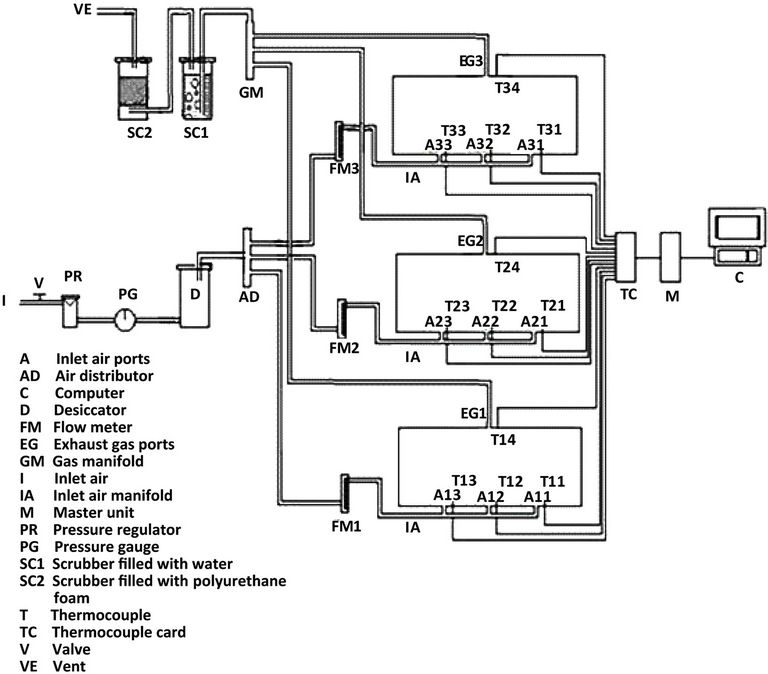
Figure 1. The experimental set up of the bioremediation system.
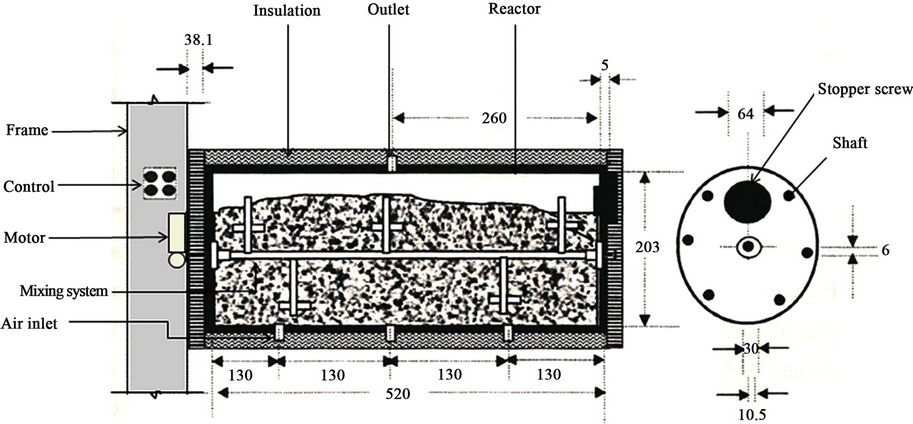
Figure 2. Bioreactor (dimensions in mm).
3.2. Preparation of Inoculums
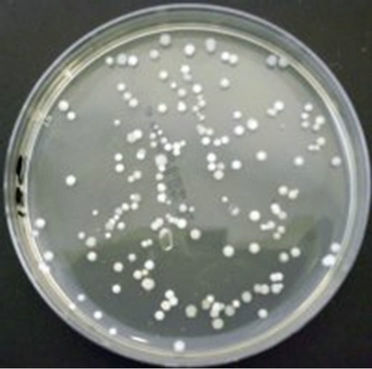
Thermobifida fusca (ATCC BAA-630) was obtained from the American Type Culture Collection (Manassas, Virginia, USA) andused as inoculum in one of the experiments. The procedure for preparing the inoculum is presented in Figure 3. Slants and Petri dishes were made using TYG agar medium and TYG broth medium was used as liquid medium. The recipe for TYG agar medium and TYG broth medium is listed in Table 1. The freeze dried culture was hydrated in TYG broth and then plated on TYG agar. Both were incubated (Isotemp® oven, Model 106G, Fisher Scientific, Hampton, New Hampshire, USA) at 50˚C. After 3 days, small hard and compact colonies with white color start forming on the TYG agar (Figure 4(a)). After 4 days, Thermobifida fusca produced the aerial hyphae with branched sporophores and at the tip of each a single spore forms (Figure 4(b)). Spore suspension of Thermobifida fusca was prepared by cutting 1 cm2 Petri dish culture into 25 ml sterile TYG broth medium. The inoculated broth was incubated (Isotemp® oven, Model 106G, Fisher Scientific, Hampton, New Hampshire, USA) at 50˚C for 48 h. Colony forming units (CFU) were obtained using the plate count method [21].
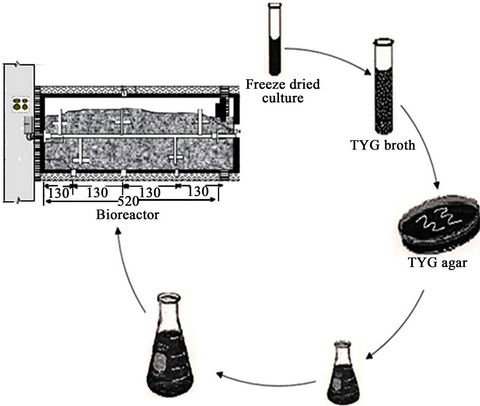
Figure 3. Steps for preparing the Thermobifida fusca spore suspension.
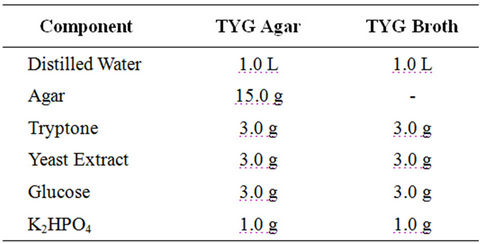
Table 1. Components for TYG agar and TYG broth.
 (a)
(a)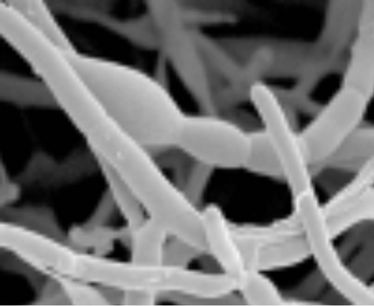 (b)
(b)
Figure 4. Thermobifida fusca: (a) Small hard and compact colonies with white color; (b) Long aerial hyphae observed under SEM.
An amount of 5 ml media containing the CFU of 1.0 × 10⁶/ml was transferred into Fernbachflasks containing 250 ml of liquid cultural media and agitated on rotary shaker (Series G-25 Incubator Shaker, New Brunswick Company, New Jersey, USA) at 120 rpm and 50˚C for 48 hours. The final cultureswere used as inoculums in the experiment in the amount of 10% (by weight) of composting materials.
3.3. Experimental Protocol
A summary of the experimental procedure performed on creosote treated wood waste samples and the various parameters measured during the treatment process is presented in Figure 5. Approximately 3.5 kg of the final mixture were placed in each bioreactor. Two experiments were carried out: 1) a control experiment with no Thermobifida fusca and 2) an augmented experiment with Thermobifida fusca inoculum added to the mixture. Each experiment lasted for 15 days and three replicates were conducted for each experiment using the three bioreactors simultaneously. The pressure-regulated air was supplied continuously to the bottom of the bioreactor and the air flow rate was measured by a flow meter (No 32461- 14, Cole-Parmer Instrument Company, Vernon Hills, Illinois, USA) and adjusted to 0.05 m3/h. The temperature was monitored throughout the process and the data was stored in a Microsoft Excel® file in the computer every 30 min. An amount of 36 ml used cooking oil were added into each bioreactor every 12 h as a source of bioavailable carbon as recommended by Alkoaik [22]. The pH and moisture content were monitored. The quality, stability and maturity of the end product were evaluated by quantifying C:N ratio, pH, CO2 evolution, phytotxicity, degradation of cellulose and lignin and the degradation of phenolic compounds.
4. Experimental Analyses
4.1. Moisture Content and pH
The moisture content (MC) was measured following the ASTM (D4442-07) oven-drying method [23]. Slurry contained about 10 g of material and 50 ml distilled water was used to measure the pH using a pH meter (Fisher Accumet®, Model 805 MP, Fisher Scientific, Montréal, Quebec, Canada).
4.2. Total Carbon
Approximately 1.0 gof the material was used for total carbon analysis. Carbon dioxide was determined with a Leco carbon analyzer (Model 516-000, Leco Corporation, St. Joseph, Michigan, USA) along with an induction furnace (Leco HF2O Furnace, Leco Corporation, St. Joseph, Michigan, USA) at the Mineral Engineering Centre of Dalhousie University, Halifax, Nova Scotia.
4.3. Solids
The solids analyses were performed according to the procedures described in the USEPA Method 1684 [24]. Ash contents were determined by burning samples (approximately 1 g) in muffle furnace (Isotemp® Muffle Furnace, Model 186A, Fisher Scientific, Montréal, Quebec, Canada) at a temperature of 550˚C for 20 minutes.
4.4. Total Kjeldahl Nitrogen
The total kjeldahl nitrogen (TKN) wasdetermined at Maxxam Analytical Testing Laboratory (Mississauga, Ontario) following the procedure of USEPA Method 351.2 [25].
4.5. Phenolic Compounds
Phenolic compounds were extracted from 3 g material with 50 ml deionized water and centrifuged for 20 min at 2400 rpm. The supernatant was vacuum filtered through a 0.4 μm polycarbonate filter paper (Fisher Scientific, Montreal, Quebec, Canada) as described by Chantigny et al. [26]. The supernatant was transferred into a flask and analyzed for the presence of phenolic compounds using the 4-aminoantipyrine colorimetric test following
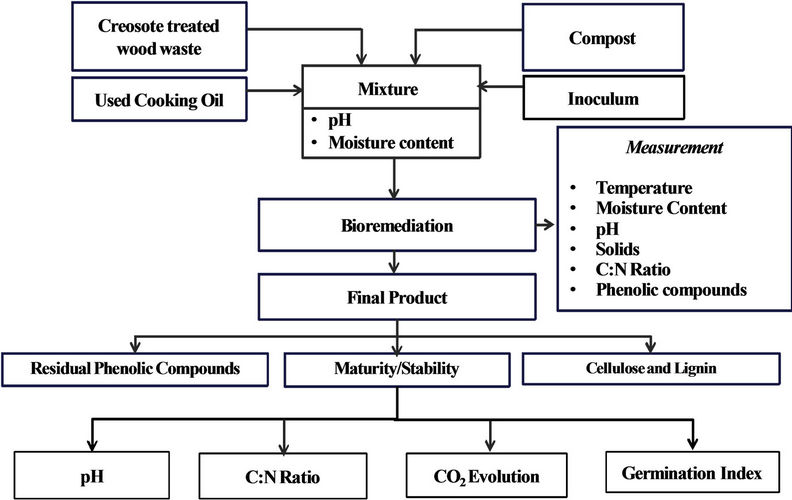
Figure 5. Flow chart showing different wood samples and parameters analysed during composting and bioremediation.
the ASTM procedure [27]. The absorbance was measured at 510 nm using spectrophotometer (Spectronic 601, Milton Roy, Ivyland, Pennsylvania, USA). A standard curve was developed as shown in Figure 6.
4.6. The Germination Index (GI)
The germination index (GI) was measured following the procedure described by Jiang et al. [28]. About 10 g of final compost sample were mixed with 100 mL distilled water. Ten cress seeds (Lepidiumsativum L.) were placed on the filter paper (Whatman® 40, Whatman Inc., Clifton, New Jersey) in a sterilized Petri dish. Then, 5.0 ml of the extract was transferred into the filter paper. Three replicates were carried out for each sample. The Petri dishes were incubated at 25˚C in the dark for 48 hours. The results were evaluated by counting the number of germinated seeds and measuring the length of roots. The germination index (GI) was determined as follows:
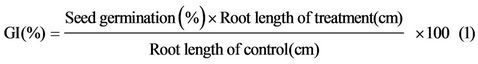 (1)
(1)
4.7. CO2 Evolution
CO2 evolution was determined as described by Benito et al. [29]. Approximately 25 g of the final compost were pre-incubated at room temperature for 3 days. The moisture content was adjusted to 60% and each sample was separately sealed in containers containing a beaker with 10 ml of 1 MNaOH solution. The samples were incubate at 25˚C andthe CO2 generated was determined by titrating NaOH solution with 1 MHCl solution every day for 5 consecutive days. The rate of CO2 evolution was calculated as mg C-CO2 per gram compost per day.
4.8. Cellulose and Lignin Contents
The cellulose and lignin contents were measured following the AOAC Standard Methods [30] for acid detergent fiber (ADF) and acid detergent lignin (ADL). Cellulose was estimated as the difference between ADF and ADL. Lignin was estimated as the difference between ADL and ash content as described by Yu et al. [31].
5. Results
5.1. Temperature
The average ambient temperature and the temperatures of the control experiment and the Figure 7. The room temperature was stable at around 23˚C ± 1˚C. The peak temperatures for control and the inoculated experiments were 51.9˚C and 52.0˚C, respectively. The temperature was maintained above 45˚C for 71 and 99 h and above 40˚C for 170 and 186 h for the inoculated and control experiments, respectively. Accumet®, Model 805 MP, Fisher Scientific, Montréal, Quebec, Canada).
5.2. Moisture Content
The moisture content decreased gradually during the bioremediation process as shown in Figure 8. The final moisture contents for the control and inoculated experiments were 42.9% and 43.8%, respectively.
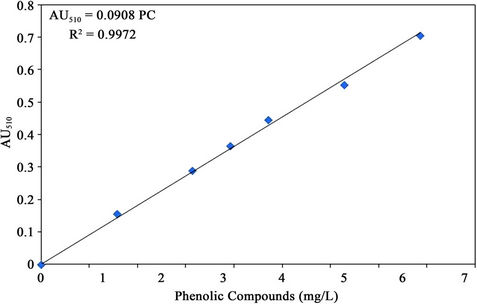
Figure 6. Standard curve for the phenolic compounds.
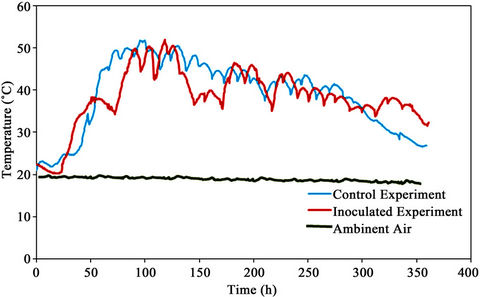
Figure 7. Temperature profiles.
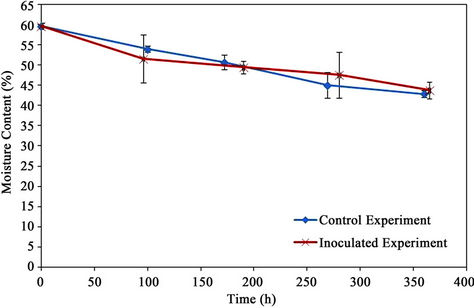
Figure 8. Moisture content.
5.3. pH
The pH measurements are shown in Figure 9. The initial material was acidic (a pH of 6.0) which changed to basic after the first week (8.5 for the control and 7.4 for the inoculated experiment) and then decreased to a weak acidic (5.5 for the control and 6.8 for the inoculated experiment).
5.4. Solids
The volatile solids and ah contents are presented in Figure 10. The initial volatile solids and ash contents of the material were 805 ± 10 g/kg material and 195 ± 12 g/kg material (dry basis), respectively. The ash content remained unchanged till the end of the bioremediation process. The volatile solids content decreased to 775 ± 12 and 776 ± 14 g/kg material (dry basis) with reductions of 3.7% and 3.6% for the control and the inoculated experiments, respectively.
5.5. Total Carbon
The total carbon content is shown in Figure 11. The initial
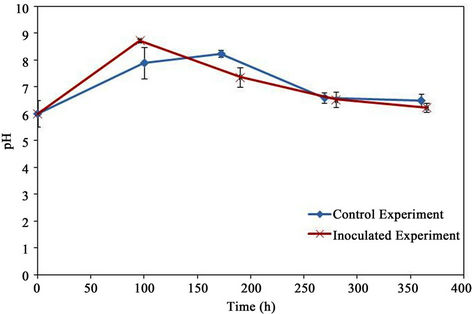
Figure 9. pH.
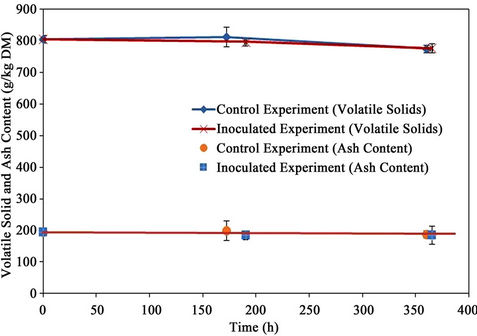
Figure 10. Solids.
total carbon of the mixture was 392 g/kg material (dry basis). The final total carbons for the control and the inoculated experiments were the same as 358 g/kg material (dry basis) resulting in total carbon reduction of 8.7%.
5.6. Total Kjeldahl Nitrogen
The total kjeldahl nitrogen (TKN) results are shown in Figure 12. The initial TKN was 24.94 g/kg material (dry basis) which decreased to 12.5 and 11.9 g/kg material (dry basis) resulting in TKN reductions of 50.2% and 52.6% for the control and the inoculated experiments, respectively.
5.7. C:N Ratio
The C:N ratio (Figure 13) was calculated from total carbon and total kjeldahl nitrogen data. The initial C:N ratio of the mixture was 15.6:1 which increased to 28.6:1 and 30.1:1 for the control and the inoculated experiments, respectively. This was due to the rapid consumption of nitrogen by microorganisms (to metabolize bio-available carbon for cell growth and energy production).
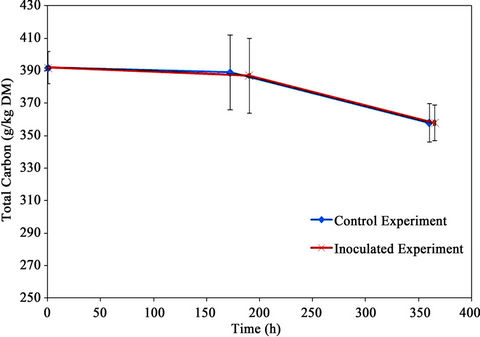
Figure 11. Total carbon content.
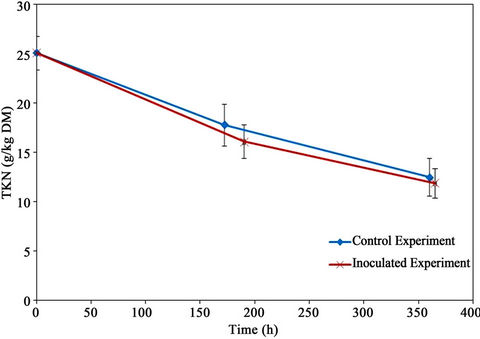
Figure 12. TKN content.
5.8. Phenolic Compounds
The initial concentration of PC was 0.222 ± 0.010 mg/g material (dry basis). The concentration of PC decreased gradually in both experimental trials, reaching the same final concentration of 0.058 mg/g material (dry basis) as shown in Figure 14. Approximately, 73.9% of the phenolic compounds were degraded in 15 days.
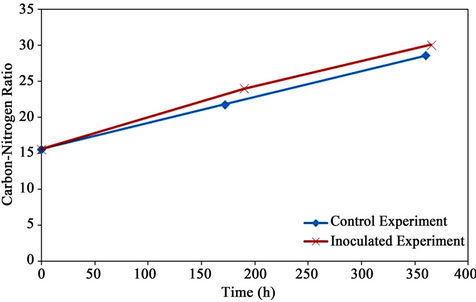
Figure 13. C:N.
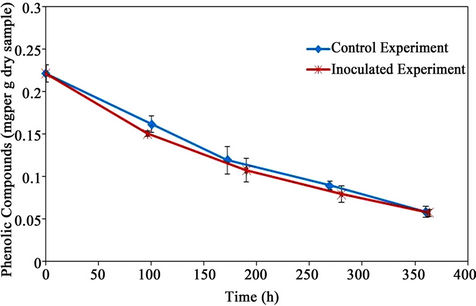
Figure 14. Phenolic compounds.
5.9. Lignocellulose
The results of the degradation of cellulose and lignin are shown in Table 2. The initial content of cellulose was 24.8% ± 1.5% which decreased after 15 days to similar amounts of 19.2% and 19.1% resulting in reductions of 22.6% and 23.0% for the control and inoculatedexperiments, respectively. The initial content of lignin was 19.8% ± 0.9% which decreased after 15 days to 16.3% for the control and the inoculated experiments resulting in reductions of 17.7%.
5.10. Maturity and Stability Tests
The maturity and stability of the final product were evaluated by analyzing the CO2 evolution (as mg of CO2- C/g VS-day and mg of CO2-C/g C-day), the germi-nation rate (GR) and the germination index (GI) of the final products. The results are shown in Table 3. The CO2 evolution rates from the final products were 3.18 and 3.21 mg CO2-C/g VS-day for the control and inoculated experiments, respectively. The initial GI values were 0% and 1% for the control and the inoculated experiments which improved significantly after 15 days reaching 20% and 19% for the control and inoculated experiments, respectively.
6. Discussion
6.1. Temperature
The fluctuation in the temperature during the thermophilic phase (between 40˚C and 50˚C) was caused by opening the sampling port every 12 hours for adding the used cooking oil (bio-available carbon). The thermal energy lost from the bioreactors exceeded the energy input from the biodegradation of bio-available carbon in the wood mixture at the end of the experiment which

Table 2. Cellulose and lignin.
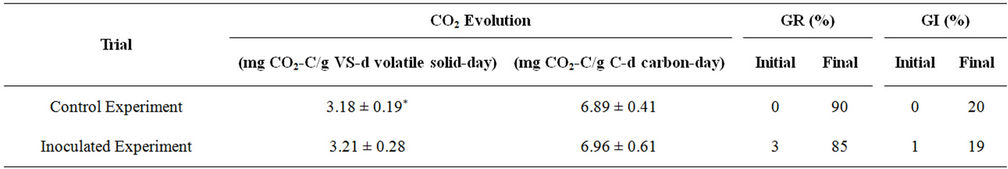
Table 3. CO2 evolution, germination rate and germination index.
resulted in the decline of temperature. A peak temperature above 50˚C was observed in both the control and the inoculated bioreactors indicating that asuccessful thermophilic phase was achieved. McMahon et al. [32] observed a peak temperature above 70˚C during the composting of a mixture of board waste (C & D wood waste) with poultry manure, green waste and top soil. Ghaly et al. [33] composted a mixture of tomato plant residues, wood shavings and municipal solid waste compost and maintained a peak temperature of 55˚C for 96 h by the continuous addition of used cooking oil as a bioavailable carbon. VanderGheynst et al. [34] composted a synthetic food waste and digested biosolids and reported maximum temperatures of 60˚C after 56 h from the start. The lower temperature achieved in the present study is due to the low bio-available carbon in the cellulosic feedstock and the loss of heat during the sampling periods.
6.2. Moisture Content
Water is the media for nutrient transport and biological reactions. It affects the availability of nutrients and contaminants in the micro-environment surrounding the microorganisms. The optimum moisture content for metabolic activity is in the range of 50% - 70% [13,35,36,37] and microbial activities are significantly restricted if the moisture content is lower than 30% [38]. Suehara et al. [39] reported moisture contents in a mixture of fresh tofu refuse of 72% which was decreased to 70.5% after 6.5 d of composting. Linag et al. [40] found a moisture content of 50% to be the minimum for microbial activity and a moisture content in the range of 60% - 70% provided maximum activities during the composting of biosolids. Lu et al. [41] reported that a maximum temperature and a maximum CO2 evolution rate were achieved during composting of barley dregs and sewage sludge when the moisture content was kept within the range of 50% - 60%. which was not within the optimal range but was still high enough for the composting process to processed.
6.3. pH
Initially, slightly acidic pH was observed for the control and the inoculated experiments. The pH of the control experiment increased to 7.9 on the 4th day and then gradually decreased back to a weak acidic pH (pH 6.5) by the end of the experiment. In the inoculated experiment, the pH increased to a high of 8.7 on the 4th day and then gradually decreased back to a weak acidic pH (pH 6.2). Sundberg et al. [42] reported inhibition of the microbial activity at a pH below 6.0. Beck-Friis et al. [43] reported an initial decrease in pH due to increased production of short chain fatty acids during the initial phase of household waste composting. Production of these fatty acids results from degradation of easily degradable nutrients such as sugars, starch and fats [37]. In the present study, the decomposition of organic nitrogen and the production of NH4 caused the initial pH increase while the decomposition of fats and grease resulted in the formation of organic acids that caused the final drop in the pH.
6.4. Solids
Volatile solids (VS) include organic matters such as oil and fats which are easily broken down by microorganisms into CO2, water and energy [44,45]. Khan and Anjaneyulu [46] conducted a study on the bioremediation of phenolic compounds and benzene contaminated soil and sediment using a composting technology and reported VS reductions of 42% - 48% after 40 days of composting. Lemus et al. [47] reported reduction in volatile solids in the range of 7% - 21% in the active phase and 2% - 32% in the curing phase during composting of grease trap sludge with yard trimmings and synthetic food waste. In the present study, the wood waste had low bioavailable carbon and 36 ml of the used cooking oil was added into the system every 12 hrs as bio-available carbon source and as a result the reduction in volatile solid was very small (3.6% - 3.7%). The ash contents stayed relatively constant.
6.5. Total Carbon
The total carbon reductions for the control and the inoculated experiments were 8.7%. Ramaswamy et al. [48] reported a 10% reduction in total carbon during composting of salinomycin (antibiotics) contaminated manure. Kumar et al. [49] used a consortium of three fungi (Aspergillusnidulans, Scytalidiumthermophilum and Humicola sp.) to compost a mixture of silica rich paddy straw and lignin rich soybean trash (1:1) and reported reduction in total carbon content of 36% for soybean supplemented paddy straw and 25% for urea amended and inoculated paddy straw. Tiquia et al. [50] compared turned windrows with unturned windrows during the composting of hoop manure for 42 days and found that the carbon loss in the turned windrow was significantly higher (50% - 63%) than in the unturned windrows (30% - 54%). The lower reduction of total carbon in the present study may be due to the shorter composting time and lower biodegradability of the wood waste used in the experiment.
6.6. Total Kjeldahl Nitrogen (TKN)
The reductions in TKN were more rapid and much higher than the reductions in the total carbon due to the immobilization of NH4 by microorganisms and the loss of NH3 with the exhaust gas. However, the rates of TKN reduction for the control and the inoculated experiment were similar which is consistence with the reduction in total carbon. Ramaswamy et al. [48] reported 36% loss in TKN during composting of salinomycin (antibiotics) contaminated manure, which was substantially lower than corresponding loss of 60% in the control. Chen et al. [51] evaluated effects of bamboo charcoal and bamboo vinegar on nitrogen conservation during pig manure composting and reported 10% TKN loss with the addition of vinegar compared to 12.3% TKN loss with addition of charcoal.
6.7. C:N Ratio
Wang et al. [52] reported the following reasons for the reduction of the C:N ratio in a biological decomposition system: 1) the organic carbon is oxidizedto CO2 faster than ammonium is oxidizedto  and 2) nitrogen can remain relatively stable if the balance between mineralization of organic nitrogen to NH4 and the immobilization of NH4 to organic nitrogen (microbial growth) is maintained during the process. However, C:N ratio is also affected by the initial concentration of nitrogen. With a high initial concentration of nitrogen, the reduction in nitrogen will exceed the reduction in total carbon resulting in higher C:N ratio. Higher nitrogen loss can be associated with higher temperatures and/or a longer thermophilic phase [52-54]. Lower C:N ratio at initial phase of bioremediation results in significant high emission of NH3and losses of nitrogen [13]. Tiquia et al. [54] composted manure with an initial C:N ratio in the range of 9:1-12:1 and reported nitrogen losses of 35% - 45% after 42 days. Similar trends were reported by Morisaki et al. [55] and Tiquia and Tam [54]. Sadaka and El-Taweel [56] reported a 33.1% reduction in C:N value with aeration rate of 0.003 m3/h/kg and initial C:N of 39:1 during composting of residential waste.Lemus et al. [47] reported 35% - 40% reduction in the C:N ratio when composting yard trimmings and 60% - 64% reduction when composting synthetic food waste. Li et al. [57] reported 50% reduction in C:N ratio after 12 days of co-composting of poultry litter, municipal solid waste and corn straw. In present study, the C:N ratio increased by 83% and 93% for the control and the inoculated experiments, respectively due to continuous addition of used cooking oil and the rapid consumption of nitrogen by microorganisms for cell growth.
6.8. Phenolic Compounds
The phenolic compounds (PC) were degraded by 73.9% after 15 days of bioremediation in both the control and the inoculated experiments. As indicated by the reduction of volatile solids, total carbon and TKN, similar activity of microorganisms in both experimental trials resulted in the same phenolic compounds reductions. McMahon et al. (10) studied the degradation of creosote components in the C & D wood waste using composting technique. The highest degradation of creosote (66%) was achieved after 10 days with a peak temperature of 45˚C. In present study, the higher degradation of PC was due to the addition of bio-available carbon (used cooking oil) which helped in achieving a higher temperature. Prpich et al. [58] studied the biodegradation of phenolic compounds in contaminated soil. The phenol in the contaminated soil was first absorbed using polymer beads, desorbed in distilled water to a concentration of 365 mg/L and degraded completely by phenol-degrading microbial culture in 10 h.
The degradation of organic substrate can be described with the following first order model [38]:
 (2)
(2)
where:
 is the concentration of the organic substrate at time t (mg/kg);
 is the initial concentration of the organic substrate (mg/kg);
k is the rate constant.
The value Ln(Ct/C0) has a linear relationship with the time t within a given temperature range. The linear relationship between Ln(Ct/C0) and time for phenolic compounds was determined graphically for the mesophilic and thermophilic temperature zones as shown in Figure 15. The rate constant (k) was determined from the slope of the lines (Table 4).The mesophilic rate constant was
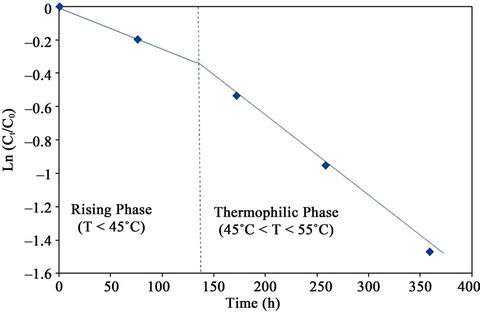
Figure 15. Graphical determination of rate constant (k) for PC degradation.
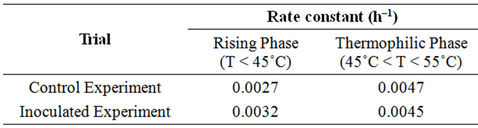
Table 4. Rate constants for PC degradation.
0.0027 and 0.0032 h–1 for the control and the inoculated experiment, respectively.
6.9. Lignocellulose
Little effect on the degradation of cellulose and lignin was observed during the bioremediation process with the inoculation of cellulolytic thermophilic microorganisms. Petre et al. [59] used two immobilized bacteria species (Bacillus subtilis, Bacillus licheniformis) and a fungus specie (Trichodermaviride) in the bioremediation of cellulosic wastes in a specially designed bioreactor for 240 h and reported cellulose degradations of 25%, 23% and 15% by Bacillus subtilis, Bacillus licheniformis, Trichodermaviride, respectively. The present study resulted in similar degradation of cellulose and lignin but in a shorter period of time. This may be due to the addition of bioavailable carbon (used cooking oil). Crawfod [60] reported 5% - 10% reduction in lignin content after 14 days incubation during growth of Thermomonospovafusca on lignocellulosic pulps of varying lignin content and concluded that Thermomonospora fusca wasable to initiate the general decomposition of lignocellulose, but would not be involved in the complete degradation of lignocellulose to CO2 and H2O. Shi et al. [61] tested the effects of surfactants Tween80 andRhamnolipid on the acceleration of composting cellulose-rich waste for 18 days and found reduction rates of 43.5% and 40.5%, respectively.
6.10. Maturity and Stability Tests
CO2 evolution and germination index (GI) of the final product were used to evaluate the maturity and stability of the bioremediation product. CO2 evolution is a good indicator to determine the level of microbial activity and the stability of compost while GI provides information about the decomposition of phytotoxic organic substances which indicates the maturity of compost. The lower the CO2 evolution, the more stable the product is, and the higher the GI, the more mature the product is [62-64].
There was no significant difference between the control and the inoculated experiments in the GI and CO2 evolution rate. This indicates that the final products of these experiments have a similar stability. These results correlated well with the reductions in the volatile solids, total carbon, and total kjeldahl nitrogen. Boulter-Bitzer et al. [64] assessed the maturity and stability of different compost products from horse manure, chicken manure, paunch manure, bone meal ash and bark mix. After 217 - 231 days of composting, the final products had CO2 evolution rates of 2.3 - 3.5 mg CO2-C per g vs per day. In present study, the control and inoculated experiments achieved similar CO2 evolution rates in much shorter periods. Wu et al. [63] used CO2 evolution to evaluate the stability of compost products from different composting facilities in Florida. In two groups of samples of stable compost, the CO2 evolution rates were around 0.5 - 0.8 mg CO2-C per g vs per day in one group and 5.7 mg CO2-C per g vs per day in another group. These results indicated that GI of the products in both trials were not free of phytotoxicity. However, CO2 evolution rate of both trials indicated the stability of the products. The pH of both products were 5.5 and 6.8 which were within the range of 5 - 7 for stable compost.
7. Conclusion
The temperature of the control and the inoculated experiments reached the thermophilic phase (>45˚C). Lag phases were clearly identified during the temperature increase for the mesophilic phase and thermophilic phase. The moisture content decreased in both experiments because the water produced by microbial respiration did not compensate for the water lost as vapor with the exhaust gases. The final moisture content remained around 43% which is within the optimum range for composting of 40% - 60%. The fluctuation of pH during the composting was due to the breakdown of organic nitrogen to ammonium at first and the formation of organic acids from decomposition of fats and grease and the loss of ammonium with the exhaust gases in the latter stage. Different degradation rates were observed in the mesophilic and thermophilic stages of composting. Both trials achieved similar reductions in volatile solids, total carbon and TKN indicating similar levels of microbial activities during the bioremediation process. As a result, similar degradation of phenolic compounds, cellulose and lignin were observed in both experiments. The stability and maturity of the product of both experiments were comparable as well. The inoculation of cellulolytic and thermophilicactinomycetes Thermobifida fusca did not accelerate the bioremediation process in degrading phenolic compounds and showed no effect on the environmental factors during the bioremediation process.
8. Acknowledgements
This research was supported by the National Science and Engineering Research Council (NSERC) of Canada.
REFERENCES
- P. B. Bedient, A. C. Rodgers, T. C. Bouvette, M. B. Tomson and T. H. Wang, “Groundwater Quality at a Creosote Waste Site” Groundwater, Vol. 22, No. 3, 1984, pp. 318- 329. doi:10.1111/j.1745-6584.1984.tb01404.x
- CEPA, “Canadian Environmental Protection Act. Priority Substances List Assessment Report. Creosote-Impregnated Waste Materials,” Canadian Environmental Protection Act, Parliament of Canada, Ottawa, 1993.
- ATSDR, “Toxicological Profile for Wood Creosote, Coal Tar Creosote, Coal Tar, Coal Tar Pitch, and Coal Tar Pitch Volatiles. Agency for Toxic Substances and Disease Registry,” US Department of Health and Human Services, 2002. http://www.atsdr.cdc.gov/toxprofiles/tp85.pdf
- CICAD, “Concise International Chemical Assessment Document 62: Coal Tar Creosote,” World Health Organization, Geneva, 2004.
- Y. Ikarashi, M. Kaniwa and T. Tsuchiya, “Monitoring of Polycyclic Aromatic Hydrocarbons and Water-Extractable Phenols in Creosotes and Creosote-Treated Woods Made and Procurable in Japan,” Chemosphere, Vol. 60, No. 9, pp. 1279-1287. doi:10.1016/j.chemosphere.2005.01.054
- L. Becker, G. Matuschek, D. Lenoir and A. Kettrup, “Leaching Behaviour of Wood Treated with Creosote,” Chemosphere, Vol. 42, No. 3, 2001, pp. 301-308. doi:10.1016/S0045-6535(00)00071-0
- K. T. J. Bestari, R. D. Robinson, K. R. Solomon, T. S. Steele, K. E. Day and P. K. Sibley, “Distribution and Composition of Polycyclic Aromatic Hydrocarbons within Experimental Microcosms Treated with Creosote-Impregnated Douglas Fir Pilings,” Environmental Toxicology and Chemistry, 1998, Vol. 17, No. 12, pp. 2369-2377. doi:10.1002/etc.5620171202
- C. Löser, H. Ulbricht, P. Hoffmann and H. Seidel, “Composting of Wood Containing Polycyclic Aromatic Hydrocarbons (PAHs)” Compost Science and Utilization, Vol. 7, No. 3, 1999, pp. 16-32.
- H. Borazjani, S. Diehl and H. A. Stewart, “Composting of Wood Wastes: Plywood and Sawmill Residue,” 2000. http://fwrc.msstate.edu/pubs/composting.pdf
- V. McMahon, A. Garg, D. Aldred, G. Hobbs, R. Smith and I. E. Tothill, “Composting and Bioremediation Process Evaluation of Wood Waste Materials Generated from the Construction and Demolition Industry,” Chemosphere, Vol. 71, No. 9, 2008, pp. 1617-1628. doi:10.1016/j.chemosphere.2008.01.031
- R. T. Haug, “The Practical Handbook of Composting Engineering,” Lewis Publishers, London, 1993, pp. 1, 10-170, 193, 206.
- CCME, “Canadian Council of Ministers of the Environment, Guidelines for Compost Quality,” Winnipeg, 1996.
- S. Gajalakshmi and S. A. Abbasi, “Solid Waste Management by Composting: State of the Art,” Critical Reviews in Environmental Science and Technology, Vol. 38, No. 5, 2008, pp. 311-400. doi:10.1080/10643380701413633
- D. G. Cooney and C. G. Golueke, “Thermophilic fungi: An Account of Their Biology, Activities and Classification,” W. H. Freeman, San Francisco, 1964.
- A. S. Ball and A. J. McCarthy, “Production and Properties of Xylanases from Actinomycetes,” Journal of Applied Bacteriology, Vol. 66, No. 5, 1989, pp. 439-444. doi:10.1111/j.1365-2672.1989.tb05113.x
- M. Tuncer, A. S. Ball, A. Rob and M. T. Wilson, “Optimization of Extracellular Lignocellulolytic Enzyme Production by a Thermophilicactinomycete Thermomonospora fusca BD25,” Enzyme and Microbial Technology, 1999, Vol. 25, No. 1-2, pp. 38-47. doi:10.1016/S0141-0229(99)00012-5
- D. L. Crawford and E. McCoy, “Cellulases of Thermomonosporafusca and Streptomyces thermodiastaticus,” Applied Microbiology, Vol. 24, No. 1, 1972, pp. 150-152.
- C. Kleeberg, R. Hetz, M. Kropperstedt, R. Muller and W. Deckwer. “Biodegradation of Aliphatic-Aromatic Copolyesters by Thermomonospora fusca and Other Thermophilic Compost Isolates,” Applied and Environmental Microbiology, Vol. 64, No. 5, 1998, pp. 1731-1735.
- U. Witt, T. Einig, M. Ymamoto, I. Leeberg, W. D. Deckwer and R. J. Muller, “Biodegradation of AliphaticAromatic Coployesters: Evaluation of the Final Biodegradability and Ecotoxicological Impact of Degradation Intermediates,” Chemosphere, Vol. 44, No. 2, 2001, pp. 289-299. doi:10.1016/S0045-6535(00)00162-4
- Kleeberg, K. Welzel, J. VandenHeuvel, R. J. Muller and W. D. Deckwer, “Characterization of a New Extracellular Hydrolase from Thermobifida fusca Degrading AliphaticAromatic Copolyesaters,” Biomacromolecules, Vol. 6, No. 1, 2005, pp. 262-270. doi:10.1021/bm049582t
- G. M. Balestra and I. J. Misaghi, “Increasing the Efficiency of the Plate Counting Method for Estimating Bacterial Diversity,” Journal of Microbiological Methods, Vol. 30, No. 2, 1997, pp. 111-117. doi:10.1016/S0167-7012(97)00056-0
- F. Alkoaik, “Fate of Plant Pathogens and Pesticides during Composting of Greenhouse Tomato Plant Residues,” Ph.D Dissertation, Dalhousie University, Halifax, 2005.
- ASTM, “American Standard Test Method, Annual Book of Standards. D 4442-07. Direct Moisture Content Measurement of Wood and Wood-Base Materials,” Philadelphia, 2007.
- U.S. EPA, “Method 1684: Total, Fixed, and Volatile Solids in Water, Solids, and Biosolids. EPA-821-R-01-015,” Office of Water, Office of Science and Technology, Engineering and Analysis Division, U.S. Environmental Protection Agency, Washington, DC, 2005.
- U. S. EPA, “Determination of Total Kjeldahl Nitrogen by Semi-Automated Colorimetry. EPA Method 351.2 (Revision 2). Environmental Monitoring Systems Laboratory Office of Research and Development,” U.S. Environmental Protection Agency, Cincinnati, 1993.
- M. H. Chantigny, D. A. Angers, K. Kaiser and K. Kalbitz, “Extraction and characterization of Dissolved Organic Matter,” In: M. R. Carter and E. G. Gregorich, Eds., Soil Sampling and Methods of Analysis (2nd Edition), Canadian Society of Soil Science, Manitoba, pp. 617-635.
- ASTM, “American Standard Test Method, Annual Book of Standards. D 1783-01 (Reapproved 2007). Standard Test Methods for Phenolic Compounds in Water,” Philadelphia, 2007.
- X. Jiang, G. Zeng, D. Huang, Y. Chen, F. Liu, G. Huang, J. Li, B. Xi and H. Liu, “Remediation of Pentachlorophenol-Contaminated Soil by Composting with Immobilized Phanerochaetechrysosporium,” World Journal of Microbiology and Biotechnology, Vol. 22, No. 9, 2006, pp. 909-913. doi:10.1007/s11274-006-9134-4
- M. Benito, A. Masaguer, A. Moliner, N. Arrigo and R. M. Palma, “Chemical and Microbiological Parameters for the Characterization of the Stability and Maturity of Pruning Waste Compost,” Biology and Fertility of Soils, Vol. 37, No. 3, 2003, pp. 184-189.
- AOAC International, “Official Methods of Analysis,” 18th Ed., Method 973.18, Association of Analytical Communities, Gaithersburg, 2005.
- H. Yu, G. Zeng, H. Huang, X. Xi, R. Wang, D. Huang, G. Huang and J. Li, “Microbial Community Succession and Lignocelluloses Degradation during Agricultural Waste Composting,” Biodegradation, Vol. 18, No. 6, 2007, pp. 793-802. doi:10.1007/s10532-007-9108-8
- V. McMahon, A. Garg, D. Aldred, G. Hobbs, R. Smith and I. E. Tothill, “Evaluation of the Potential of Applying Composting/Bioremediation Techniques to Wastes Generated within the Construction Industry,” Waste Management, Vol. 29, No. 1, 2009, pp. 186-196.
- A. E. Ghaly, F. Alkoaik, A. Snow and R. Singh, “Effective Thermophilic Composting of Crop Residues for Inactivation of Tobacco Mosaic Virus,” American Journal of Biochemistry and Biotechnology, Vol. 2, No. 3, 2006, pp. 111-118. doi:10.3844/ajbbsp.2006.111.118
- J. S. VanderGheynst, L. P. Walker and J. Y. Parlange, “Energy Transport in a High-Solids Aerobic Degradation Process: Mathematical Modeling and Analysis,” Biotechnology Progress, Vol. 13, No. 3, 1997, pp. 238-248. doi:10.1021/bp970023q
- C. G. Golueke, “Biological Reclamation of Solid Waste,” Rodale Press, Emmaus, 1977.
- S. M. Tiquia, N. F. Y. Tam and I. J. Hodgkiss, “Microbial Activities during composting of Spent Pig-Manure Sawdust Litter at Different Moisture Contents,” Bioresource Technology, Vol. 55, No. 3, 1996, pp. 201-206. doi:10.1016/0960-8524(95)00195-6
- E. Epstein, “The Science of Composting,” Technomic Publishing AG, Lancaster, 1997.
- R. T. Haug, “The Practical Handbook of Composting Engineering,” Lewis Publishers, London, 1993, pp. 1, 10-170,193,206.
- K.-S. Suehara, Y. Y. Nakano and T. Yano, “Rapid Measurement and Control of the Moisture Content of Compost Using Near-Infrared Spectroscopy,” Journal of Bioscience and Bioengineering. Vol. 87, No. 6, pp. 769-714. doi:10.1016/S1389-1723(99)80151-0
- C. Liang, K. C. Das and R. W. McClendon, “The Influence of Temperature and Moisture Contents Regimes on the Aerobic Microbial Activity of a Biosolids Composting Blend,” Bioresource Technology, Vol. 86, No. 2, 2003, pp. 131-137. doi:10.1016/S0960-8524(02)00153-0
- L. A. Lu, M. Kumar, J. C. Tsai and J. G. Lin, “High-Rate Composting of Barley Dregs with Sewage Sludge in a Pilot Scale Bioreactor,” Bioresource Technology, Vol. 99, No. 7, 2008, pp. 2210-2217. doi:10.1016/j.biortech.2007.05.030
- C. Sundberg, S. Smårs and H. Jönsson, “Low pH as an Inhibiting Factor in the Transition from Mesophilic to Thermophilic Phase in Composting,” Bioresource Technology, Vol. 95, No. 2, 2004, pp. 145-150. doi:10.1016/j.biortech.2004.01.016
- B. Beck-Friis, S. Smars, H. JEURonsson and H. Kirchmann, “Emissions of Carbon Dioxide, Ammonia and Nitrous Oxide From Organic Household Waste in a Compost Reactor Under Different Temperature Regimes,” Journal of Agricultural Engineering Research, Vol. 78, No. 4, 2001, pp. 423-430. doi:10.1006/jaer.2000.0662
- M. Viel, D. Sayag and L. Andre, “Optimization of Agricultural Industrial Wastes Management through in Vessel composting,” In: M. de Bertoldi, M. P. Ferranti, P. L. Hermite and F. Zucconi, Eds., Compost: Production, Quality and Use, Applied Science, London, 1987.
- G. R. Lemus and A. K. Lau, “Biodegradation of Lipidic Compounds in Synthetic Food Wastes during Composting,” Canadian Biosystems Engineering, Vol. 44, No. 6, 2002, pp. 6.33-6.39.
- Z. Khan and Y. Anjaneyulu, “Bioremediation of Contaminated Soil and Sediment by Composting,” Remediation Journal, Vol. 16, No. 4, pp. 109-122. doi:10.1002/rem.20105
- G. R. Lemus, A. K. Lau, R. M. R. Branion and K. V. Lo. “Bench-Scale Study of the Biodegradation of Grease Traps Sludge with Yard Trimmings or Synthetic Food Waste via Composting,” Journal of Environmental Engineering and Science, Vol. 3, No. 6, 2004, pp. 485-494. doi:10.1139/s04-020
- J. Ramaswamy, S. O. Prasher, R. M. Patel, S. A. Hussain and S. F. Barrington. “The Effect of Composting on the Degradation of a Veterinary Pharmaceutical,” Bioresource Technology, Vol. 101, No. 7, 2010, pp. 2294-2299. doi:10.1016/j.biortech.2009.10.089
- A. Kumar, S. Gaind and L. Nain, “Evaluation of Thermophilic Fungal Consortium for Paddy Straw Composting,” Biodegradation, Vol. 19, No. 3, 2008, pp. 395-402. doi:10.1007/s10532-007-9145-3
- S. M. Tiquia, T. L. Richard and M. S. Honeyman, “Carbon, Nutrient, and Mass Loss during Composting,” Nutrient Cycling in Agroecosystems, Vol. 62, No. 1, 2002, pp. 15-24. doi:10.1023/A:1015137922816
- Y.-X. Chen, X.-D. Huang, Z.-Y. Han, X. Huang, B. Hub, D.-Z. Shi and W.-X. Wu, “Effects of Bamboo Charcoal and Bamboo Vinegar on Nitrogen Conservation and Heavy Metals Immobility during Pig Manure Composting,” Chemosphere, Vol. 78, No. 9, 2010, pp. 1177-1181. doi:10.1016/j.chemosphere.2009.12.029
- J. Y. Wang, O. Stabnikova, S. T. L. Tay, V. Ivanov and J. H. Tay, “Intensive Composting of Sewage Sludge and Food Waste by Bacillus thermoamylovorans,” World Journal of Microbiology and Biotechnology, Vol. 19, No. 4, pp. 427-432. doi:10.1023/A:1023933212654
- P. L. Bishop and C. Godfrey, “Nitrogen Variations during Sludge Composting,” BioCycle, Vol. 24, 1983, pp. 34-39.
- S. M. Tiquia and N. F. Y. Tam, “Fate of Nitrogen during Composting of Chicken Litter,” Environmental Pollution, Vol. 110, No. 3, 2000, pp. 535-541. doi:10.1016/S0269-7491(99)00319-X
- N. Morisaki, C. G. Phae, K. Nakasaki, M. Shoda and H. Kubota, Nitrogen Transformation during Thermophilic Composting,” Journal of Fermentation and Bioengineering, Vol. 67, No. 1, 1989, pp. 57-61. doi:10.1016/0922-338X(89)90087-1
- S. Sadaka and A. El-Taweel, “Effects of Aeration and C:N Ratio on Household Waste Composting in Egypt,” Compost Science and Utilization, Vol. 11, No. 1, pp. 36- 40.
- Q. Li, B. Lv and H. Wang, “Influence of C/N Ratio on Nitrogen Changing during Composting,” Bioinformatics and Biomedical Engineering, Vol. 1, No. 4, 2010.
- G. P. Prpich, R. L. Adams and A. J. Daugulis, “Ex Situ Bioremediation of Phenolic Contaminated Soil Using Polymer Beads,” Biotechnology Letters, Vol. 28, No. 24, 2006, pp. 2027-2031. doi:10.1007/s10529-006-9189-1
- M. Petre, G. Zarnea, P. Adrian and E. Gheorghiu, “Biodegradation and Bioconversion of Cellulose Wastes Using Bacterial and Fungal Cells Immobilized in Radiopolymerized Hydrogels,” Resources, Conservation and Recycling, Vol. 27, No. 4, pp. 309-332. doi:10.1016/S0921-3449(99)00028-2
- [61] D. L. Crawford, “Cultural, Morphological, and Physiological Characteristics of Thermomonospora fusca (Strain 190Th),” Canadian Journal of Microbiology, Vol. 21, No. 11, pp. 1842-1848. doi:10.1139/m75-267
- [62] J. G. Shi, G. M. Zeng, X. Z. Yuan, F. Dai, J. Liu and X. H. Wu, “The Stimulatory Effects of Surfactants on Composting of Waste Rich in Cellulose,” World Journal of Microbiology and Biotechnology, Vol. 22, No. 11, 2006, pp. 1121-1127. doi:10.1007/s11274-006-9152-2
- [63] D. A. Iannotti, M. E. Grebus, B. L. Toth, L. V. Madden and H. A. J. Hoitink, “Oxygen Respirometry to Assess Stability and Maturity of Composted Municipal Solid Waste,” Journal of Environmental Quality, Vol. 23, No. 6, 1994, pp. 1177-1183. doi:10.2134/jeq1994.00472425002300060007x
- [64] L. Wu, L. Q. Ma and G. A. Martinez, “Comparison of Methods for Evaluating Stability and Maturity of Biosolids Compost,” Journal of Environmental Quality, Vol. 29, No. 2, 2000, pp. 424-429. doi:10.2134/jeq2000.00472425002900020008x
- [65] J. I. Boulter-Bitzer, T. Trevors and G. J. Boland, “A Polyphasic Approach for Assessing Maturity and Stability in Compost Intended for Suppression of Plant Pathogens,” Applied Soil Ecology, Vol. 34, No, 1, 2006, pp. 65-81. doi:10.1016/j.apsoil.2005.12.007