Energy and Power Engineering
Vol.5 No.3(2013), Article ID:31389,9 pages DOI:10.4236/epe.2013.53028
Contribution of the Energy Sector towards Global Warming in Malawi
1School of Environmental Studies, China University of Geosciences, Wuhan, China
2School of Economics and Management, China University of Geosciences, Wuhan, China
Email: pengwy@yahoo.cn
Copyright © 2013 Gregory E. T. Gamula et al. This is an open access article distributed under the Creative Commons Attribution License, which permits unrestricted use, distribution, and reproduction in any medium, provided the original work is properly cited.
Received March 24, 2013; revised April 26, 2013; accepted May 10, 2013
Keywords: Energy Demand; Energy Development Strategies; Scenarios; Emissions
ABSTRACT
This paper presents the energy demand projection for Malawi considering implementation of two energy development strategies. The strategies are Malawi Biomass Energy Strategy (BEST) and Malawi electricity investment plan. Longrange Energy Alternatives Planning System (LEAP) software was used as the simulation tool. Environmental effects of the energy sector towards global warming by the energy sector as a result of implementing the strategies have been investigated. Three scenarios were developed, the first one to reflect on business as usual, the second one depicting implementation of Malawi BEST and the third one depicting implementation of the Malawi Electricity Investment Plan. A fourth scenario was developed to depict implementation of both strategies. 2008 was used as the base year with energy mix of consisting of biomass consumption decrease in all the scenarios due to better efficiency in the utilization of biomass and change in life style by people as a direct response to available energy alternatives. Implementing both the Malawi BEST and Malawi Electricity Investment Plan for energy sector development would be better in terms of both energy supply and global warming effects.
1. Introduction
Energy demand projection is an important tool in having a foresight of the direction that the energy sector is headed depending on the prevailing circumstances. Development of any country depends upon a stable, sufficient and reliable energy supply to drive the different sectors that contribute towards economic development. Malawi has been facing energy supply challenges for some time and this has been one of major setbacks in attaining certain economic goals as set out in government’s agenda. Department of Energy in the Ministry of Natural Resources, Energy and Environment is responsible for energy data collection. Malawi’s energy supply is dominated by biomass, constituting 88.5% of energy supply for Malawi in 2008. Petroleum products contributed 6.4%, electricity contributed 2.8%, coal contributed 2.4% and renewable energy sources were just starting to appear in the energy mix, although as a percentage of the total energy it was still negligible. This paper looks at simulation results depicting implementation of two energy development strategies separately and also combined. Scenarios according to the strategies were developed and comparison of projected energy demand and resulting global warming effects has been made.
Energy development has been one of the government’s main priority areas in efforts to move towards better economic development. A number of government’s policies such as the Malawi Poverty Reduction Strategy (MPRS), the Malawi Growth and Development Strategy (MGDS) and Vision 2020 have energy generation and supply as a key focus area. Another area is that of environmental protection which is affected by operations in energy generation and supply. This study has been carried out to project energy demand, energy mix and resulting environmental effects as a result of implementing Malawi Biomass Energy Strategy (BEST) and Malawi Electricity Investment Plan. 2008 was chosen as the base year for simulations because data was available on energy demand by the four sub-sectors of household, industry, service and transport and also the energy mix by the various energy supply sources.
Energy transformation and energy utilization result in emission of different types of pollutants and therefore brings about the need to examine effects that energy has on the environment. Energy related activities contribute both directly and indirectly to the emission of carbon dioxide and other greenhouse gases such as methane and nitrous oxide. In 2005, the energy sector contributed about 68% of global greenhouse gases emissions [1]. Other pollutants from energy utilization and transformation are carbon monoxide, nitrogen dioxide, sulphur dioxide and particulate matter.
Malawi Energy Situation
2008 statistics indicated that about 90% of Malawi’s population used wood for firewood and charcoal production, accounting for about 88.5% of the country’s energy requirements. The balance of energy was supplied by petroleum products, electricity, and coal in the proportions of 6.4%, 2.8% and 2.4 respectively. Only a negligible 0.06% was supplied from renewable energy sources. Distribution of energy demand by sub-sectors showed that households accounted for 83% of all energy consumption, with industry accounting for 12%, transport 4% and the service sector accounting for only 1%. A majority of the population (85.7%) use paraffin in hurricane and pressure lamps for lighting, 7.2% use electricity, 2.2 use candles, 2.6% use firewood and 1.4% use other means of alternatives for lighting [2]. For cooking, 88% of the population use firewood, 8% use charcoal, 2% use electricity, 1% use paraffin and 1% use other means such as crop residues, animal dung and other sources not mentioned here.
Malawi has got a small electricity supply system of 302 MW when compared to her neighbors: Mozambique, Tanzania and Zambia whose electrical power capacities are 2483 MW, 1186 MW and 1737 MW respectively (installed capacities as of 2008) [3]. In addition to local resources, there are plans to connect Malawi to the Southern African Power Pool (SAPP) in the next few years. Electricity from photovoltaic modules is still insignificant when looking at the overall picture, but it is increasing in utilization, finding applications in households, telecommunications, lighting, refrigeration and water pumping.
Malawi has no refineries for petroleum products and therefore imports about 97% of its refined oil products. The balance is contributed by locally-produced ethanol which is sold directly to the oil companies for blending with gasoline on a maximum 20:80 ratio of ethanol:gasoline. The mixing ratio is in practice usually 12:88 because ethanol production is inadequate. The blending of ethanol and gasoline started in 1982 but has not been expanding much such that to date only a small proportion of gasoline is blended with ethanol. The internal storage capacity of oil for the country to avert supply disruptions by natural or man made emergencies is supposed to be 30 days but this is not the case on ground due to a number of economical and logistical challenges. The transport sector relies heavily on the oil imported supply which means that its pricing is heavily influenced by trends on the international oil market. Government of Malawi is undertaking oil explorations in Lake Malawi. Extensive Strategic Environmental Assessment will be carried out before any type of work can be done. The assessment will be presented to Ministry of Natural Resources, Energy and Environment for approval before exploration data acquisition can be started.
Biomass energy in Malawi is currently not sustainable which has resulted in wood resource base diminishing mainly because woodlands and trees in agricultural areas are being cleared up to start new farming land. Statistics show that between 1991 and 2008 about 669,000 hectares of woodlands were converted to farmland [4]. Diminishing standing stock is leading into gradual reduction of biomass that can be harvested. Although Malawi is heavily dependent on biomass fuels, the national energy policy has little information on biomass energy supply. There was therefore a need to look into the biomass side of energy supply which resulted into a strategy being formulated for this supply source in 2009.
Estimated coal reserves in Malawi are between 80 million tons and 1 billion tons. Quality of the coal varies with energy values ranging from 17 to 29 MJ/kg. There are four coal fields in Malawi, three in the northern part of the country and one in the southern part of the country. Currently only two fields are being mined and the coal produced from these sites is not enough to suffice the country’s industrial needs consequently the balance is imported from Mozambique. Coal is used in various industries for heating but is currently not generally used as a domestic energy supply which means that its use in households is negligible.
Malawi is endowed with a number of renewable energy resources yet utilization of these resources is still in infancy stages. There are quite high levels of solar energy in the range of 1200 W/m2 in the warm months and 900 W/m2 in the cool months which means that both photovoltaic systems and solar thermal systems perform well. There are quite a good number of areas in the country with mean wind speeds above 5 meters per second almost throughout the year which would enable the use of wind energy systems. Malawi lies along the Great Rift Valley and therefore traces of geo-thermal reservoirs have been said to exist. There have been a number of initiatives to enhance utilization of renewable energy sources in various sub-sectors.
Malawi has about 63,000 tons of proven reserves of uranium at two sites. Mining of uranium started in 2008 but currently all the uranium that is mined is exported. Energy that is currently being used in mining of uranium is supplied from generators operating on diesel.
2. Investigating Energy Development Strategies
The energy supply sector in Malawi is categorized into five key components and these are biomass supply, coal supply, electricity supply, liquid fuels and gas supply and other renewable energy sources [5]. A sixth possible component is uranium for nuclear energy supply which at the moment is being mined for export only. Only two supply sectors have well defined development strategies and these are the biomass sector and the electricity sector.
2.1. Malawi Biomass Energy Strategy (BEST), 2009
The main objective of the Malawi BEST is to ensure sustainable of woodfuel through increased supply, improved efficiency and creation of institutional capacity to manage the sector. Sustainability of supply of woodfuels would be achieved through:
Ÿ Establishing a master plan for woodfuels supply;
Ÿ Designing and implementing woodfuel management plans at district level;
Ÿ Improving charcoal flow monitoring and control;
Ÿ Promoting production of alternative fuels which are also affordable [4].
The strategy has been able to clearly define steps to be taken to improve the supply of firewood and charcoal but is vague on the other fuels in the biomass category. The strategy has mostly been dedicated to traditional utilization of biomass leaving out modern biomass applications which would have a greater impact in economic development for the country through provision of better energy forms such as electricity.
Malawi has 4 urban areas namely Blantyre and Zomba in the southern region, Lilongwe in the central region and Mzuzu in the northern region. Figure 1 shows the 4 urban centers of Malawi and the surrounding areas that form part of the catchment areas. Firewood is mainly used for cooking (about 76%), while for water heating accounts for about 22% and only about 2% is used for space heating. A high proportion (about 90%) of firewood users cook using traditional three-stone stoves with efficiencies ranging from 10 % to 14%. Most of charcoal users (over 80%) use ceramic charcoal stoves with and efficiency of about 30% while the rest use metal stoves with efficiency of about 20%.
2.2. Malawi Electricity Investment Plan, 2010
Electrical Energy Supply is provided by a government owned company called Electricity Supply Corporation of

Figure 1. A map showing the three catchment areas, covering the four main urban centers (source: Malawi BEST, 2009).
Malawi (ESCOM) Limited which was originally established by an Act of Parliament in 1957 and was revised in 1963 and then 1998. Total installed capacity of electrical power by ESCOM is about 302 MW, of which 94% is generated by hydropower and the remaining 6% is thermal. All ESCOM’s hydro generation stations except one are located in the Southern region of Malawi along Shire river and the exception is on Wovwe river in the northern region with a capacity of 4.5 MW [6]. The map of Figure 2 shows the location of all the hydro power stations in Malawi.
The current demand for electrical power is more than what is available by the installed plants. Some interventions have been planned to address the situation and these are in three categories, namely short term, medium term and long term interventions. Short term interventions have the potential of increasing the generation capacity by 234 MW while medium term interventions have a potential of adding a generation capacity of 1240 MW and long term interventions have the potential of adding a generation capacity of 770 MW.
Short term plans are those that are to be implemented within 5 years and they involve developing 3 new hydro power plants, 1 on Ruo river, 1 on Shire river and 1 on Lunyina river; also implementation of demand side Management techniques, upgrading of Nkula A power station from 24 MW to 50 MW; development of hydro matrix power plants and installation of diesel powered stand-by generators. Medium term plans are to be implemented between 5 to 10 years and involve construction of a coal fired power plant, 8 additional hydro power plants, 3 biomass fired power plants, and wind generating systems. The coal generating plant will have a capacity of
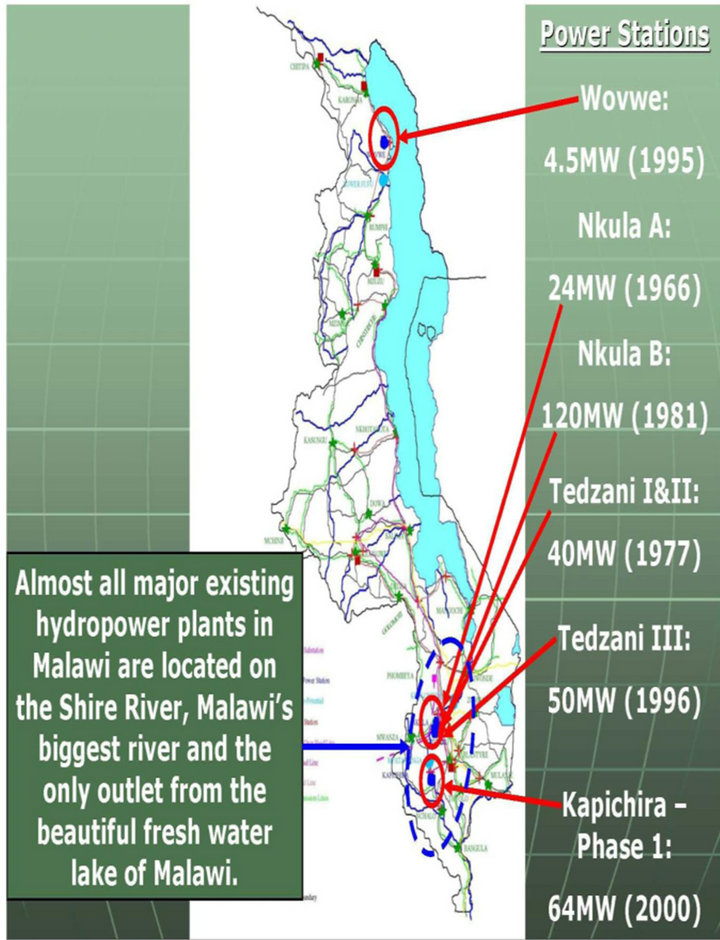
Figure 2. Location of hydro power plants in Malawi, capacity and commissioning year (source: Malawi Electricity Investment Plan, 2010).
300 MW which will require an annual coal supply of about 1 million metric tonnes. The sites for hydro power plants are: 1 site on Songwe river, 4 sites on Bua river, 1 site on Shire river at Mpatamanga, 1 site on North Rukuru river and 1 site on South Rukuru river. Long term plans are those to be implemented after 10 years and include 3 more hydro plants and a 150 MW modular nuclear power plant. Sites for the hydro power stations are on Dwambazi river, Luweya river in Nkhatabay and Kholombidzo on Shire river [7].
3. Developing Scenarios
Four scenarios were developed, energy demand projections were evaluated and the negative environmental effects were simulated. These scenarios are as follows:
• Business as usual scenario which will be used as the reference in which it will be assumed that the current trends are allowed to continue without any mitigating interventions in the energy sector and associated environment sector except those already in place.
• Biomass energy scenario in which new technologies are enhanced in the biomass energy supply sector through use of better efficiency stoves for both wood and charcoal and also use of modern biomass technologies. Developing the biomass sector in terms of better efficiency for the current wood and charcoal stoves; better forest management programs; increase the production of ethanol and other energy products from biomass like the growing of bio-energy plants; use of biogas for cooking.
• Electricity scenario which will examine a number of options which are:
¨ Developing additional hydro electrical generating power stations along rivers where previous studies have already shown that such schemes are viable;
¨ Developing thermal electrical generating plants operating on coal;
¨ Developing renewable energy technologies to generate electricity.
• Combined scenario in which both the biomass scenario and the electricity scenario are implemented.
3.1. Scenario Assumptions
Malawi had a population of 13,077,160 in 2008 and the average population growth in the previous decade was 2.8%. About 84.5% of the population in this year lived in the rural areas. The population growth rate projections are slightly lower [8] which led to the use of an average annual growth rate of 2.6% for the simulations. From 1988 to 2008, the average annual growth rate for GDP was 3.7 but looking at the later years the GDP growth rate was as shown in Figure 3 [9].
Ÿ 3.2. Key Assumptions in LEAP
Ÿ Population for the country is 13.1 million.
Ÿ Population growth rate is 2.5%.
Ÿ Average household size is 4.57.
Ÿ Income per capita is USD 800.
Ÿ Average annual GDP growth rate is 3.5%.
Ÿ Current urbanization is 15.5% and end year urbanization is 40%.
Ÿ End year of simulation is 2050.
These are common for all the scenarios under consideration. Energy data collection is done by the Department of Energy in the Ministry of Natural Resources, Energy and Environment [5]. Department of Energy coordinates with Malawi Energy Regulatory Authority (MERA), ESCOM and Petroleum Importers Limited (PIL) for demand details in the respective supply industries. Energy demand in various sub-sectors for energy utilization in 2008 is given in Table 1 in which energy demand is grouped according to fuel type. This is the information that was used for the base year energy demand when doing simulation.
4. Demand Projections Results
The results of energy demand projections after simulations for the four different scenarios are shown in Figure 4, while the actual values of energy demand are as given in Table 2.
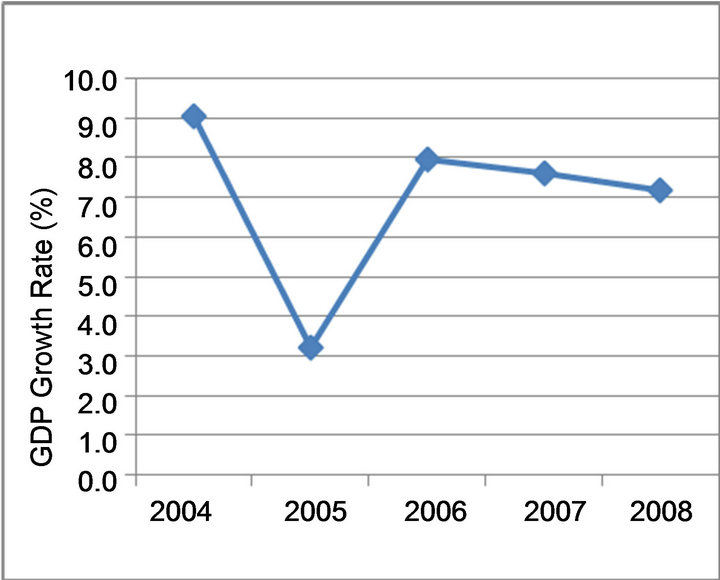
Figure 3. Annual GDP growth rate from 2004 to 2008.

Table 1. Total energy demand in sub-sectors by fuel type in Malawi in 2008 (Adapted from Malawi Biomass Energy Strategy, 2009).
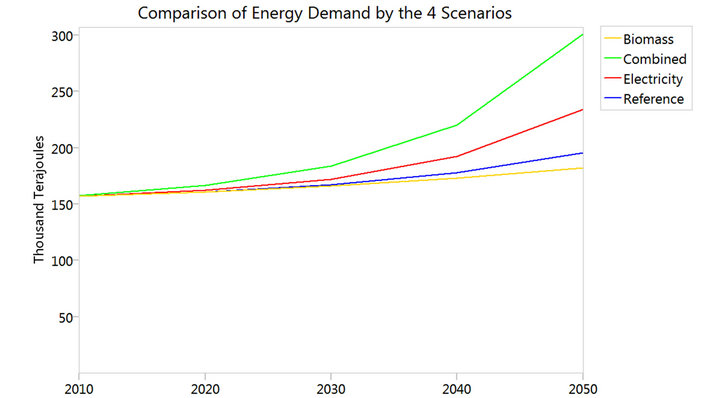
Figure 4. A graph showing energy demand projections comparing the four scenarios.
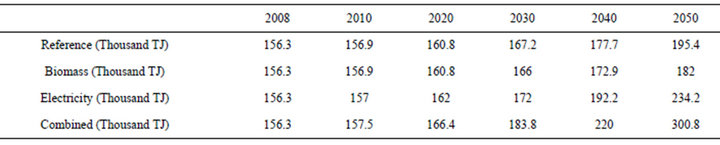
Table 2. Comparison of demand projections for the four scenarios.
It can be observed that Biomass scenario has the lowest energy demand projections followed by the reference scenario then Electricity scenario while the combined scenario has the highest energy demand projections.
5. Greenhouse Gases (GHGs) Emissions
The GHGs that are considered in this study are carbon dioxide (CO2), methane (CH4) and nitrous oxide (N2O). LEAP software divides GHGs emissions into two: emissions due to energy utilization and emissions due to transformation of energy from one form into another. Combination of the two components gives us the overall emissions. Figures 5-8 show us the emissions trend for each one of the GHGs considering each scenario in thousand metric tonnes CO2 equivalent. These figures were done using Microsoft Office Excel from the results that were imported from LEAP software. Total GHGs emission for Malawi in 2008 was 6,900 thousand metric tonnes CO2 equivalent, [10] of this 2,025,500 tonnes was from the energy sector.
All the figures have a common trend in which there is a rapid increase of carbon dioxide emissions, a decrease in methane emissions and a slight decrease of nitrous oxide emissions. In reference scenario, carbon dioxide increased from 769.3 in 2008 to 5860.6 thousand metric tonnes in 2050; methane decreased from 1060 in 2008 to 892.7 thousand metric tonnes in 2050 and nitrous oxide remained almost constant, 196.1 in 2008 and 204.5 thousand metric tonnes in 2050. In biomass scenario, carbon dioxide increased from 769.3 in 2008 to 5,932.3 thousand metric tonnes in 2050; methane decreased from 1060 in 2008 to 831 thousand metric tonnes in 2050 and nitrous oxide remained almost constant, 196.1 in 2008 and 187.9 thousand metric tonnes in 2050. In electricity scenario, carbon dioxide increased from 769.3 in 2008 to 10,319.9 thousand metric tonnes in 2050; methane decreased from 1060 in 2008 to 720.9 thousand metric tonnes in 2050 and nitrous oxide remained almost constant, 196.1 in 2008 and 185.4 thousand metric tonnes in 2050. In combined scenario, carbon dioxide increased from 769.3 in 2008 to 10533.9 thousand metric tonnes in 2050; methane decreased from 1060 in 2008 to 577.6 thousand metric tonnes in 2050 and nitrous oxide remained almost constant, decreasing slightly from 196.1
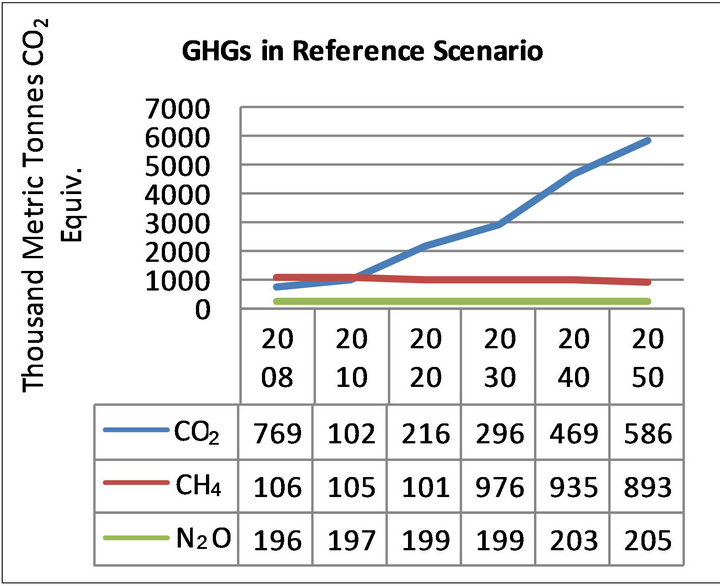
Figure 5. GHGs emissions in reference scenario.
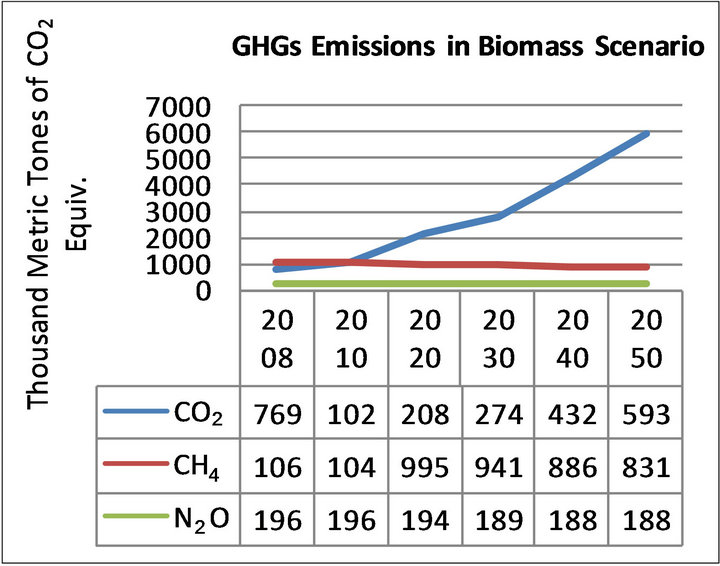
Figure 6. GHGs emissions in biomass scenario.

Figure 7. GHGs emissions in electricity scenario.
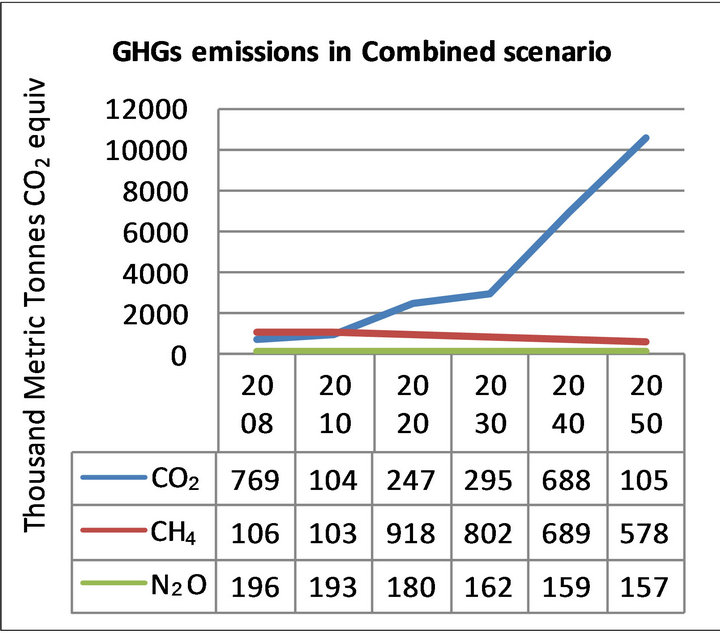
Figure 8. GHGs emissions in combined scenario.
in 2008 to 156.7 thousand metric tonnes in 2050.
The overall GHGs emissions have been expressed in CO2 equivalent and the results for all the scenarios are as shown in Figure 9 as global warming potential by each one of the scenarios.
It can be observed when looking at Table 2 that the scenarios reference, biomass, electricity and combined registered increases of 25%, 16.4%, 49.8% and 92.5% in energy demand respectively. In the final year of simulation, energy demand and energy mix are as shown in Tables 3-6 for all scenarios.
6. Conclusion
Implementing both the Malawi BEST and Malawi Electricity Investment Plan would be the best course of action
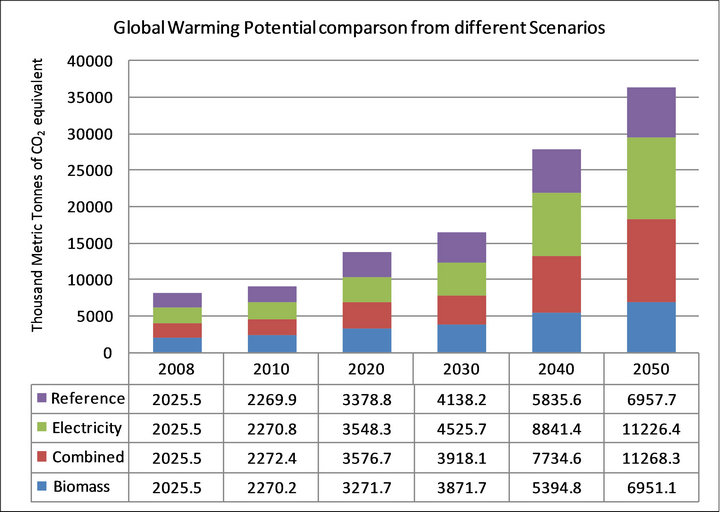
Figure 9. Comparison of GHGs emissions considered in the study in CO2 equivalent.

Table 3. Summary of energy demand by sub-sector and energy mix for the reference scenario in 2050.
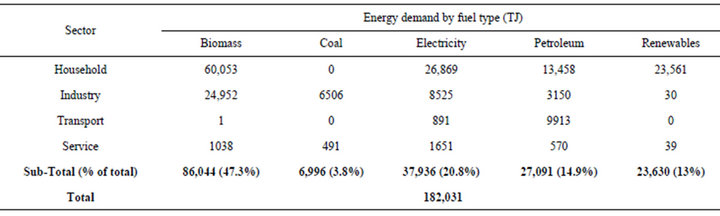
Table 4. Summary of energy demand by sub-sector and energy mix for the biomass scenario in 2050.
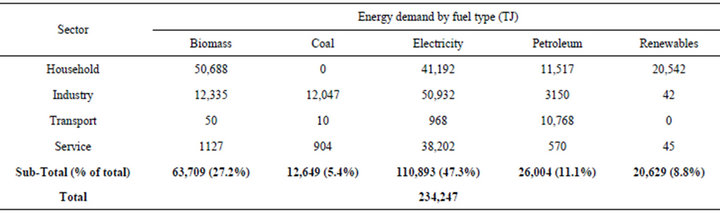
Table 5. Summary of energy demand by sub-sector and energy mix for the electricity scenario in 2050.

Table 6. Summary of energy demand by sub-sector and energy mix for the combined scenario in 2050.
for the country because it offers the highest supply of energy to meet the demand. It has the advantage of increasing electrical energy supply as well as making biomass energy sustainable. Implementing only the Malawi BEST on its own would be the worst even when comparing to business as usual scenario. This is so because the strategy concentrates on traditional use of biomass hence electrical power supply ends up being minimal. The way to make this strategy better is to include modern use of biomass including bio-energy. Combined scenario has the highest global warming potential but it is only a little higher than the electricity scenario. Looking at the increase in projected demand, it can be seen that scenarios reference, biomass, electricity and combined registered increases of 25%, 16.4%, 49.8% and 92.5% in energy demand respectively. Implementing both the Malawi BEST and Malawi Electricity Investment Plan would be the best since this combination almost doubles the energy demand, yet the global warming effect is not much different from that of implementing only the Malawi Electricity Investment Plan. Nuclear power supply has not been included in the simulations because uranium reserves in the country have not been fully ascertained and there is a need to verify that there would still be enough reserves to support a nuclear power plant towards the end of the simulation period.
REFERENCES
- T. Nakata, D. Silva and M. Rodionov, “Application of Energy System Models for Designing a Low-Carbon Society,” Progress in Energy and Combustion Science, Vol. 8, No. 2, 2010, pp. 1-41.
- Malawi Government, Census Main Report, National Statistical Office, Zomba, 2009.
- http://www.sapp.co.zw/docs/
- Malawi Government, “Malawi Biomass Energy Strategy,” Ministry of Natural Resources, Energy and Environment, Lilongwe, 2009.
- Malawi Government, “National Energy Policy,” Department of Energy Affairs, Lilongwe, 2003.
- Escom & Electricity, Power Generation. http://www.escom.mw
- Malawi Government, “Malawi Electricity Investment Plan,” Ministry of Natural Resources, Energy and Environment, Lilongwe, 2010.
- Malawi Government, “Population Projections of Malawi,” National Statistical Office, Zomba, 2009.
- Malawi Government, “Annual Economic Report,” Ministry of Economic Planning and Development, Lilongwe, 2009.
- Millenium Development Goals Indicators. http://mdgs.un.org/unsd/mdg/SeriesDetail.aspx?srid=749