Journal of Water Resource and Protection
Vol.2 No.5(2010), Article ID:1802,11 pages DOI:10.4236/jwarp.2010.25055
BOD Exertion and OD600 Measurements in Presence of Heavy Metal Ions Using Microbes from Dairy Wastewater as a Seed
School of Chemistry & Biochemistry Thapar University, Patiala, India
E-mail: smittal@thapar.edu
Received October 12, 2009; revised December 3, 2009; accepted January 20, 2010
Keywords: BOD inhibition, metal ions, OD600, microbes, dairy wastewater
ABSTRACT
BOD measurements in presence of cobalt, nickel, copper, zinc, silver and cadmium are reported using wastewater from dairy industry as a seed. Extent of inhibition in BOD is studied for variables like, concentration of metal ions (0.2 mM to 1.4 mM), pH (3 to 8) and temperature of incubation (15℃, 20℃, 25℃, 30℃ and 35℃). Results of BOD inhibition are supported by absorbance measurement (OD600) studies of microbial matter preserved in Luriya broth medium. OD measurement results are used to derive minimum inhibitory concentration, i.e., threshold concentration of each metal showing toxicity towards microbes. Silver is found to be the most toxic element.
1. Introduction
In the normal BOD measurement process, microbial matter is taken from some source that is known to be rich in bacteria and capable of undergoing BOD exertion process. It was thought that the quality of seed is not very important as regards the magnitude of BOD. But recently, it has been established that the type of inoculum becomes more important [1,2] for a study where BOD exertion is measured at different concentrations of the heavy metal ions.
Ignorance of the effect of heavy metal ions could result in significant error in BOD measurement [3-7]. BOD biosensors generally use living microorganisms as the biosensing component and are sensitive to the presence of heavy metal ions. Many environmental factors influence or repress the operation of BOD. The important factors are temperature [8], pH [9], chloride [10], nitrates [11], pharmaceutical wastes [12] and organic pollutants in the biological systems.
Transition metals like copper and zinc which are essential for the growth at trace concentration become toxic at higher concentration till the living cell develops heavy metal resistance. Through one of the probable mechanisms, heavy metals are transported across the cell membrane of the microbe and tend to impair the biochemical process responsible for the exertion of BOD. These metals are generally transition elements and have unfilled d-orbitals, which help the metal ions to complex with chelating molecules like enzymes proteins and amino acids. These complexes are not redox active; hence, heavy metal ions whenever present in biochemical system play an important role [13]. At higher concentration, these metal ions become toxic towards physiological functions.
In the dairy industry, large amounts of lactic acid bacteria are involved in the daily manufacturing of fermented milk products such as cheese, butter, etc. Strains belonging to the species Lactococcus lactis are the most important organisms in the manufacture of these products at moderate temperatures [14]. Large-scale industrial processes rely on the use of starter cultures that have been selected for their performance during milk fermentation and product formation [15]. As a result, the variability among strains used in industrial dairy fermentations is low [16]. Common problem-causing bacteria in the dairy industry are: Streptococcus agalacite and other streptococci, coliformic bacteria, Pseudomonas spp. and corynebacterium pyogenes. Staphylococcus aures, Bacillus cerus, Listeria monocytogenes, etc. are all bacterial pathogens of concern in raw milk and other dairy products and are likely to be present in the effluent generating from the industry. These microorganisms understandably receive much attention from scientific community [17].
In our investigations, effect of metals like cobalt, nickel, copper, zinc, silver and cadmium on BOD3 has been studied using wastewater from dairy industry as a seed. They were selected for experimentation because of their widespread industrial use and known toxicity to aquatic organisms. Optical density (OD) measurements were made for the microbial matter in presence of different concentrations of the metal ions.
2. Materials and Methods
2.1. Methodology and Test Set-up
BOD3: BOD is determined after 3 days incubation of the microbes at 27℃. This gives the amount of oxygen used up for biochemical degradation of organic material (Carbonaceous demand) when the sample is kept in the dark. Light must be kept out of the bottle to keep algae from adding oxygen by photosynthesis. The BOD bottle is kept closed with a stopper to avoid air from replenishing DO that has been removed by biodegradation of the organic contaminant in the sample. Only 3-day BOD at 27℃ (BOD3) is used for carrying out the studies instead of 5-day BOD at 20℃ (BOD5) as the study is carried out on synthetic samples and is of comparative nature.
Seed: Mixed flora from dairy was derived and incubated at 37℃ separately for 24 hours and developed in the Luriya medium and was used as a “seed”. During digestion process, more and more waste water from the dairy industry was added to the concentrated waste being digested so as to grow the bacteria, which could become acclimatized thoroughly in the wastewater environment. The microbiology of the digested sample was done to locate different colonies of bacteria present in the sample. A sample is taken and grown separately in Luriya medium and then used as a seed. BOD of seeding material was measured and dilution was made so that its DO uptake could come between 0.6 mg/L to 1.25 mg/L.
Sampling and Storage: Synthetic samples were prepared by using glucose and glutamic acid mixture of fixed concentration ratio (1:1) in distilled water and were used as a substrate. Samples from waste streams were not used because they might vary in composition, hence; synthetic samples were used throughout the study. Samples were stored at 4℃ and were equilibrated to 27℃ before use.
2.2. Equipment
BOD Incubation and Bottles: BOD incubator (Indian Equipment Co., Mumbai) thermostatically controlled at 27 ± 0.3℃ was used for the tests. 300 mL capacity amber glass bottles were cleaned with chromic acid, washed thoroughly with tap water followed by rinsing with distilled water and dried before use. As a precaution against drawing air from the atmosphere in the dilution bottle during incubation, a water seal was used. A foil cap was placed over the flared mouth of bottle to reduce evaporation of water seal during incubation.
Spectrophotometer: Spectrophotometer (U2800, Hitachi) has been used for measurement of optical density at 600 nm.
2.3. Procedure
Preparation of Dilution Water: Added 1 mL/L each of phosphate buffer, MgSO4, CaCl2 and FeCl3 solutions to a desired volume of seeded dilution water. Solutions were prepared according to the procedure of standard methods [18]. Chemicals of AR grade were used. Dilution water saturated with dissolved oxygen (DO) by aerators for 4-5 hours was brought to 27℃ before use.
Substrate: Glucose-Glutamic acid (GGA), a mixture of 300 mg/L glucose and 300 mg/L glutamic acid was used as a substrate. Glucose has an exceptionally high and variable oxidation rate but when it is used with glutamic acid, the oxidation rate is stabilized. Concentration of commercial mixtures was adjusted to 5 mL/L in each GGA test bottle. The standard BOD value for a GGA system is 396 ± 30 mg/L [18].
Preparation of Metal Ion Solutions: Metals selected for the study were cobalt, nickel, copper, zinc, silver and cadmium. Appropriate amounts of nitrate salts of these metals were dissolved in distilled water and diluted to 100mL to prepare 2M stock solution of each metal ion.
Estimation of BOD: A known quantity of stock solution of metal ion was added in each set of bottles so as to get a concentration range from 0.2 mM to 14.0 mM. Separate tests were performed to find BOD for each set of concentrations of a given metal ion.
5 mL of synthetic wastewater sample and a known quantity of metal ion solution were added in distilled water and diluted to one litre. BOD bottle had a capacity of 300 mL and three bottles were arranged in each set. All bottles were filled carefully with seeded dilution water to the top of brim, allowing overflowing for the removal of any air bubble. Initial DO of first bottle of each set was taken and remaining two bottles were capped, water sealed and incubated for three days at 27℃ in a BOD incubator. After three days of incubation, final DO of the samples were determined.
Estimation of Dissolved Oxygen & Calculations: Initial and final DO were determined by using Dissolved Oxygen Meter (ORION, Model 805 with DO Probe 080510). BOD3 values were calculated using the following equation and results are used to find change in BOD (increase/ inhibition) given in Table 3.
BOD3 (mgL-1) =
whereD1 = DO of diluted sample immediately after preparation, mgL-1
D2 = DO of diluted sample after 3 day incubation at 27℃, mgL-1
B1 = DO of seed control before incubation, mg∙L-1
B2 = DO of seed control after incubation, mg∙L-1.
Here, Df =100, (1% of substrate).
Seed corrections were applied to all the observations.
Estimation of OD Measurement: The isolated mixed flora from the waste water from a dairy industry was grown in luriya broth in the absence/presence of different concentrations of each one of the cobalt, nickel, copper, zinc, silver and cadmium metal ions. The aqueous medium was maintained at 37℃ on shaker incubator set at 120 rpm. OD of the developed microbial mass was measured with the help of spectrophotometer at 600 nm after 24 hours.
3. Results and Discussions
3.1. Optical Density Measurements
Experiments were conducted to measure optical density of microbial medium containing different concentrations of each metal ion. Microbes show greater optical density in the absence of metal ions while in presence of the metal ions, there is a fall in the absorbance value (Table 1). The extent of fall depends on the concentration of the metal ions added [19]. Results of optical density measurement for each metal ion are also shown in Figures 1 to 6 by taking the extreme right axis as the origin of plots.
In most of figures, absorbance value corresponds to the relative change in BOD. This indicates that the inhibition in BOD is due to the decay of microbial matter. This hypothesis works very well for almost all metal environments [20]. It clearly rules out the possibility of any other factor like metal oxidation, etc. playing any role in BOD suppression process. Hence, the extent of BOD suppression/increase is directly related to the decay/growth of the microbial matter. In case of copper, the correspondence of BOD suppression to increase in optical density value is erratic which probably is due to the reason that pH changes go uncontrolled with change in metal ion concentration for this metal ion. Buffers were not used to control the pH as they would have influenced the BOD exertion in their own way. For all other metal ions, there is no appreciable pH change of the resulting solution, because copper salts are known to be strongly acidic.
The relatively poor toxic behavior of zinc among all other transition metal ions (Table 1) is due to the reason that it does not undergo redox changes under biological conditions because of its completely filled 3d-subshell. Rather, it acts as a Lewis base in complexation with polypepetide chain [21]. Cadmium is more toxic than zinc [22] because the solubility product of CdS is 1.4 × 10⁻²⁹ while that of ZnS is 2.91 × 10⁻²⁵. Mechanisms of cadmium toxicity in microorganisms are still not well defined. It is reported in literature that microorganisms commonly found in dairy waste do not survive after certain concentration. The levels of concentration for different metal ions are different and are known as ‘Minimal Inhibitory Concentration’ (MIC). The respective values of MIC for the selected metal ions are shown in Table 2. From the table showing OD measurement for different metal ions at different concentration ranging from 0.2 to 7.5 mM, it is shown that absorbance values decrease sharply in the initial concentration range upto a value identified here as the MIC value (Table 2). After further increase in metal ion concentration, the OD decreases very sharply to almost zero value. This is true for cobalt, silver and cadmium. The very low MIC values (cobalt 1.4 mM, silver 0.2 mM, cadmium 0.8 mM) for these metal ions are observed. For other metal ions i.e. nickel, copper and zinc, the sharp fall in absorbance occurs at metal ion concentrations: 6.0 mM, 4.5 mM and 4.5 mM, respectively. On the molecular level, the cadmium uptake is hardly understood. In general, cadmium enters the cell only by some indirect means of transportation. (manganese uptake system [23-25] and calcium uptake system [26]). There are reports where resistance to cadmium in bacteria is noticed [27]. In our observation also, some degree of resistance to cadmium toxicity is noticed. Plots of absorbance values were drawn as a function of concentration of metal ions and are shown in Figures 1 to 6. The optical density variation exactly correspond the change in BOD values measured independently in separate set of experiments. These BOD values have been plotted in the same figures for the purpose of easy comparison with OD measurement results.
3.2. BOD Measurements
Experiments were conducted to determine BOD in the presence of some identified heavy metal ions, i.e., cobalt, nickel, copper, zinc, silver and cadmium. Metal ions were taken in a wide concentration range from 0.2 mM to 10.0 mM to study their effect at different levels of concentrations. Mixed flora from dairy industry derived
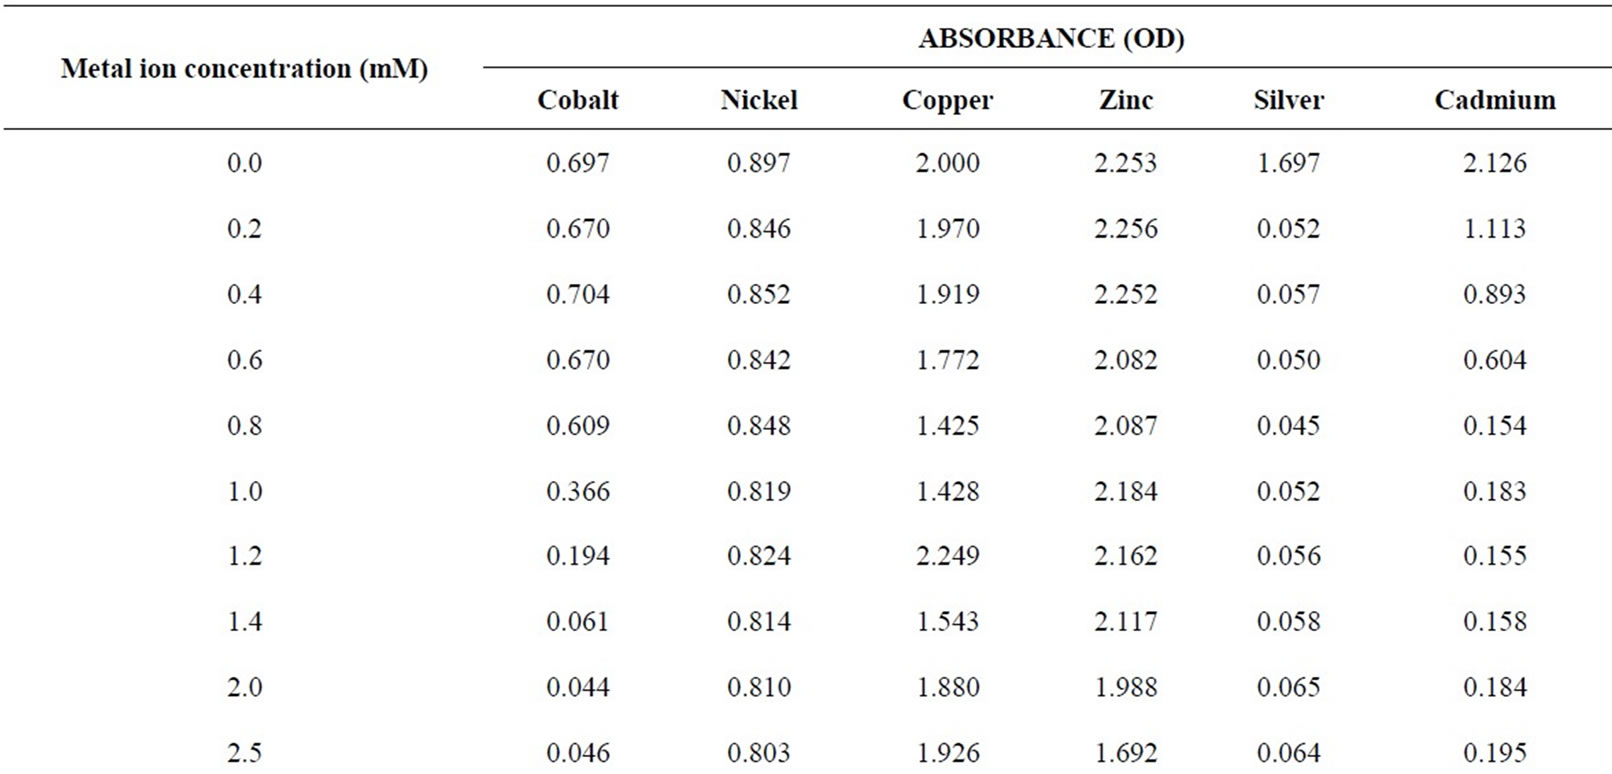

Table 1. Optical density measurements for the growth of Dairy microbes from dairy wastewater in presence/absence of different metal ions.
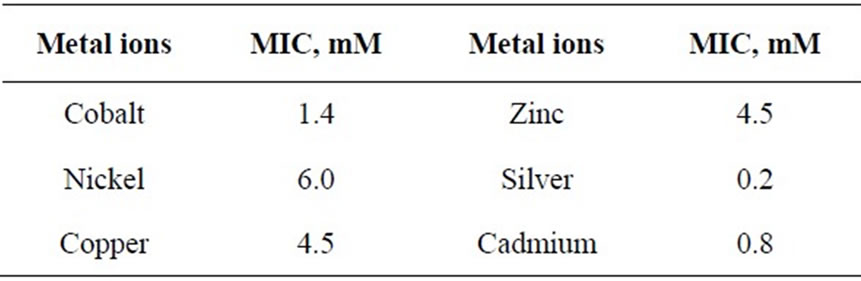
Table 2. Minimal inhibitory concentration (MIC) of some heavy metal ions in Dairy microbes from dairy wastewater.
and incubated at 37℃ for 24 hours was used as ‘seed’. A standard mixture of Glucose and glutamic acid was taken as food. Industrial wastewater was not used as source of food simply to avoid any inconsistency in the composition of the sample water.
BOD values were determined in replicas of three bottles for each metal ion concentration and by measuring DO levels using membrane based DO meter. Only average values were taken for further calculations. The observed BOD values were compared with the blank sample (containing no metal ion) and the difference is calculated and reported as percentage change in BOD corresponding to each metal ion in Table 3. It can be seen that a decrease in BOD is noticed in presence of each of the metal ion. For most of the metal ions, the concentration level upto 1.2 mM is good enough to inhibit 100% BOD. However, the presence of zinc ions at these levels results in a fall in BOD to the extent 5 to 6% only. Even at a large concentration (10.0 mM) of zinc ions, the fall in BOD is upto 40%. For cobalt, nickel and cadmium, trends in fall in BOD are similar, i.e., a sharp fall even in the presence of small amount of the metal ion upto 1.0 mM. In the presence of copper ions, the inhibition effect is irregular with increasing concentration of the metal ion, but becomes constant after 1.2 mM concentration.
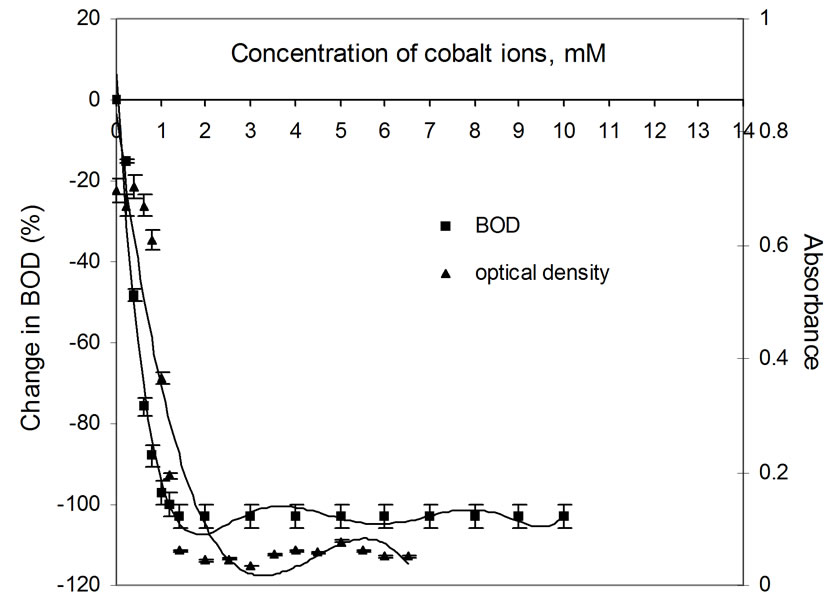
Figure 1. Plots of change in BOD3 (%) and absorbance (OD) as a function of concentration of Co(II) ions using dairy microbes as a seed.
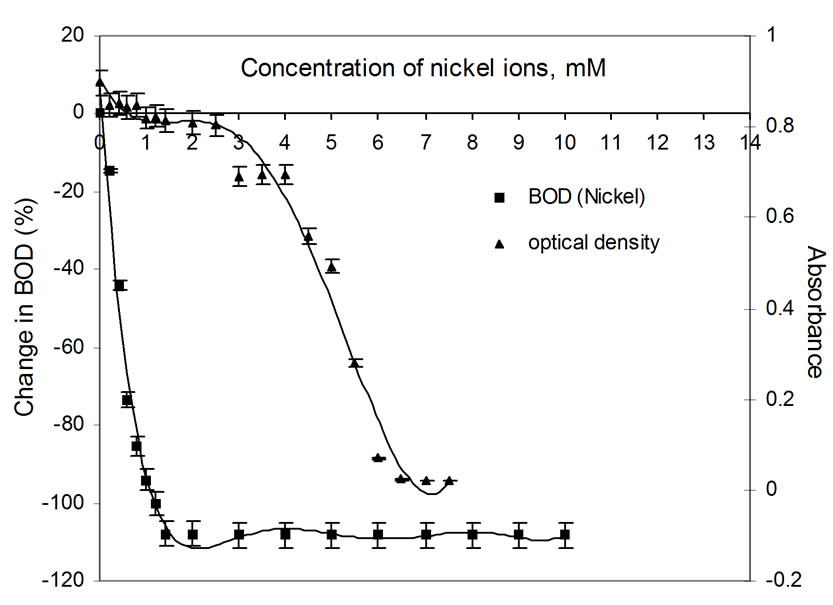
Figure 2. Plots of change in BOD3 (%) and absorbance (OD) as a function of concentration of Ni(II) ions using dairy microbes as a seed.
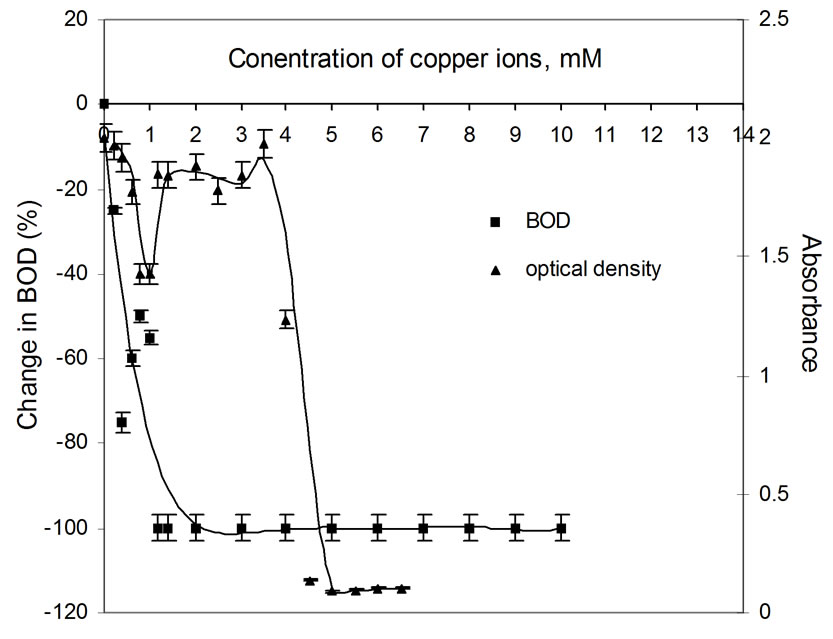
Figure 3. Plots of change in BOD3 (%) and absorbance (OD) as a function of concentration of Cu(II) ions using dairy microbes as a seed the metal ion, but becomes constant after 1.2 mM concentration.
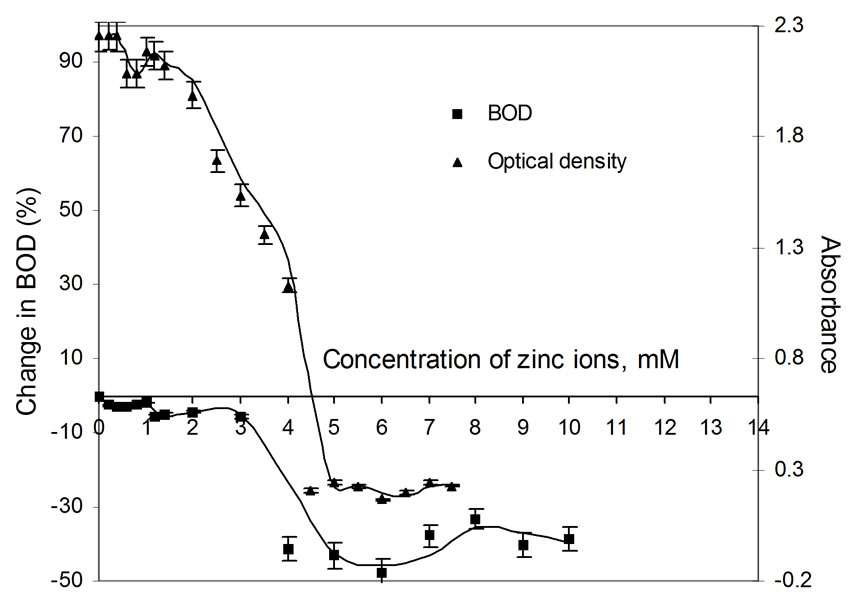
Figure 4. Plots of change in BOD3 (%) and absorbance (OD) as a function of concentration of Zn(II) ions using dairy microbes as a seed.
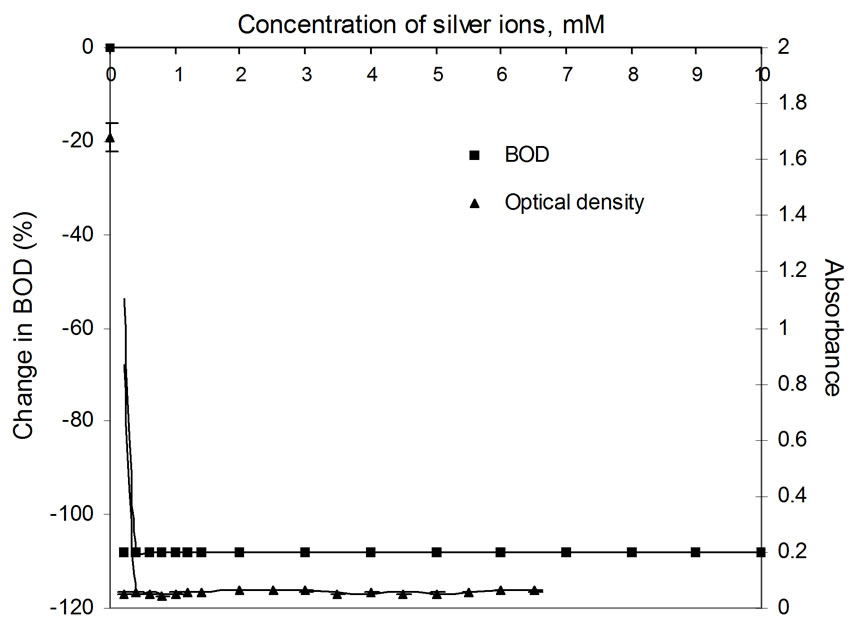
Figure 5. Plots of change in BOD3 (%) and absorbance (OD) as a function of concentration of Ag(I) ions using dairy microbes as a seed.
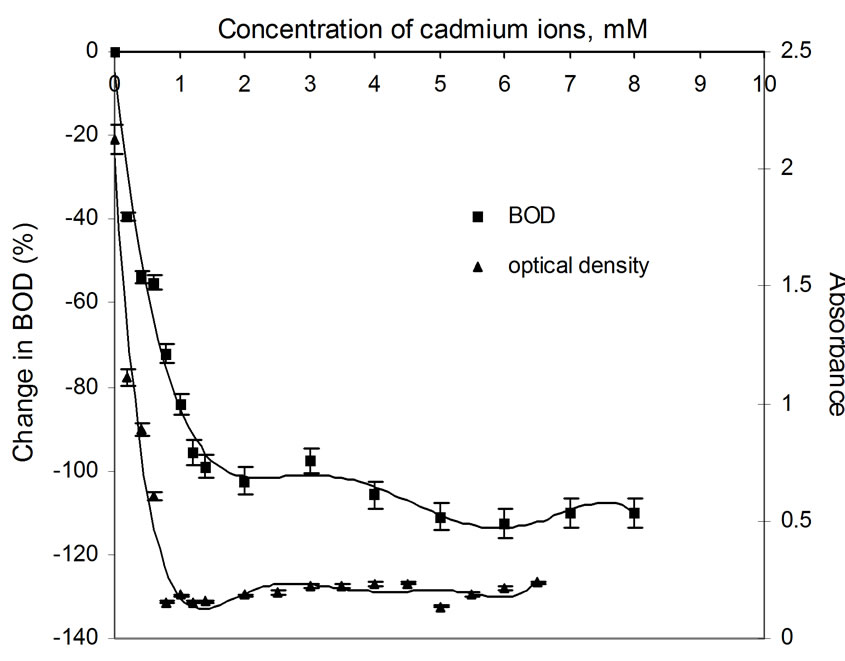
Figure 6. Plots of change in BOD3 (%) and absorbance (OD) as a function of concentration of Cd(II) ions using dairy microbes as a seed.
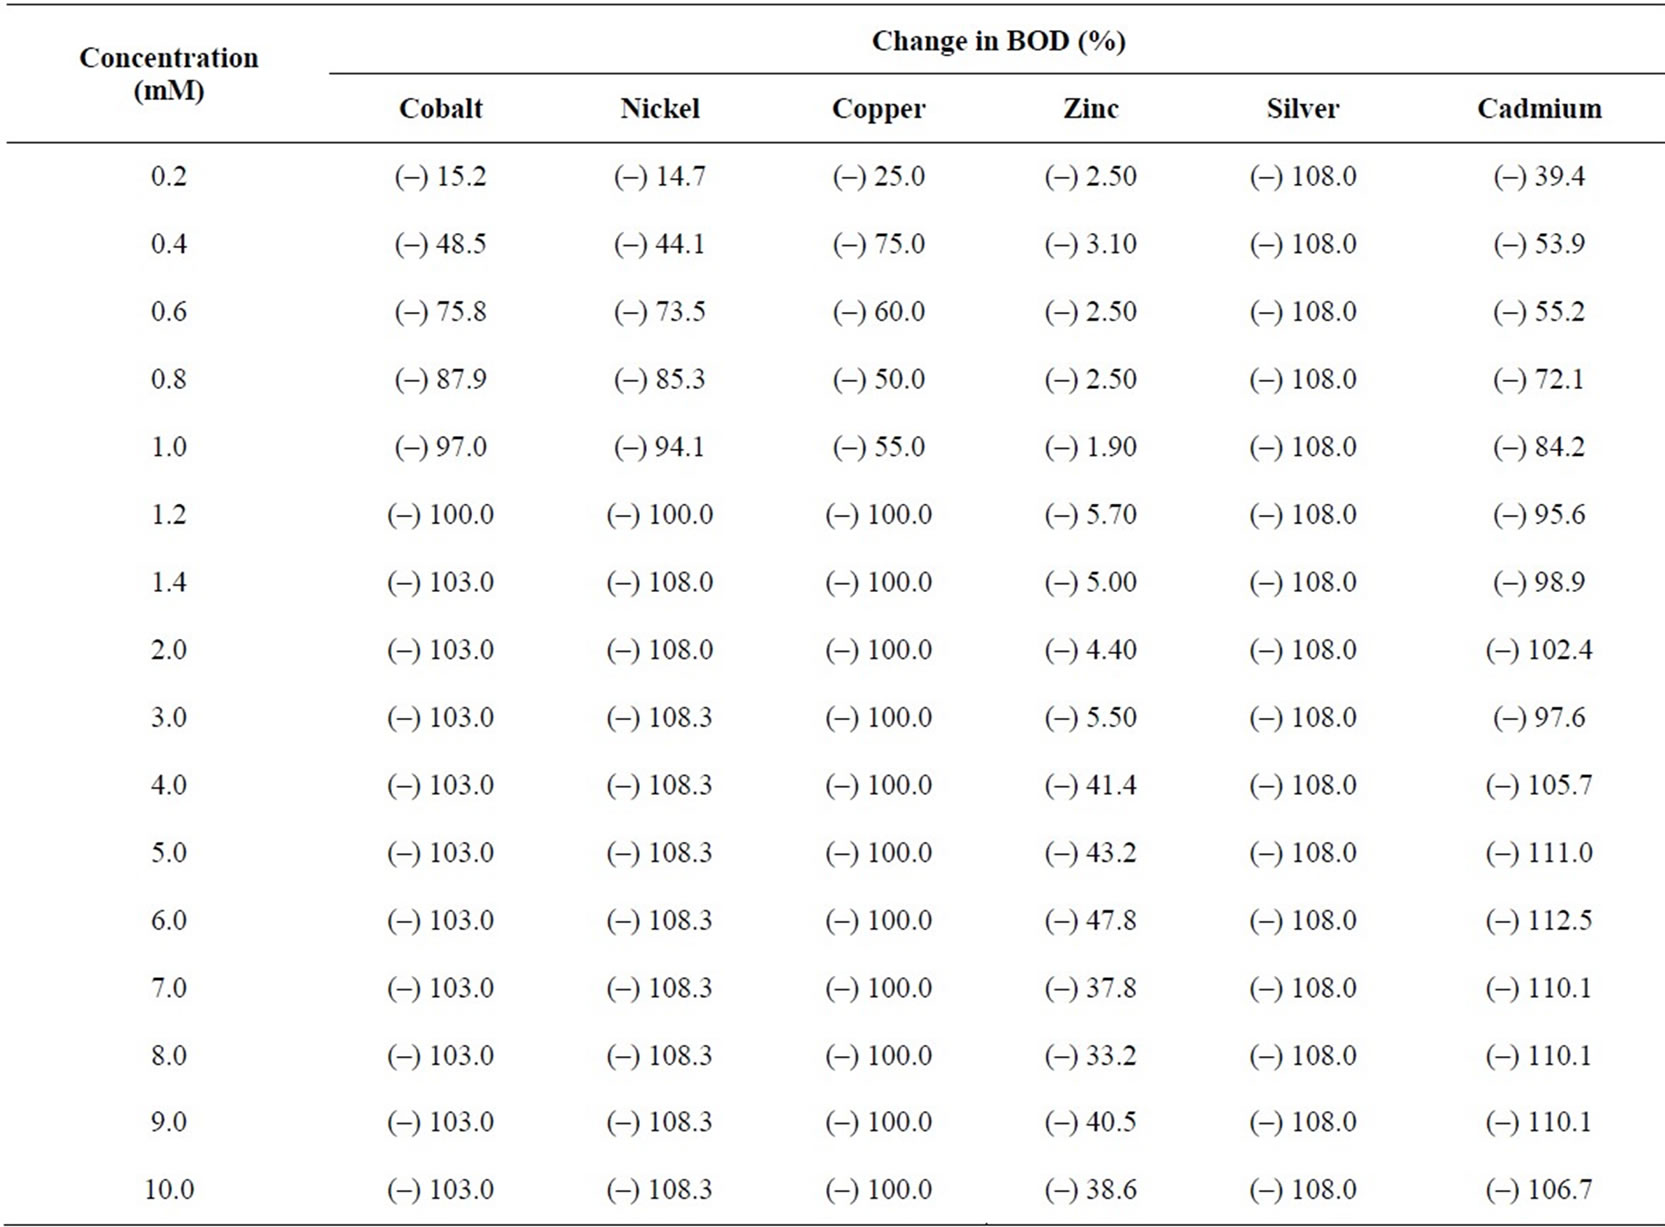
Table 3. BOD3 inhibition (%) using seed from Dairy microbes from dairy wastewater in the presence of metal ions at different concentrations.
Percentage change in BOD is plotted as a function of concentration of metal ion. The shapes of the curves are shown in Figures 1 to 6. The presence of silver ions results in a sharp fall (100 percent) in BOD even in the presence of the smallest amount of the metal ion, i.e., 0.2 mM. The extraordinary toxicity with silver, as observed in Figure 5 is due to the following reason: when in contact with any heavy metal like Ag+, Hg2+ and Cd2+, the microbial cell allows transportation of the heavy metal ions across the cell wall into the cytoplasm. Once inside the cell, these ions tend to bind to -SH groups, resulting in inhibiting the activity of the sensitive enzyme. Since Ag+ forms the most stable precipitate of Ag2S (Ksp = Ag2S is 6.62 × 10-50) as compared to that of CuS (Ksp = 1.28 × 10-36) etc. Silver is isoelectronic to copper. The standard electrode potential of Cu2+/Cu+ pair is –0.26V while that of Ag2+/Ag+ is 1.56V at pH 7. Thus, main ionic form of these elements is Cu2+ and Ag+. The monovalent silver cation forms a more stable complex with sulphur of microbial cell walls, which makes silver highly toxic [13].
Transition metal ions, in general, are toxic to the extent that they lead to immobilization of the microbes through complex formation with the enzymes and aminoacids found in the microbial cells. Alternately, the microbes may also be not able to survive in presence of metal ions all together due to impaired metabolic activities. In both of these cases, their growth is hampered and BOD exertion is halted, thereby leading to inhibition in BOD. These observations are supported by the optical density measurements of the incubation of the medium and the results have already been discussed in previous paragraphs.
It can be seen clearly from Figures 1 to 6 that the change in BOD (i.e., the fall in presence of increasing concentrations of metal ions) just corresponds to the optical density measurements which shows decrease in OD due to decrease in growth of microbes for increasing concentration of the metal ions, resulting in net fall in BOD exertion.
3.3. pH Effect
pH is one of the most important parameters that can influence the growth of microbes and hence, the BOD. Metal ions are available as different species when observed at different pH values. For example, when pH of the metal salt solution is raised to the basic medium the metal ions precipitate as their hydroxides and hence behave differently towards the microbes. Experiments for the measurement of BOD were carried out by changing pH of the system with the help of nitric acid (1N) and sodium hydroxide (1N) as per requirement. Maximum BOD is observed for almost all metal ions between pH 5 and 6 (Table 4). Suppression/increase in BOD at a given pH is reported for the GGA system, containing a fixed concentration (2.0 mM) of each metal ion, as the reference. The percentage fall/increase is reported in Table 5. Figures 7 and 8 represent bar charts for decrease/increase in BOD at different pH values for each metal ion.
In the acidic range, suppression is maximum at pH 3.0 for all metal ions except copper. BOD is suppressed to the extent nearly 100% at pH 6.0 except for nickel and zinc. The behaviour of zinc ions has always been different from that of other transition elements. Here, the presence of zinc ions result in relatively less degree of inhibition (except at pH 3) in comparison to all other metal ions. Studies were extended to see the effect on BOD suppression in the basic medium. At pH 8, all transition elements do form metal hydroxides which will render the metal ions less toxic. But the theory of adsorption as reported by Nelson et al. [28] very well explains the experimental results. This mechanism suggests the metal hydroxide could provide suitable surface for the physical adsorption of microbes over the precipitates. Another reason for the fall in BOD at pH 8 may be that the microbes of dairy effluent origin do not survive at this pH, being rich in Lactococcus genus [14] that are stable only in the acidic medium.
3.4. Temperature Effect
BOD3 measurements were done at different temperatures, i.e., 15℃, 20℃, 25℃, 30℃ and 35℃ taking GGA system as the reference. Studies were carried out in presence of a constant concentration (0.8 mM) of cobalt, nickel, copper, zinc, silver, and cadmium. The results are shown in Table 6. BOD values of the GGA system without any metal ion also show an appreciable increase with increase in temperature. This is certainly due to the reason that with increase in temperature solubility of oxygen in aqueous medium decreases, resulting in a corresponding
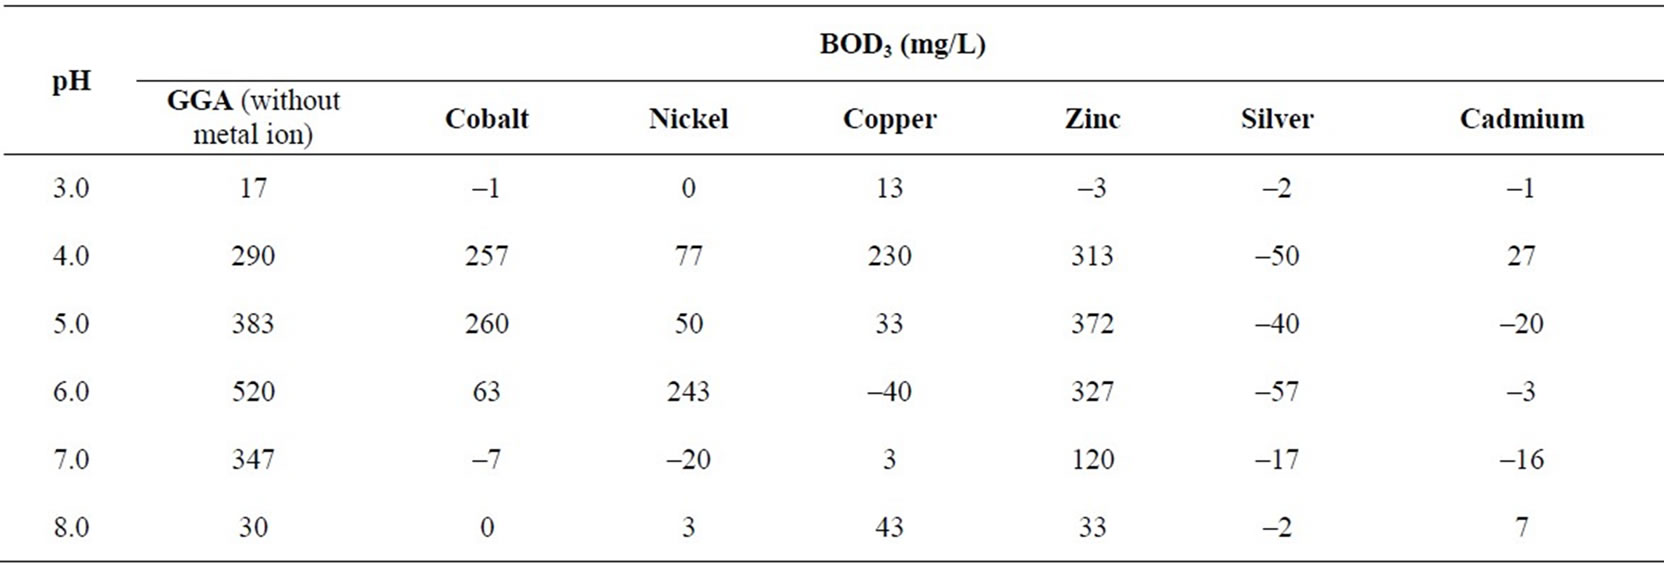
Table 4. BOD3 (27℃) in presence/ absence of metal ions (0.8 mM) at different pH values using dairy microbes as a seed.
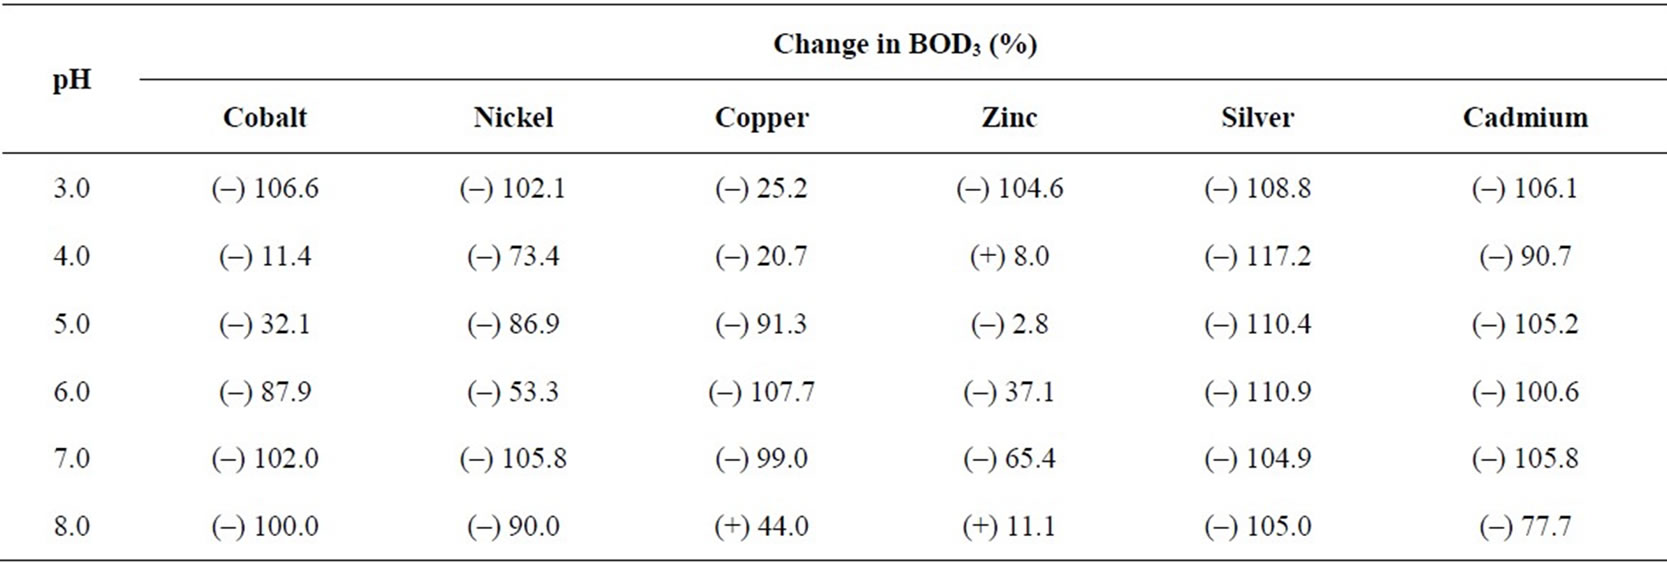
Table 5. Percentage change in BOD3 (27℃) in presence of metal ions (0.8 mM) at different pH values using dairy microbes as a seed.
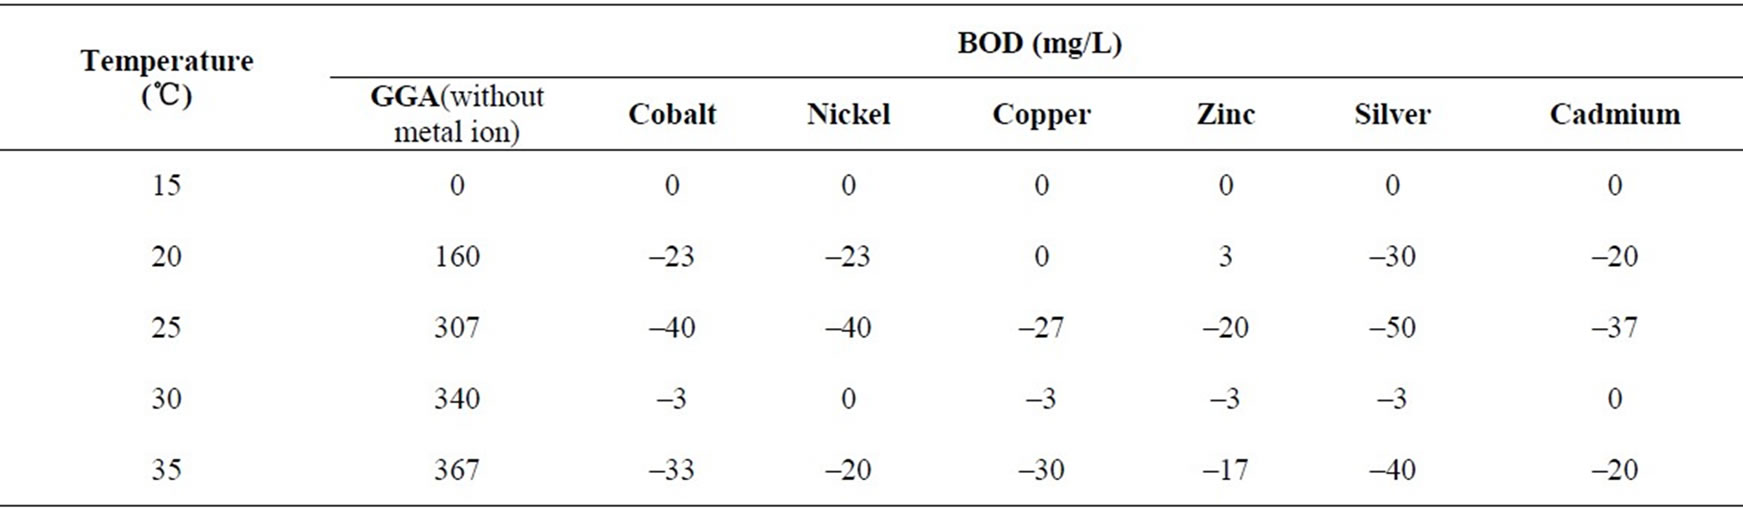
Table 6. BOD3 (27℃) in presence/absence of metal ions (0.8 mM) at different temperatures using dairy microbes as a seed.
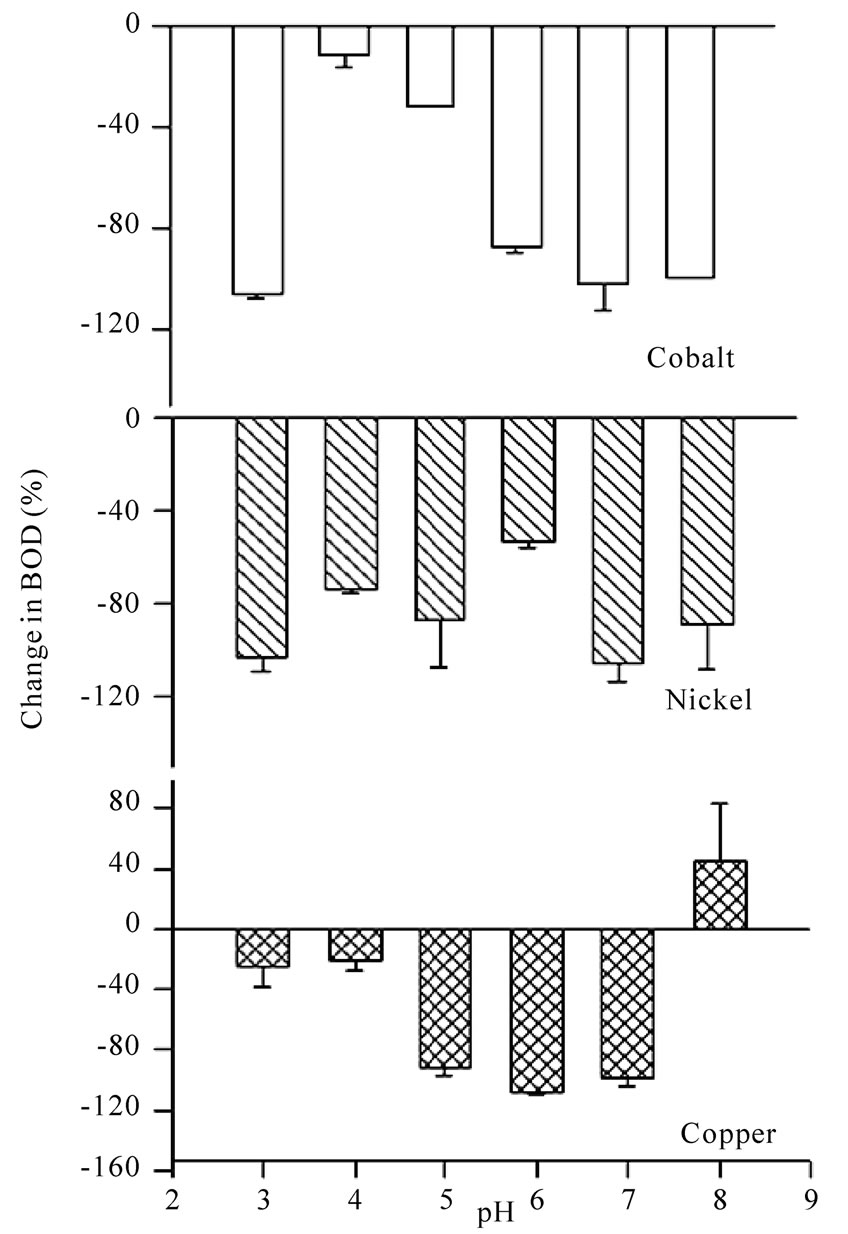
Figure 7. Bar charts for change in BOD (%) in presence of cobalt, nickel and copper ions at different pH values using dairy microbes as a seed.
increases in BOD. It is seen that the presence of metal ions do affect the BOD and result in total inhibition (Table 7) and even the inhibition goes beyond 100% in all of the cases under study. The effect of all the metal ions is almost the same at a given temperature shown in Figures 9 and 10. So, the metal ions do inhibit BOD exertion but without any preference probably because of the reason that the concentration selected for the study was very high and at this concentration most of the BOD is already inhibited. It will be worthwhile to study the effect of temperature for lower range of metal ion concentration.
An increase in BOD for the blank system may be due to greater activity of microbes with increase in temperature. No BOD exertion was noticed for GGA system as well as that for the system that contains metal ions at 15℃. It can be due to reason that microbes are inactive and do not undergo biochemical processes. It is also seen
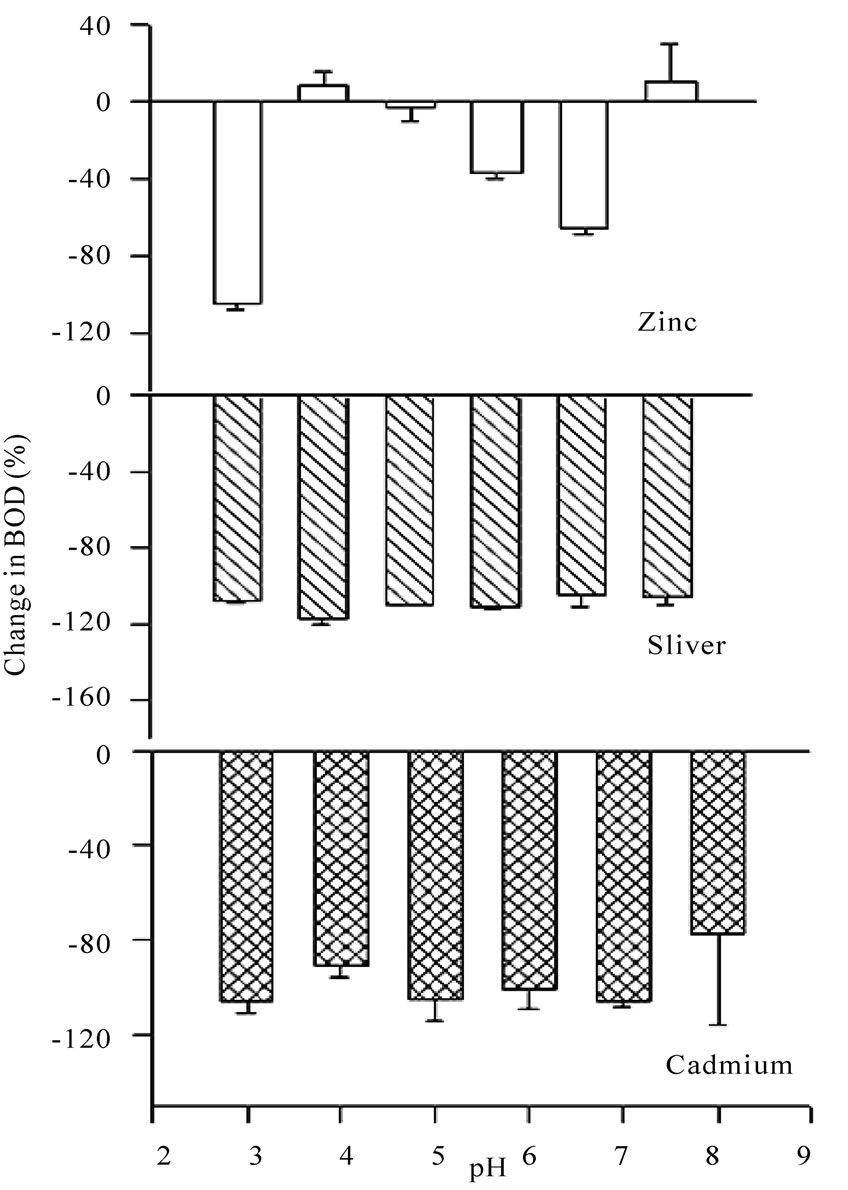
Figure 8. Bar charts for change in BOD (%) in presence of zinc, silver and cadmium ions at different pH values using dairy microbes as a seed.
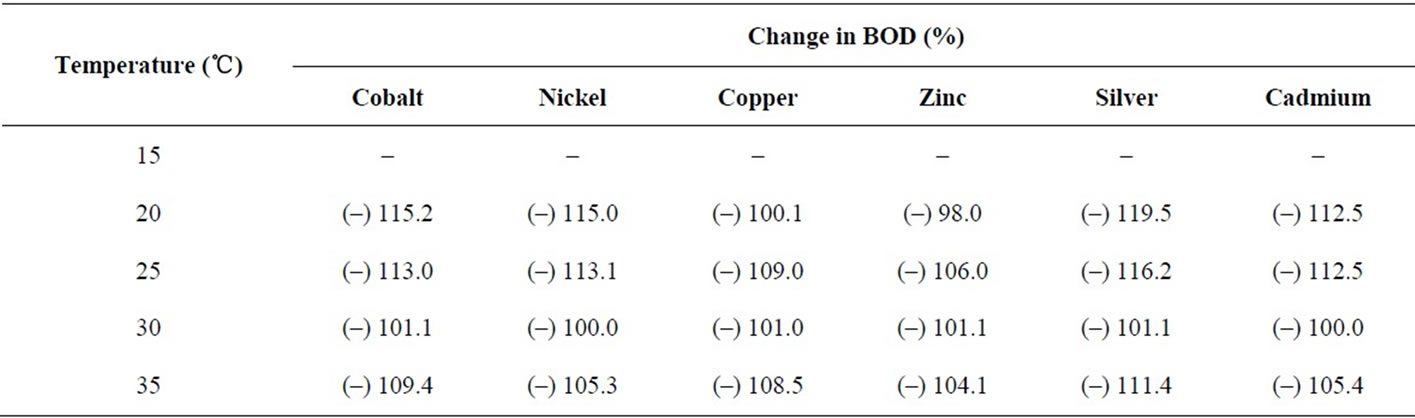
Table 7. Percentage change in BOD3 (27℃) in presence of metal ions (0.8 mM) at different temperatures using dairy microbes as a seed.
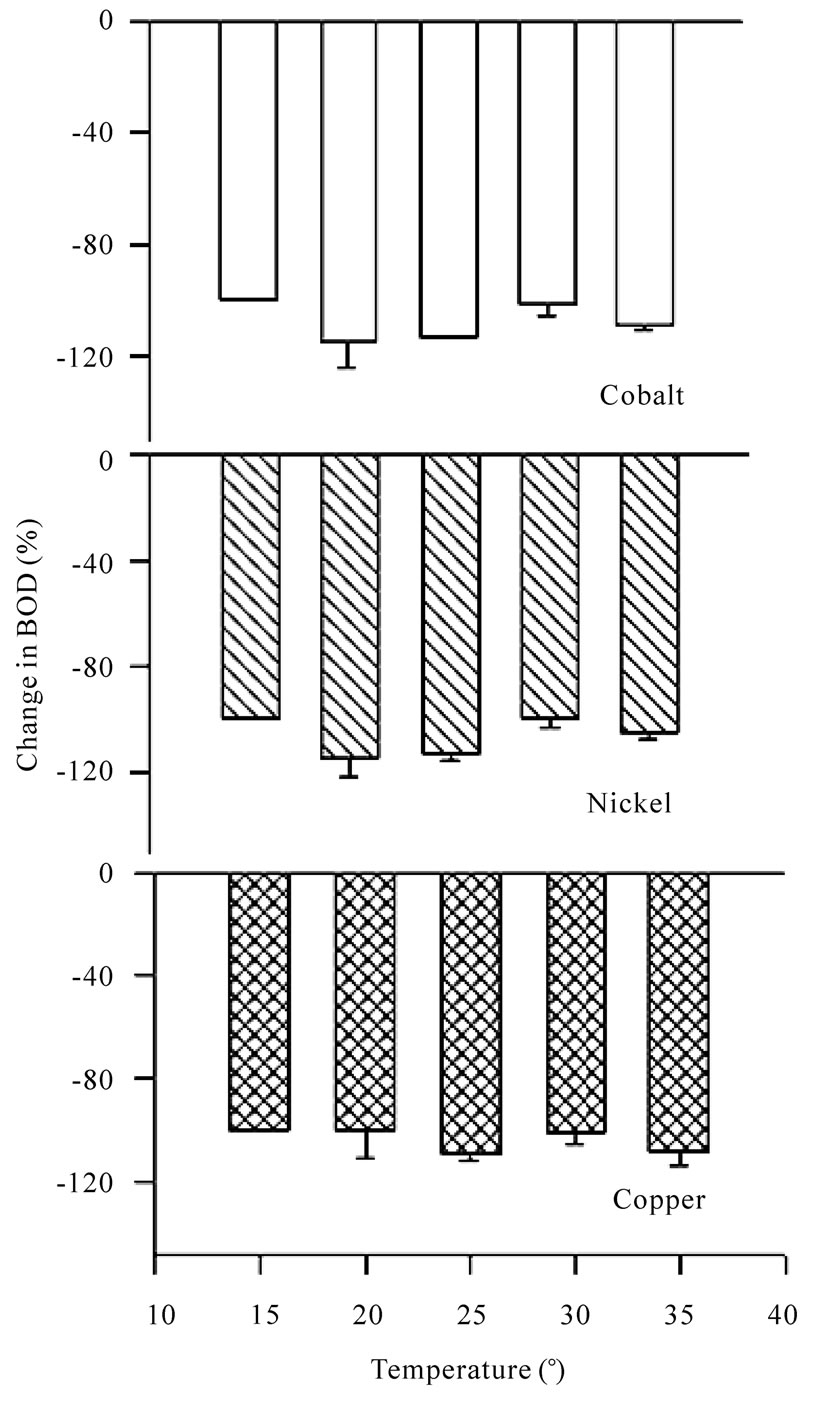
Figure 9. Bar charts for change in BOD (%) in presence of cobalt, nickel and copper ions at different temperatures using dairy organisms as a seed.
that in the standard BOD curve, substantial depletion of DO takes place only after 5 days’ incubation (20℃). BOD exertion process is likely to go still slower at 15℃ and BOD exertion is not expected on day-3.
4. Conclusions
BOD is suppressed in the presence of all metal ions in
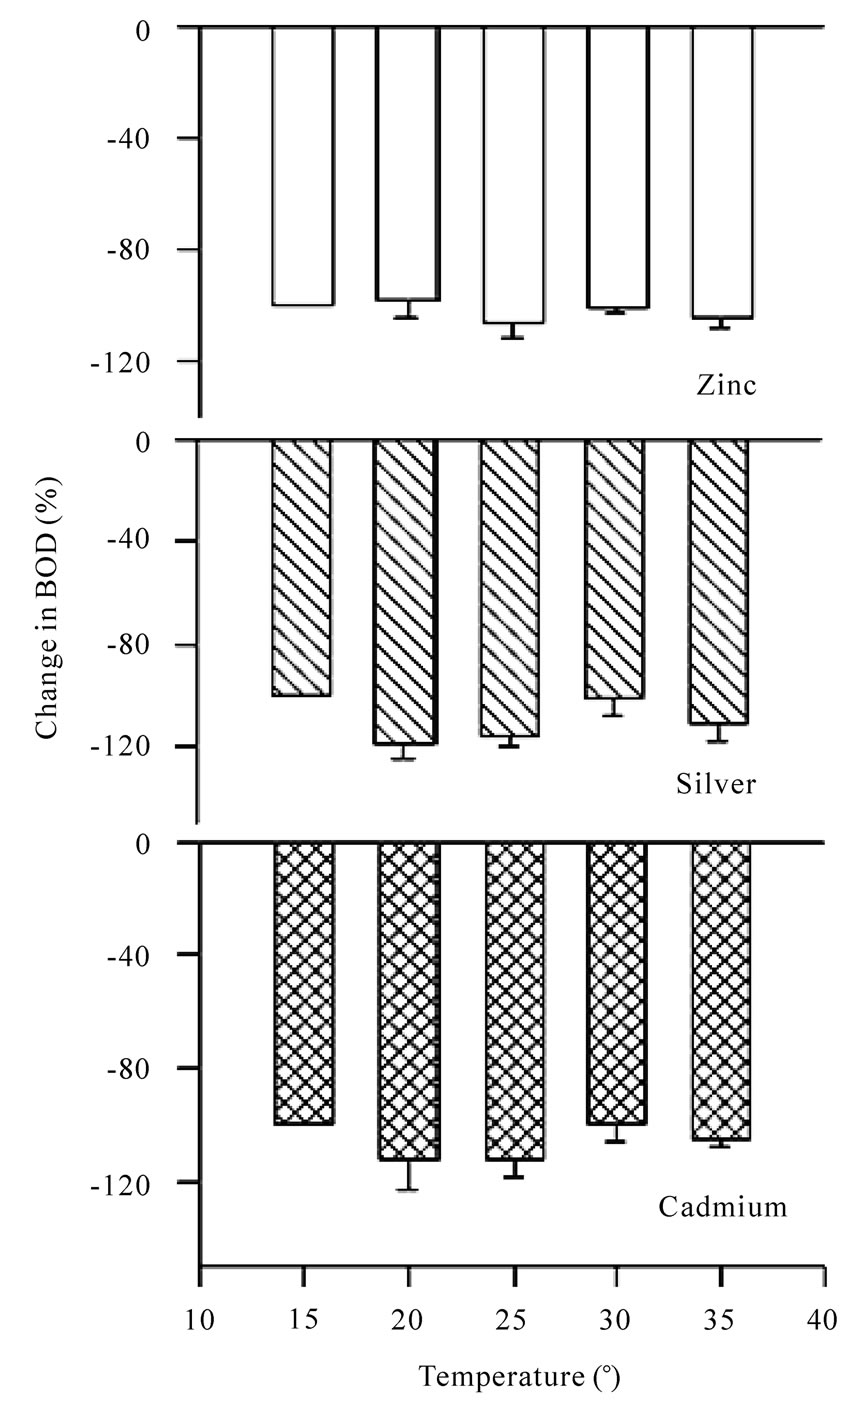
Figure 10. Bar charts for change in BOD (%) in presence of zinc, silver and cadmium ions at different temperatures using dairy microbes as a seed.
the acidic pH range. The maximum decrease takes place at pH = 3.0. In the basic pH range, i.e., 8.0, the relative less decrease in BOD in the basic medium is due to the presence of Lactobacillus, which is stable only in acidic medium. The suppression is obtained only for nickel, cobalt, silver and cadmium that may be due to the presence of Lactobacillus bacteria.
5. Acknowledgements
Authors are thankful to the Director, Thapar University for Laboratory facilities.
REFERENCES
- A. Hufschmid, K. Becker-Van Slooten, A. Strawczynski, P. Vioget, S. Parra, P. Péringer and C. Pulgarin, “BOD5 Measurements of Water Presenting Inhibitory Cu2+ Implications in Using of BOD to Evaluate Biodegradability of Industrial Wastewater,” Chemosphere, Vol. 50, No. 1, January 2003, pp. 171-176.
- A. K. Shrivastava, J. Swaroop and N. Jain, “Effect of Seed on BOD Exertion,” Indian Journal of Environmental Health, Vol. 42, No. 2, 2000, pp. 75-78.
- S. K. Mittal and R. K. Ratra, “Toxic Effect of Heavy Metal Ions on BOD,” Water Research, Vol. 34, No. 1, 2000, pp. 147-152.
- K. Reidal, K. P. Lange, H. J. Stein, M. Kühn, P. Ott and F. Scheller, “A Microbial Sensor for BOD,” Water Research, Vol. 24, No. 7, July 1990, pp. 883-887.
- Y. R. Li and J. Chu, “Study of BOD Microbial Sensors for Wastewater Treatment Control,” Applied Biochemistry and Biotechnology, Vol. 28-29, No. 1, March 1991, pp. 855-864.
- F. Li and T. C. Tan, “Effect of Heavy Metal Ions on the Efficacy of a Mixed Bacilli BOD Sensor,” Biosensors and Bioelectronics, Vol. 9, No. 4-5, 1994, pp. 315-324.
- F. Li and T. C. Tan, “Monitoring BOD in the Presence of Heavy Metal Ions Using a Poly(4-vinylpyridiene)-Coated Microbial Sensor,” Biosensors and Bioelectronics, Vol. 9, No. 6, 1994, pp. 445-455.
- M. Ajmala, A. Ahmada and A. A. Nomania, “Microbial Uptake of Cadmium and its Effects on the Biochemical Oxygen Demand at Various Temperatures,” Water Research, Vol. 16, No. 12, 1982, pp. 1611-1614.
- K. Pilegaard, “Heavy Metals in Bulk Precipitation and Transplanted Hypogymnia Physodes and Dicranoweisia Cirrata in the Vicinity of a Danish Steelworks,” Water, Air and Soil Pollution, Vol. 11, No. 1, January 1979, pp. 67-71.
- H. G. Baity, “Some Factors Affecting the Aerobic Decomposition of Sewage Sludge Deposits,” Sewage Works Journal, Vol. 10, 1938, pp. 539-568.
- I. Feldman, “Use and Abuse of pH Measurements,” Analytical Chemistry, Vol. 28, No. 12, 1956, pp. 1859-1866.
- M. Ajmal, A. Ahmad and A. A. Nomani, “Microbial Uptake of Cadmium and its Effects on the Biochemical Oxygen Demand at Various Temperatures,” Water Research, Vol. 16, No. 12, 1982, pp. 1611-1614.
- D. H. Nies, “Microbial Heavy Metal Resistance,” Applied Microbiology and Biotechnology, Vol. 51, No. 6, June 1999, pp. 730-750.
- K. Nicolette, H. W. Anton and M. Williem, “Detection and Characterization of Lactose-Utilizing Lactococcus spp. in Natural Ecosystems,” Applied and Environmental Microbiology, Vol. 61, No. 2, February 1995, pp. 788-792.
- V. M. Marshall, “Inoculated Ecosystems in a Milk Environment,” Journal of Applied Bacteriology, Vol. 73, 1991, pp. 127-135.
- M. S. Salama, W. E. Sandine and S. J. Giovannoni, “Isolation of Lactococcus Lactis Subsp. Cremoris from Nature by Colony Hybridization with rRNA Probes,” Applied and Environmental Microbiology, Vol. 59, No. 11, November 1993, pp. 3941-3945.
- E. Bore and S. Langsrud, “Characterization of Microorganisms Isolated from Dairy Industry after Cleaning and Fogging with Alkyl Amine and Peracetic Acid,” Journal of Applied Microbiology, Vol. 98, 2005, pp. 96-105.
- American Public Health Association, American Water Works Association and World Press Freedom Committee, “Standard Methods for Examination of Water & Wastewater,” 20th Edition, In: Eaton, A. D. Clesceri, S. Lenore and A. E. Greenberg, Ed., 2000.
- T. D. Brock, M. T. Madigan, J. M. Martinko and J. Parker, “Biology of Microorganisms,” 7th Edition, Prentice-Hall, Inc., Englewood, 1994.
- K. Riedel, R. Renneberg, M. Kühn and F. Scheller, “A Fast Estimation of Biochemical Oxygen Demand Using Microbial Sensors,” Applied Microbiology and Biotechnology, Vol. 28, No. 3, May 1988, pp. 316-318.
- J. E. Coleman, “Zinc Enzymes,” Current Opinion in Chemical Biology, Vol. 2, 1998, pp. 222-234.
- H. A. Ragan and T. J. Mast, “Cadmium Inhalation and Male Reproductive Toxicity,” Review of Environmental Contamination and Toxicology, Vol. 114, 1990, pp. 1-22.
- B. E. Burke and R. M. Pfister, “Cadmium Transport by a Cd2+ Sensitive and a Cd2+ Resistant Strain of Bacillus Subtilis,” Canadian Journal of Microbiology, Vol. 32, 1986, pp. 537-542.
- R. A. Laddaga, R. Bessen and S. Silver, “Cadmiumresistant Mutant of Bacillus Subtilis 168 with Reduced Cadmium Transport,” Journal of Bacteriology, Vol. 162, 1985, pp. 1106-1110.
- Tynecka, Z., and A. Malm. “Energetic Basis of Cadmium Toxicity in Staphylococcus Aureus,” BioMetals, Vol. 8, No. 3, July 1995, pp. 197-204.
- S. Clemens, D. M. Antoseiwicz, J. M. Ward, D. P. Schachtman and J. I. Schroeder, “The Plant cDNA LCT1 Mediates the Uptake of Calcium and Cadmium in Yeast,” Proceedings of the National Academy of Sciences, Vol. 95, September 1998, pp. 12043-12048.
- R. W. Olafson, K. Abel and R. G. Sim, “Prokaryotic Metallothionein: Preliminary Characterization of a BlueGreen Algae Heavy Metal Binding Protein,” Biochemical and Biophysical Research Communications, Vol. 89, No. 1, July 1979, pp. 36-43.
- P. O. Nelson, A. K. Chung and M. C. Hudson, “Factors Affecting the Fate of Heavy Metals in the Activated Sludge Process,” Journal of Water Pollution Control Federation, Vol. 53, No. 8, 1981, pp. 1323-1333.