Atmospheric and Climate Sciences
Vol.4 No.2(2014), Article ID:44734,12 pages DOI:10.4236/acs.2014.42027
Urban Warming in Benin City, Nigeria
S. I. Efe, O. A. Eyefia
Department of Geography and Regional Planning, Delta State University, Abraka, Nigeria
Email: efesundayighovie@yahoo.com, lordsdoing1@yahoo.com
Copyright © 2014 by authors and Scientific Research Publishing Inc.
This work is licensed under the Creative Commons Attribution International License (CC BY).
http://creativecommons.org/licenses/by/4.0/


Received 12 February 2014; revised 10 March 2014; accepted 17 March 2014
ABSTRACT
The study examined urban effects on the temperature of Benin City. The data used for this study were generated from archives of the Nigerian Meteorological Agency Benin City and the Agrometeorological Station of NIFOR, and mobile transverse method of collecting temperature data at different land use types in the urban canopy for one year. Paired t-test and analysis of variance were used to determine the differences in temperature in the area. The findings revealed an urban bias of 4.4˚C, and variation of 5.5˚C in temperature within the urban canopy, which confirmed the concept of urban heat island. It also showed an urban-rural temperature differential of 0.5˚C, which indicated an urban warming of 2% over its rural areas. Daily temperature revealed that the working days are warmer than the weekends. High rate of anthropogenic activities, which act as drivers of heat island in the urban area accounted for the increase in temperature. The study therefore recommends urban planning with green city-green roof approach.
Keywords:Urban Warming; Temperature; Anthropogenic Factor; Benin City

1. Introduction
Over the years the rapid growth in population, industrialization and urbanization have resulted in the concentration of economic and social functions in the urban area, and such altered urban morphology and energy composition. Also unplanned and hasty urbanization in modern cities, especially during the last 45 years, have resulted in environmental problem, such as alteration of local climate and higher amount of air pollution in urban areas. The primary consequences of these are the consistent rise in temperature and reduced humidity in the urban atmosphere [1] -[3] . The noticeable temperature rise in the urban atmosphere is known as the Urban Heat Island UHI [4] -[7] . The study of urban climate has being a subject of great interests in many cities such as Paris [8] , Frankfurt [9] , London [10] , Madrid [11] and Barcelona [12] . Others cities have also been studied since 1960s [13] -[17] , and all these studies point out clearly noticeable degree of heating due to the city’s population density, industrial concentration, size and morphology. This interest is probably because of its direct effect on the urban dwellers. For instance it was estimated that the city of Los Angeles spends about $100 million per year in extra energy cost to offset its heat island effect [18] . Similarly, [19] observed that the detrimental consequences of urban heat island situations are now well known, ranging from exacerbating regional, local and micro-climatic weather extremes, to a range of serious health issues and, of course, implicating the consumption of scarce energy resources and resulting in the emission of greenhouse gases when city buildings are cooled with airconditioners using fossil-fuelled electrical power. However, in tropical humid African cities not much is known about the extreme conditions of urban climate and the concept of urban heat island has been hardly related to the other climatic parameters that have some links with temperature [20] -[22] . However the need for more detailed knowledge of the environment has led to numerous studies on urban climate. In addition, most of the studies of climate changes also involve knowledge of the effect of urbanization on climatic elements [14] .
In Nigeria the urban climatic anomaly has increased with the changes from low-single storey buildings to multistorey buildings in most Nigerian cities. Also zinc and asbestos roofing sheets that lead to net radiation traverse across major land uses are giving way to aluminum roofing sheets with resulting changes in radiation characteristics of the surfaces. Similarly, the height of these buildings and the way in which they are arranged affect the rate of escape at night of the sun’s energy absorbed during the day by building materials [4] . Similarly the fumes from automobile exhaust from fairly used cars and motor bikes account for about 80% of air pollution in urban areas, while the remaining 20% being contributed from industrial sources, the burning of refuse etc. [23] . The effect of these pollutants according to [6] [24] [25] , is not only injurious to man’s health; but also creates urban climatic anomalies. The most serious of this environmental problem are urban warming, presence of Ozone depleting gases, reduced relative humidity and wind-speed, excessive perspiration, reduction in working hours/efficiency. Others are increased rainfall that is accompanied by devastating storms and urban floods. Viewing these enormous problems and the earlier call by [1] , some urban climate studies in Nigeria have examined the urban influence on components of climates characteristics namely: global radiation [5] [26] , net radiation [26] , temperature and albedo [4] [5] [27] . These studies showed that while net radiation and albedo values in urban are lower than the values measured in rural area, temperature is higher in urban areas than in rural areas. However, these studies are limited based on the fact that they are descriptive in nature; based on archive data which is point determine; and failed to examine the spatial and monthly pattern of these climate characteristics over the urban canopy. They however called for periodic investigation of urban climate in other Nigerian cities.
Benin City and its surrounding areas have experienced changes in its morphology over the years. In Benin City, there are some areas where the buildings are tall, for example Akpakpava, G.R.A, Airport road, Mission road and Sapele road. Also there are some areas in Akpakpava, Igun Street, Igbesonwa and Sakpoban road where the buildings are tightly spaced; the distance separating these houses ranges from 1000 mm - 10,000 mm in the traditional areas and 30 m - 50 m in the planned areas. The height of these structures and the way they are spaced cause a reduction of turbulence that in turn keep air trapped within buildings. Benin City has also experienced dramatic changes in building patterns, moving from single storey buildings to multiple storey buildings, zinc to aluminum roofing sheet and louvers to sliding windows that trap solar radiation in the day and emit heat in the night. Anthropogenic heats are added into the atmosphere by fumes that come out from vehicles; these can be seen whenever there is traffic congestion in the major routes in Benin City. For example, (Akpakpava, Igun, Uselu, Iyaro, Airport road), generating sets, fire wood, manufacturing industries, sawmills which emit carbon monoxide into the atmosphere during the process of burning sawdust and backwoods to charcoal, these heat is also added by Nigerian Bottling Company, 7Up company, Guinness, Nigerian Brewery which runs their plants for 24 hours a day due to epileptic power supply. Commercial activities in Benin City also add human metabolic heat into the atmosphere, these includes the various market where you have high concentration of people. Others are increasing in the numbers of buildings, structure and warm air from air conditioners that adds warmth to the surroundings, which pollute and radiate heat into the surrounding landscape and also turning of landscape into townscape also altered the natural environment. These have markedly altered the surface properties of the area and hence have modified the energy and water balance of the area, and resulted in increased temperature of the urban canopy of Benin City [28] -[30] .
In respond to the calls and problem, [28] and [31] carried out some studies on urban climate of Benin City, but studies are limited to three months of temperatures and humidity measurement to the neglect of seasonal variation in the temperature of Benin City and therefore call for studies that will take longer time period so that the spatial and seasonal variation of the urban heat island could be documented. Also in recent times there has been a call for periodic re-examination of the urban climate of tropical cities in order to have an update and compare the situation in these cities with that of other cities in the world [32] -[34] . Based on these calls and aforementioned neglects, this study examines urban effects on the temperature of Benin City, with the aim of examining the spatial and daily temperature pattern in Benin City, Nigeria.
2. Conceptual Issues and Methods of Data Collection
The study is based on the concept of urban heat island (UHI). This concept has been used by several scholars [2] [3] [7] [22] [24] [31] [35] both in the temperate and tropical cities of the world. These studies shows that as city changes, so does its climate. The rapid population growth, progress in industrialization and urbanization, as well as the clearance of natural vegetation, and their replacement with buildings, roads and concrete surfaces in city modifies natural environment. One consequences of this is the consistent rise in temperature and increased precipitation of the urban atmosphere. The noticeable temperature rise in the urban atmosphere is known as urban heat island [3] [7] . Similarly, the modification of land cover in most urban areas of the world can cause the local air and surface temperatures to rise several degrees higher than the simultaneous temperatures of the surrounding rural areas. [36] has outlined several causes of UHI as follows; the principle reasons for the night -time warming is (comparatively warm) building blocking the view to the (relatively cold) night sky. Two other reasons are changes in the thermal properties of surfaces materials and lack of evapotranspiration in urban areas, materials commonly used in urban areas, such as concrete and asphalt, have significantly different thermal bulk properties (including heat capacity and thermal conductivity and surface radiation properties albedo and emissivity) than the surrounding rural areas. These causes a change in the energy balance of the urban area often leading to higher temperatures than surrounding rural areas. The energy balance is also affected by the lack of vegetation in urban areas, which inhibits cooling by evapotranspiration [36] . Other causes of UHI are geometric effects, tall buildings within many urban areas that provide multiple surfaces for the reflection and absorption of sunlight, increasing the efficiency with which urban areas are heated, and this is called the “canyon effect”. Another effect of buildings is the blocking of wind, which also inhibits cooling by convection, waste heat from air conditioning, industry and other sources also contributes to the UHI, high levels of pollution in urban areas can also increase the UHI, as many forms of pollution change the radiation properties of the atmosphere [3] . [37] has also observed that the main cause of urban heat island is the modification of the land surface by urban development, and waste heat generated by energy usage. As population in the urban area grows they tend to modify a greater area of land use and consequently have a corresponding increase in average temperature and precipitation of the urban canopy. Partly as a result of the urban heat island effect, monthly rainfall is about 28% greater between 20 - 40 miles downwind cities compared with upwind [37] .
The UHI describes the increased temperature of urban air compared to its rural surroundings [35] . Figure 1 showed an idealized heat island profile for a city, showing temperatures raising from the rural fringe and peaking in the city centre. The profile also demonstrates how temperatures can vary across a city parks and lakes are cooler than adjacent areas covered by buildings [35] .
The data used for this study were collected through mobile field traverse and archival temperature data from Nigerian Meteorological Agency (NIMET) office Benin City for thirty three years period (1980-2012). The choice of these years is based on availability, consistence and reliability data. The mobile traverse method was used for direct field measurement of temperature during the 0600, 1200 and 1800 GMT hours. Benin City was stratified into 6 zones based on land use types (see table 1), with the sixth zones serving as a control. The temperature data were collected from these various land use types in Benin City as adopted by [3] and [33] . In collecting the temperature data, the mobile traverse method was used with the help of research assistants who carried the thermometer in a motorized form to observe the variation in temperatures of the built-up areas, Egor and Ugbekun-oka. The mobile traverses were stopped at pre-determined locations within each land use for temperatures observation in the eight observatory sites (see figure 2) as suggested by [38] . The data collected were complemented with temperature collected from the Nigerian Meteorological Agency Benin and Nigerian Institute for Oil Palm Research (NIFOR) Agro-meteorological Station which serves a rural station.
The data were summarized with descriptive statistics of mean and range, and used for the study. The analysis of variance (ANOVA) and the paired t test were used to ascertain the level of variation in temperature and precipitation within the built up areas, and between the urban canopy and the surrounding rural area of Benin City respectively. In order to test the urban heat island intensity, a simple regression equation was used. [39] has shown that urban heat island intensity can be related to city size as follows:
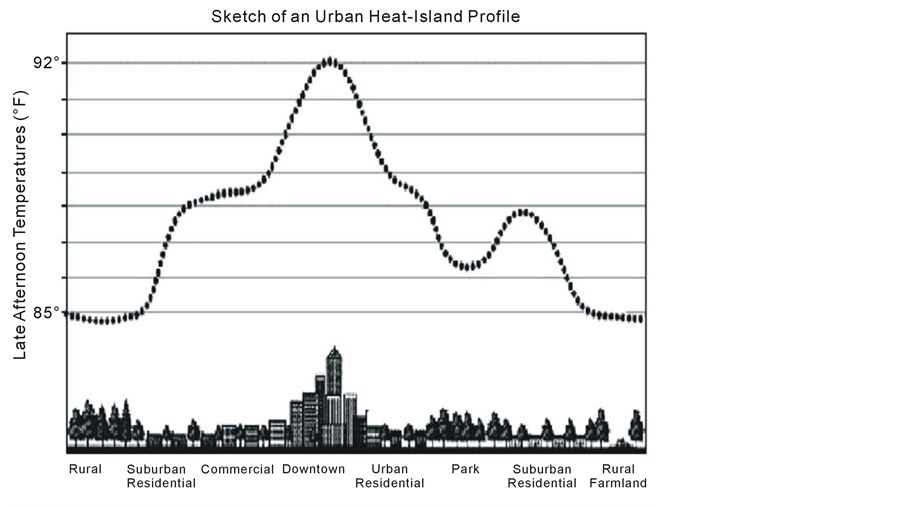
Figure 1. Urban heat island profile.

Table 1. Various land use types.
 (1)
(1)
3. Results and Discussion
The data collected were presented in table 2 and figures 3-6; and discuss below.
3.1. Annual and Monthly Distribution of Temperature
In Benin City, the annual mean temperature of 27˚C with 0.2˚C decadal increase in temperature over the last thirty years was observed (see figure 3). The highest annual mean temperature of 27.3˚C was recorded in 2012 and the lowest annual mean temperature of 26.8˚C was recorded in 2002. On the other hand the rural area had an annual mean temperature of 26.5˚C with an increase of 0.1˚C (see figure 3). While 2012 recorded the highest temperature of 26.8˚C, 2002 and 2005 had the lowest temperature of 26.4˚C in the rural area. Rural-Urban temperature comparison showed an urban warming of 0.5˚C (2%). This finding corroborated [40] and [41] whose study revealed difference as high as 15˚C between temperature measurements in one month from urban and rural landscape in the Athens area. The low value of temperature in the rural area of Benin City is due to the natural settings of the area; [37] has also observed that the main cause of urban heat island is the modification of the land surface by urban development, and waste heat generated by energy usage. As population in the urban area grows they tend to modify a greater area of land use and consequently have a corresponding increase in average temperature and precipitation of the urban canopy. And the natural vegetation units in the rural area are yet to be
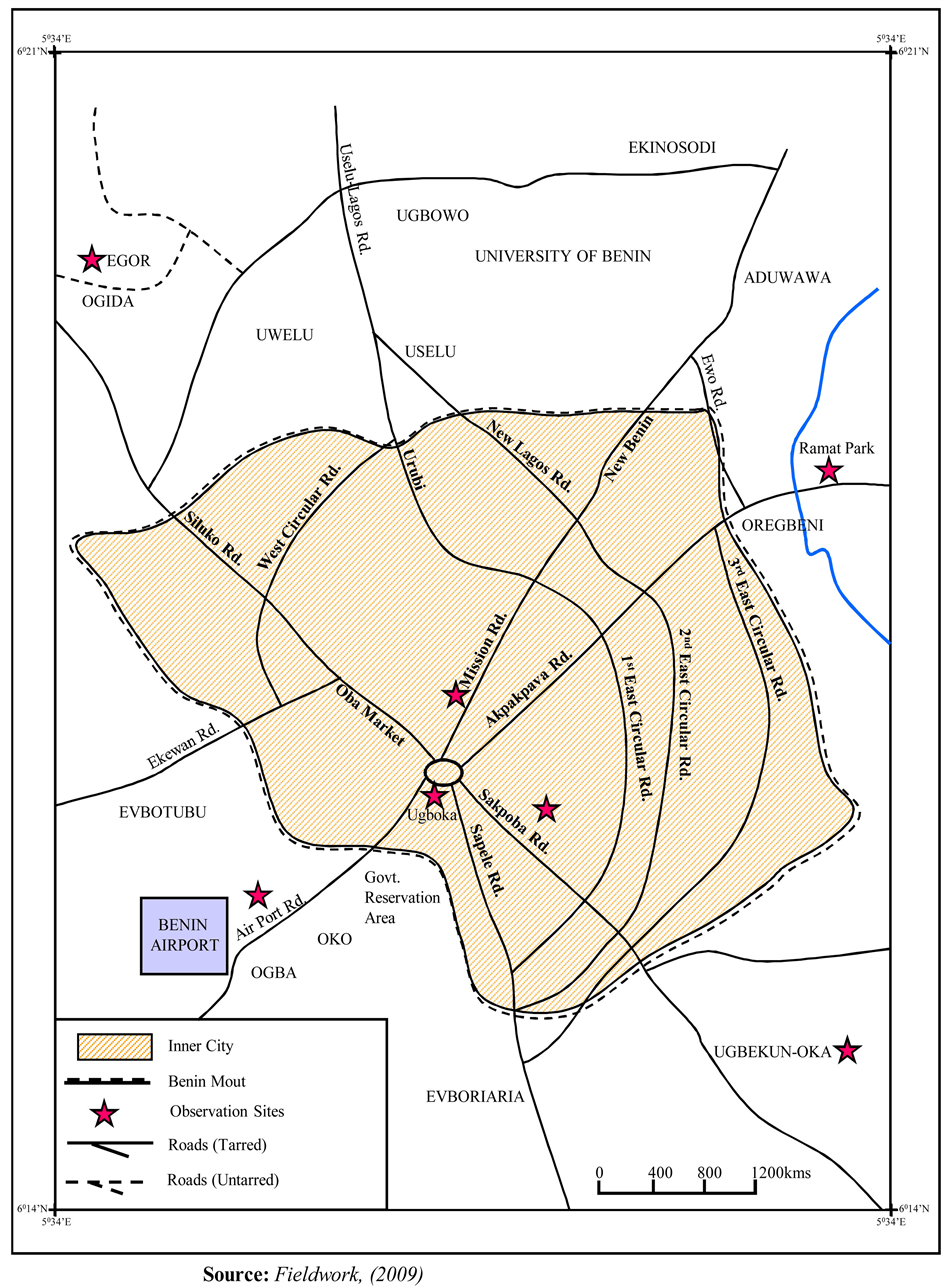
Figure 2. Map showing benin City showing observation sites.
Table 2. Mean monthly temperature distribution (˚C) in Benin City.
Source: Nigerian Meteorological Agency Benin City (NIMET) (1980-2012).
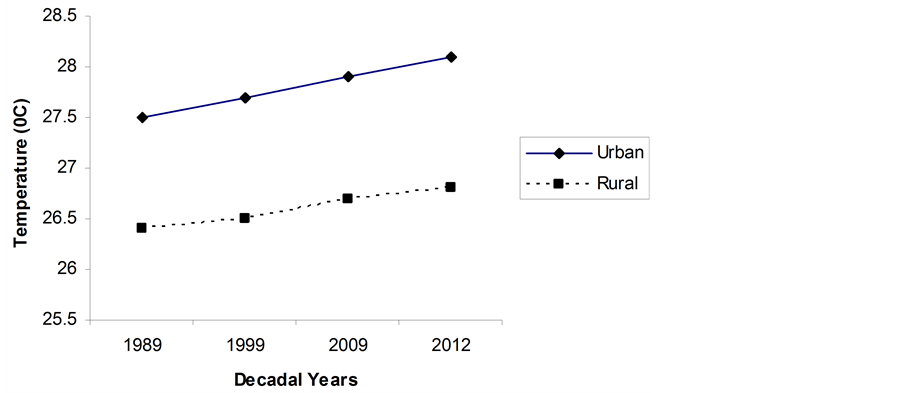
Figure 3. Decadal distribution of temperature in Benin City.&;
turned to townscape. This corroborated those of [3] and [7] in Warri metropolis and Buenos Aires respectively.
Table 2 showed the mean monthly temperature distribution in the urban canopy of Benin City from 1980-2012, and it indicate monthly mean temperature that span 25.2˚C in July to 28.7˚C in March with 3.5˚C increase in temperature (see table 1). Other had the following temperature: January (27˚C), February (28.3˚C), April (28.2˚C), May (27.4˚C), June (26.4˚C), July (25.6˚C), September (25.6˚C), October (26.6˚C), November (27.9˚C) and December (27.7˚C) (see table 2). Similarly July and March had the lowest and highest temperature of 24.5˚C and 28.1˚C respectively.
Assessing the UHI in cities, [42] considers a town with a population of less than 10,000 people to be rural and not to require any adjustment for urbanization. [39] and [43] showed that even towns with populations of 10,000 people have urban heating of about 2.2˚C compared to the nearby countryside. [39] found evidence that the UHI (in ˚C) increases according to the formula:

This means that a village with a population of 10 has warm bias of 1.46˚C, a town with population of 1000 people has a warm bias of 2.2˚C and a large city with a million people has a warm bias of 4.4˚C [39] . When this is applied to the urban climate characteristics of Benin City with a population of 1,147,188, it showed UHI of 4.4˚C. This is deduced from the equation:

It is observed from the above that Benin City had a warming bias of 4.4˚C with a population of 1,147,188. This corroborated [44] in a comparison of “urban” and “rural” sites in the United States and found that there could be a significant warming effect of 0.1˚C between 1901 and 1984 from a population as low as 10,000. This rise in urban temperature is precipitated by population density, industrial concentration, size and morphology of the urban canopy over its surrounding rural areas [4] [5] [42] .
To further determine the strength of urban-rural temperature differential in Benin City, the paired t test (t-ratio) statistical technique was used. The summary of the result is presented in table 3.
From table 3 the calculated t value is 20.931, and the critical t-value is 1.960 with 183 degrees of freedom for a two-tailed test at 0.05 significant levels. This showed that the calculated value (20.931) is greater than the critical
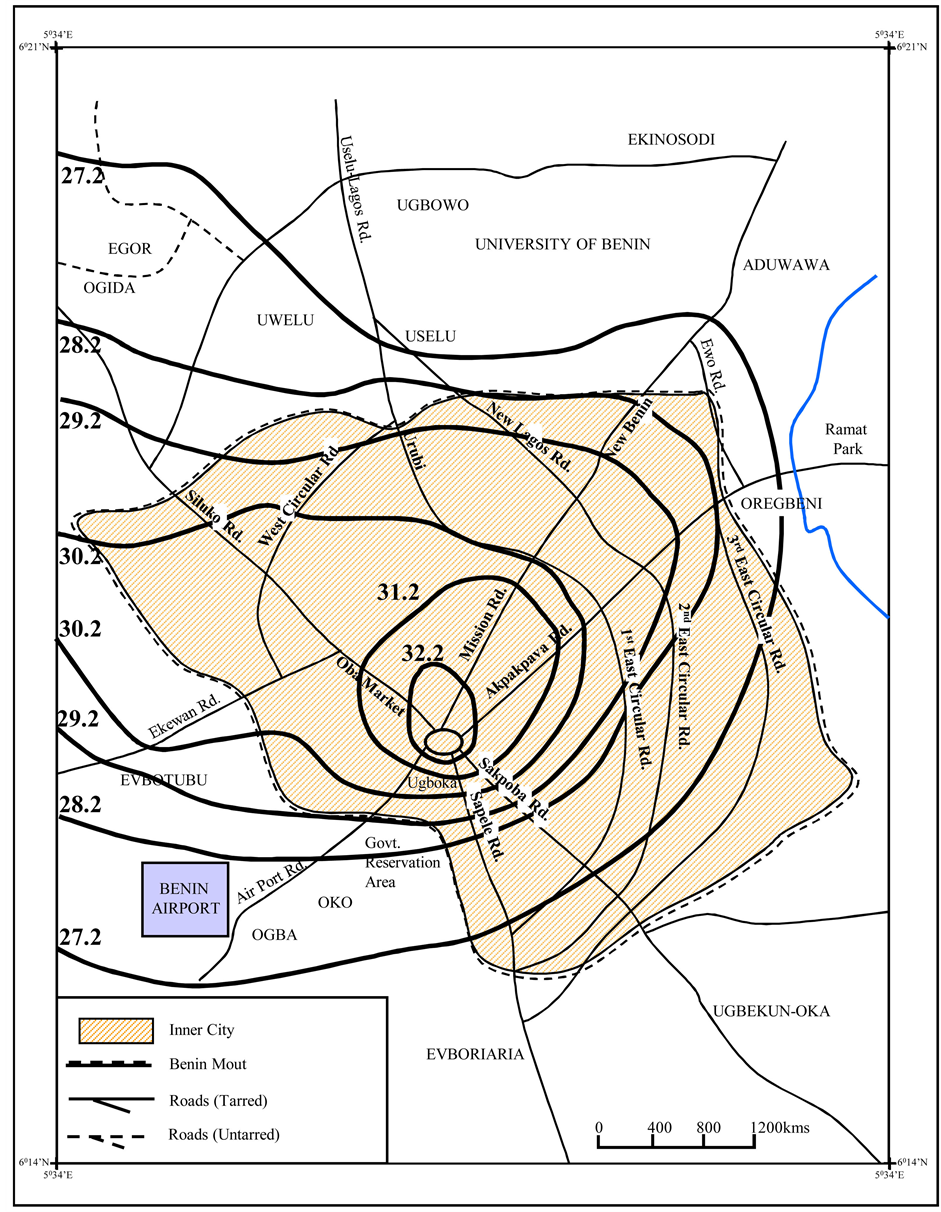
Figure 4. Spatial pattern of temperature in Benin City.
t value of 1.960. Thus, temperature amounts between the urban areas (Ogbelaka, New Benin, Upper Sakponba, Remark Park, Ring Road etc.) and the rural areas (NIFOR village, Egor and Ugbekun-oka) differ significantly.
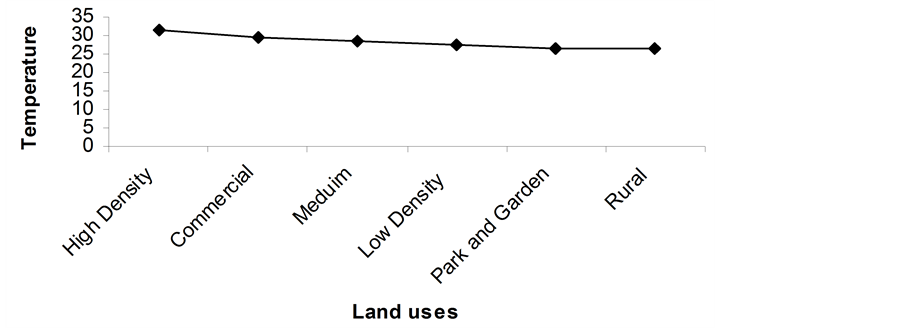
Figure 5. Temperature distribution (˚C) in the different land use types in Benin City.
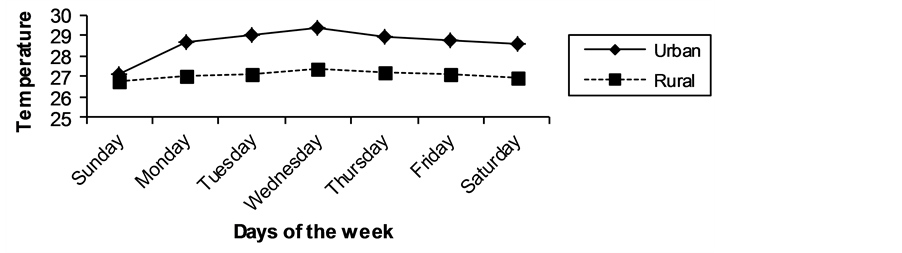
Figure 6. Mean daily temperature distribution in Benin City.
Table 3. Paired t’ test explaining the difference in temperature in urban-rural area.
Source: Field work, 2012.
This confirmed the earlier view that the mean annual urban area temperatures are 0.5˚C and the urban canopy is 1.3˚C higher than Egor andUgbekun-oka. Whlie [45] has earlier observed temperature difference of 3.9˚C in the city centre of Ibadan, [5] posited that during the wet season, an increase of 1.0˚C to 1.5˚C in the temperature towards the city centre was observed in Ibadan.
3.2. Spatial Distribution of Temperature
Spatial examination of temperature within the urban canopy of Benin City and the various land use types from January-December 2012 revealed that there is an increase in temperature from the periphery towards the City centre (see figure 4). This is evident from mean temperature that ranges from 26.2˚C in the rural area to 31.7˚C in the city core. Figure 4 revealed that the different land use types in Benin City records different temperature. For instance, the high density areas recorded mean temperature of 31.7˚C (Ogbelaka), the commercial areas has 29.6˚C (New Benin), the medium residential density areas has 28.3˚C (Airport road areas), low density areas has 27.5˚C (Upper Sakponba areas), natural parks and gardens has 26.2˚C (Ramat Park). And Figure 5 shows that the high density area is warmer than the commercial areas with 2.1˚C. The commercial areas on the other hand are 1.3˚C warmer than the medium density areas, and the medium density area is warmer than the low density areas with 0.8˚C. Also the low density area is warmer than the natural parks and gardens with 1.3˚C. These increase in temperature in the high density areas, commercial areas and the medium density areas over the natural park and low density area could be attributed to increase in population, the traditional ways of buildings in the areas, green house gases effect from waste incineration, fumes from generating sets or plants, motor bikes, vehicles and air conditioners, low wind velocity that characterized the urban canopy and the turning of landscape to townscape. In fact as population in these areas grows they tend to modify a greater area of land use and consequently have a corresponding increase in average temperature. These increases in the different land use types corroborated those of [28] [46] and [47] . For instance, [46] showed that urban heat island effect of 2˚C - 4˚C in the zone of dense traffic and main corridors of Mushin and Oshodi areas of the Lagos city at noon.
It was observed from table 2, that the mean monthly temperature within Benin City spans 27.3˚C - 31.7˚C. While, monthly mean temperature of 31.7˚C was recorded in January-March, April 29.1˚C, May 28.9˚C, June 27.9˚C, July 27.5˚C, August 27.3˚C. The monthly mean temperature distribution in the high density residential areas showed a mean of 31.7˚C with a range of 30.4˚C - 34.4˚C. The commercial areas had a monthly mean temperature record of 29.6˚C with March (33.5˚C) and April (30.9˚C) been the months with highest and lowest temperature respectively. The medium density areas temperature distribution showed a mean of 28.3˚C with March (31.4˚C) and April (28.8˚C) been the highest months and the lowest temperature distribution, in months of May (28.4˚C). The low density areas had a monthly mean temperature of 27.5˚C with a range of 26.4˚C - 30.3˚C. The natural parks and gardens recorded monthly mean temperature of 26.2˚C with March 28.9˚C and May 26.1˚C been the months with highest and lowest temperature distribution respectively.
From figure 4 and figure 5, it is clear that temperature decreases from the high density residential/industrial area down to the country sides, and such confirmed the UHI concept and thus indicate urban effect on the temperature of Benin City, Nigeria.
3.3. Daily Temperature Distribution
The daily distribution of temperature within the urban canopy of Benin revealed that Wednesdays and other working days are warmer, than the weekends. In fact Wednesdays were warmer, while Sundays are cooler with mean temperature of 29.4˚C and 27.1˚C within the urban canopy, and 27.4˚C and 26.8˚C recorded at the rural area (Egor and Ugbekun-oka) on Wednesdays and Sundays respectively.This indicates a difference of 2˚C and 0.3˚C between the urban areas,Egor and Ugbekun-oka (see Figure 6). Figure 6 indicated other days in descending order in the urban area; Saturdays (28.6˚C), Fridays (28.7˚C), Mondays (28.7˚C), Tuesdays (29˚C), and Thursdays (28.9˚C). On the other hand Egor and Ugbekun-oka has the following temperature amounts in descending order; Saturdays (26.9˚C), Mondays (27˚C), Tuesdays and Fridays (27.1˚C), and Thursdays (27.2˚C). Figure 6 revealed that the daily temperature recorded in the urban areas were also generally higher than those of Egor and Ugbekunoka (rural area) which is also an indication of urban effects on temperature in the areas. The increase in temperature on working days over weekends could be attributed to the high rate of anthropogenic activities on the workings days than the weekends, which occasioned greenhouse effect and thus act as drivers of heat island in the urban area of Benin City[10] [28] .
In order to ascertain if there is significant variation in temperature within the urban canopy of Benin City the analysis of variance (ANOVA) was employed (see Table 4for details).
According to [48] when the calculated F-value is greater than the critical F-value, it means there is a significant variation. Thus table 4 indicated that the calculated F-value of 49.370 at 0.05 significant levels is greater than the critical F-value of 2.21, therefore, there is a significant variation in the distribution of temperature within the urban canopy of Benin City. This further confirms the 4.4˚C urban bias and 5.5˚C temperature variation from high density area to the natural parks in Benin City.
4. Implication of UHI for Planning
According to the Fourth Assessment of the Intergovernmental Panel on Climate Change [49] , UHI has some
Table 4 . ANOVA explaining the variation in temperature within the urban canopy.
Source: Fieldwork, 2012.
environmental and health implications on its residents. These are amongst the consequences: It provoke physical traumas caused by natural disasters like storms and flood, and causes heat wave which influence human physiology, as such increase over all burden of illness, mortality via heat exhaustion with children and elderly most vulnerable it caused climate anomaly that lead to food insecurity, reduces air and water quality, and create an ecology of vector of infection diseases; it also disrupt social and economic system. For instance it cause migration of population dependent on subsistence farming to urban areas due to prolong rise in temperature which cause droughts, and consequently create a burden on resources and social safety mechanisms of the receiving communities [50] , it is therefore recommended that urban policy makers and practitioners should take immediate responsibility to integrate urban climate into planning in all area of environment, public health, food system, infrastructure, and land use planning, thereby increasing the potential to create more healthy and sustainable communities. Others are adoption of green city—green roof approach, planting of trees, and other adaptation strategies focus on activities that eliminate health disparities, improved neighborhood conditions and protect those who will be most impacted by UHI. National or Federal governments address the health risk UHI to avoid unnecessary cost and hardship on health care and social system, by devoting necessary resources and adaptive capacity of local government, communities, and individual.
5. Conclusion
The study of urban effects on the temperature of Benin City revealed an urban bias of 4.4˚C in temperature, which confirmed the existence of urban heat island in Benin City, and thus has strong implication on the bioclimatological aspect of the urban environment and physiological comfort of the urban inhabitants. The study also showed that there is a significant variation in the distribution of temperature within the urban canopy of Benin City. This accounted for 5.5˚C temperature variation from high density residential and industrial areas to the natural parks in Benin City. Urban-rural temperature differential showed an increase of 0.5˚C, which indicated an urban warming of 2% over its surrounding rural areas. This increase could be ascribed to increase in population and the high rate of anthropogenic activities within the urban canopy than the rural area. The daily distribution of temperature within the urban canopy of Benin revealed that Wednesdays and other working days are warmer, than the weekends. In fact Wednesdays were warmer, while Sundays are cooler with mean temperature of 29.4˚C and 27.1˚C within the urban canopy, and 27.4˚C and 26.8˚C recorded at the rural area (Egor and Ugbekun-oka) on Wednesdays and Sundays respectively. The increase in temperature during the working days over the weekends could be attributed to the high rate of anthropogenic activities on the workings days than the weekends, which precipitate green house gases effect and thus act as drivers of heat island in the urban area during this period. It is therefore recommended that urban policy makers and practitioners should take urgent responsibility to integrate urban climate issues into planning in all area of environment, public health, food system, infrastructure, and land use planning, as well as adoption of planning method of green city—green roof approach in Nigerian cities.
References
- Oke, T.R. (1979) Review of Urban Climatology 1973-1979. World Meteorological Organization Technical Note: No. 169, World Meteorological Organization, Geneva, 100.
- Oke, T.R. (1990) Bibliography of Urban Climate 1981-1988. WCAP-15, World Meteorological Organization, Geneva.
- Efe, S.I. (2002) Urban Warming in Nigeria Cities: The Cases of Warri Metropolis. African Journal of Environmental Studies, 2, 16-168.
- Oguntoyinbo, J.S. (1981) Aspect of Urban Microclimate. The Case of Ibadan. In: Sada, P.O. and Oguntoyinbo, J.S., Eds., Urbanization Processes and Problem in Nigeria, Ibadan University Press, Ibadan, 137-139.
- Adebayo, Y.R. (1985) The Microclimate Characteristics within the Urban Canopy of Ibadan. Ph.D Thesis, University of Ibadan, Ibadan.
- Botkin, D.B. and Keller, E.A. (1998) Environmental Science: Earth as a Living Plant. John Wiley and Sons Inc., New York, 444-465.
- Figuerola, P.I. and Mazzeo, N.A. (1998) Urban-Rural Temperature Differences in Buenos Aires. International Journal of Climatology, 18, 1709-1723. http://dx.doi.org/10.1002/(SICI)1097-0088(199812)18:15<1709::AID-JOC338>3.0.CO;2-I
- Dettwiller, J. (1970) Evolution Seculaire du Climate de Paris. (Influence de l’urbansime). Memoirs of the Meteorological National of Paris, 52, 83.
- Hanal, G., Weidert, D. and Busen, R. (1990) Absorption of Solar Radiation in an Urban Atmosphere. Atmospheric Environment, 24, 83-292.
- Lee, D.O. (1992) Urban Warming? An Analysis of Recent Trends in London’s Heat Island. Weather, 47, 50-56. http://dx.doi.org/10.1002/j.1477-8696.1992.tb05773.x
- López Gómez, A., Fernández, F., Arroyo, F., Martín-Vide, J. and Cuadrat, J.M. (1993) El clima de lasciudadesespaolas. Cátedra, Madrid, 1993, 268.
- Moreno-Garcia, M.C. (1994) Intensity and Form of the Urban Heat Island in Barcelona. International Journal of Climatology, 14, 705-710. http://dx.doi.org/10.1002/joc.3370140609
- Changnon, S.A. (1968) The LaPorte Weather Anomaly—Fact or Fiction? Bulletin of the American Meteorological Society, 49, 4-11.
- Heino, R. (1980) Urban Effect on Climatic Elements in Finland. Report 7, Department of Meteorology, University of Helsinki, Helsinki, 172-188. http://www.geophysica.fi/pdf/geophysica_1978_15_2_171_heino.pdf
- METROMEX (1981) A review and Summary. Lancaster Press, Lancaster.
- Alonso, M.S., Labajo, J.L. and Fidalgo, M.R. (2003) Characteristics of the Urban Heat Island in the City of Salamanca, Spain. Atmósfera, 61, 37-148.
- Crawshaw, J.A. and Beggs, P.J. (2003) Impacts of Urbanizations on Rainfall in Sydney, Australia. http://www.geo.uni.lodz.pl/~icuc5/text/O_17_1.pdf
- West, J.W. (2003) Effect of Heat Stress on Production of Dairy Cattle. Journal of Dairy Science, 86, 2131-2144.
- Samuels, R. (2006) Inadvertent Urban-Climate, Emitters. Internal-Combustion Engines and Air-Conditioners. Ecocity, 6, l-9.
- Adebayo, Y.R. (1990) Aspect of the Variation in Some Characteristics of Radiation Budget within the Urban Canopy of Ibadan. Atmospheric Environment, 24, 9-17.
- Adebayo, Y.R. (1991) Heat Island in a Humid Tropical City and Its Relationship with Potential Evaporation. Journal of Theoretical and Applied Climatology, 43, 137-147. http://dx.doi.org/10.1007/BF00867471
- Ayoade, J.O. (1993) Urban Climate Studies in Tropical Africa: Problems and Prospects. The First International Conference of the African Meteorological Society, Nairobi, 8-12 February 1993, 7-11.
- Oluwande, P.O. (1979) Automobile Exhaust Problem in Nigeria. Ambio, 8, 26-29.
- Landsberg, H.E. (1981) City Climate. In World Survey of Climate, General Climatology 3, Amsterdam, New York, Oxford, 299-344.
- Efe, S.I. (2001) Urban Effects on Temperature in the Warri Metropolitan Area. Urban and Regional Affairs, 5, 31-34.
- Ojo, S.O. (1980) Radiation and Temperature Traverses over Lagos Island. Nigerian Geographical Journal, 23, 38-44.
- Oguntoyinbo, J.S. (1970) Reflection Coefficient of Natural Vegetation, Crop and Urban Surfaces in Nigeria. Quarterly Journal of the Royal Meteorological Society, 96, 430-441. http://dx.doi.org/10.1002/qj.49709640907
- Omogbai, B.E. (1985) Aspects of Urban Climate of Benin City. M.Sc. Dissertation, University of Ibadan, Ibadan.
- Efe, S.I. (2002) Aspect of Indoor Microclimates Characteristics in Nigeria Cities: The Warri Experience. Environmental Analar, 8, 906-916.
- Efe, S.I. (2006) Climate Characteristics in Abraka, Delta State, Nigeria. In: Akinbode, A. and Ugbomeh, B.A., Eds., Abraka Region, Central Books Ltd., Agbor, 6-15.
- Omere, O.O. (2001) Aspect of Urban Climate: A Case Study of Benin City. B.Sc Dissertation, Department of Geography and Regional Planning, Delta State University, Abraka.
- Lowry, W.P. and Probald, F. (1978) An Attempt to Detect the Effect of a Steelwork on Precipitation Amounts in Central Hungary. Journal of Applied Meteorology, 17, 964-975. http://dx.doi.org/10.1175/1520-0450(1978)017<0964:AATDTE>2.0.CO;2
- Efe, S.I. (2013) Urban Effects on Precipitation and Rainwater Quality in Warri, Nigeria. Lambert Academic Publishing, Saarbrucken.
- Adelekan, I.O. (2005) Urban Climate Research in Nigeria. http://testbed.fmi.fi/Misc/IAUC013.pdf
- Livingstone, K. (2006) London’s Urban Heat Island: A Summary for Decision Makers. Published by Greater London Authority, City Hall, London.
- Oke, T.R. (1982) Bibliography of Urban Climate 1977-1980. WCAP 15, World Meteorological Organization, Geneva.
- Fuchs, D. (2005) Spain Goes Hi-Teach to Beat Drought. The Guardian Published Online. www.guardian.co.uk/world/2005/june/28/spain/wather
- Ayoade, J.O. (2008) Techniques in Climatology. Stirling-Horden Publishers Ltd., Ibadan.
- Oke, T.R. (1973) City Size and the Urban Heat Island. Atmospheric Environment, l7, 769-779.
- Santamouris, M., Mihalakakou, G., Papanikolaou, N. and Asinmakopoulou, D.N. (1999) A Neural Network Approach for Modelling the Heat Island Phenomenon in Urban Areas during the Summer Period. Geophysical Research Letters, 26, 337-340. http://dx.doi.org/10.1029/1998GL900316
- Santamouris, M. (2001) Energy and Climate in the Built Environment. James & James, London.
- Peterson, T.C. (2003) Assessment of Urban versus Rural in Situ Surface Temperatures in the Contiguous United States: No Difference Found. Journal of Climate, 16, 2941-2959. http://dx.doi.org/10.1175/1520-0442(2003)016<2941:AOUVRI>2.0.CO;2
- Toro, S.J., Morris, C.J.G., Skinner, C. and Plummer, N. (2001) Urban Heat Island Features of Southeast Australian Towns. Australian Meterorological Magazine, 50, 1-13.
- Karl, T.R., Diaz, H.F. and Kukla, G. (1988) Urbanization: Its Detection and Effect in the United States. Journal of Climate, 1, 1009-1123.
- Oguntoyinbo, J.S.C. (1973) Aspects of Urban Micro-Climate: The Case Study of Ibadan. In: Sada, P.O. and Oguntoyinbo, J.S., Eds., Urbanization Processes and Problems in Nigeria, University of Ibadan, Ibadan, 131-140.
- Ojo, S.O. (1981) Land Use Energy Balance Relationship and the Planning Implications in Metropolitan Lagos. Occasional Paper No.1, Department of Geography, University of Lagos, Lagos.
- Ayoade, J.O. (1993) Introduction to Climatology for the Tropics. Reprint, Spectrum Books Limited, Ibadan.
- Blueman, A.G. (1995) Elementary Statistics. A Step by Step Approach. Brown Publisher WCB, Chicago.
- IPCC (2007) Summary of Policy Makers. In: Solomon, S., Qin, D., Manning, M., et al., Eds., Climate Change 2007: The Physical Sciences Basis. Contribution of Working Group 1 to the Fourth Assessment Report of the Intergovernmental Panel on Climate Change, Cambridge University Press, Cambridge.
- Berry, P. (2008) Vulnerabilities, Adaptation, and Adaptive Capacity. In: Seguin, J., Ed., Human Health in a Changing Climate: A Canadian Assessment of Vulnerabilities and Adaptive Capacity, Health Canada, Ottawa, 419-423.