Atmospheric and Climate Sciences
Vol.4 No.1(2014), Article ID:42017,14 pages DOI:10.4236/acs.2014.41011
Research in Agrometeorolgy on Fodder Crops in Central India—An Overview
Indian Grassland and Fodder Research Institute, Jhansi, India
Email: Suchitrai67@Yahoo.co.in
Received June 25, 2013; revised July 24, 2013; accepted August 3, 2013
ABSTRACT
Livestock rearing is one of the major occupations in India and is making significant contribution to the country GDP. The regional and seasonal variations in the teperature and rainfall distribution have been the major factors influencing the economy of a region. It is a matter of serious concern that out of 11 districts of central India, 9 districts are showing increasing trend in maximum temperature with a rate of 0.01˚C to 0.15˚C/year. A significant long-term decreasing trend (Slope = −4.26) was found in annual rainfall series at Jhansi. At Jhansi, moderate to severe drought occurs once in five years. But in the last decade, 7 years experienced moderate to disastrous drought in Jhansi region, wherein rainfall deficiency ranged between 40% and 60% from normal value. Of special mention was the year, 2006, which experienced a worst drought ever recorded for this region. Studies related to crop simulation model was carried out for fodder sorghum and its application for agronomic management and assessing the impact of climate change. Crop modeling studies on forage sorghum (C4) and cowpea (C3) showed increased dry matter biomass by 3% in sorghum but more prominent in cowpea by 46% under elevated CO2 from 330 ppm to 770 ppm. The interaction study of enhanced CO2 and temperature showed prominent negative impact on yields of both the crops. Evapotranspiration and crop coefficient (Kc) of several fodder crops i.e. berseem, lucerne, oat, sorghum, teosinte, maize + cowpea, guinea + berseem were worked out. In berseem, the highest Kc (1.81) was found during 2nd cutting followed by 3rd and 4th cuts. Estimates on irrigation scheduling for the guinea grass + berseem showed that the cropping system requires 7 irrigations at an interval ranging from 13 to 30 days to fulfill the 567.6 mm of water per season as net irrigation under mar soil (black) type whose actual water holding capacity (AWHC) is 175 mm. Similarly, if the cropping system is grown under kabar (AHWC = 140 mm) soil, then it requires nine irrigation with a total water requirement of 591.5 mm at an interval ranging from 10 to 24 days. For integrated pest management (IPM) scheme of lucerne, degree day based model was developed to monitor the lucerne weevil population in central region.
Keywords:Temperature; Rainfall; Trend; Drought; Crop Simulation Model; Climate Change; Validation; Calibiration; Sensitivity Analysis; Climate Risk Management; Evapotranspiration; Crop Coefficient; Degree-Day Model and Growth Models
1. Introduction
Weather or climate is a natural resource and is basic input in agriculture planning and strategies. Indian economy is basically driven by agriculture, which in turn depends upon the vagaries of monsoon. The Indian Southwest monsoon (SWM) of June-September, generally referred to as monsoon, is the principal rainy season in India which caters to the agricultural and life sustaining needs of the whole country. Also, successful crop production requires suitable combinations of several factors like soil, water crop variety etc. Climate of a place has a crucial role in growth and production of crop plants [1,2]. The agricultural production of the country in 1999’s has touched 204 million tones. The production was achieved by applying irrigation, using chemical fertilizers and hybrid seeds. These practices have attained its limits, which can hardly be further stretched. Each crop has its own weather optimum for the expression of its full yield potential. So knowledge of the influence of weather parameters on growth and yield of crops is essential in successful crop production. The prime objective is to know the effect of meteorological and hydrological factors on agriculture and to apply knowledge of the atmosphere to practical agricultural use [3].
Climate change has emerged as a serious global environmental issue and poses a threat and challenge to mankind. There is also a global trend for increased frequency of drought, as well as heavy precipitation events over the most land areas. Cold days, cold nights and frost have become less frequent, while hot days, hot nights and heat waves have become more frequent [4]. Its negative impacts are more severely felt by poor people in developing countries like India who rely heavily on agriculture and allied livestock sector for their livelihoods and studies indicated that there is a probability of 10% - 40% loss in crop production in India with increase in temperature by 2080-2100 [4-6]. The threat is much higher in semiarid regions due to the predicted increased temperature by 1˚C to 4˚C, CO2 levels from normal to 540 ppm by 2020 and 770 ppm by 2050 and increases in rainfall variability. Agriculture and livestock sector is a source for the global climatic change by emitting green house gases (GHG) as well as a sink by providing ample scope to sequester carbon and reducing GHG emission by innovative management practices. India, home of resource poor farmers supports 70% of its population’s livelihood through agriculture and allied livestock sector. Under these scenarios various weather hazards like drought, flood and desertification necessarily affect food securities which require long-term and short-term planning based on agroclimatic analysis. Post harvest losses, farm produce quality and quantity reduction due to pest/disease infestation and improper and unhygienic environmental conditions that pose a serious reduction of livestock productivity and production require agrometerological assistance. Thus nowaday’s agro meteorological services are increasingly being demanded by the farming communities to cope more efficiently with climate variability and the increases incidence of extreme events. In a broad manner the study of agricultural meteorology helps in: planning cropping systems/pattern, selection of sowing dates/cost effective ploughing, harrowing weeding etc., reducing losses of applied chemicals and fertilizers, judicious irrigation to crops, efficient harvesting of all crops, reducing or eliminating outbreak of pest and disease, efficient management of soils which are formed out of weather. Considerable advances have been made in collection and analysis of weather and climate data, their transformation into information, which can be readily used by the farm sector, has lagged behind. With the advent of information technology, now the dissemination of the information has become fast and information is easily accepted. The present paper enumerates the work on agricultural meteorological aspects related to fodder crops in central India.
2. Different Aspects of Agro-Meteorology
Agriculture meteorology is having different important aspects of study such as Crop weather relationship, Yield Forecasting, Weather forecasting in disaster management, Crop simulation modeling and remote sensing, Hyperspectral remote sensing, Environmental pollutions, Ozone holes, Climate Change: Adaptation and mitigation, Drought Studies and climate variability and change.
Climate and Crop Production: Solar radiation and temperature plays important role in crop production. Any given crop variety has its optimal requirement of/or selective response to the factors of its environment like rainfall/soil moisture supply, day, night or mean air temperature, soil warmth, duration of darkness light intensity etc.
Solar radiation: The visible light and its intensity and quality plays important role to plant life. Plants are classified as Sciophytes (shade loving plant) and Heliophytes (sun loving) based on its response to light intensity. Quality of light is more important, red light is favorable light for the growth followed by violet blue. The response of plants to the relative length of the day and night is known as photoperiodism. The plants are classifieds on the extent of response to day length are long day plant that is cereals wheat and barley, short day plant are millets and maize and day neutral plants i.e. tomato, cotton.
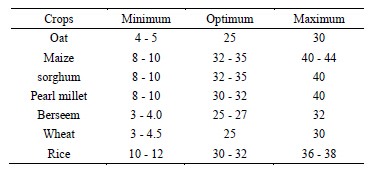
Temperature: Air temperature is the most important weather parameters because of physical and chemical process within plants are governed by temperature and in turn control biological reactions. Every plant has its own maximum, optimum and minimum temperature limits for its normal growth and reproduction. These three levels are known as cardinal temperature (Table 1).
In India two major fodder crops are important and being cultivated in large scale i.e. sorghum (Sorghum bicolor L.) in kharif (July to October) season and oat in rabi
(November to April) season. Their climatic requirements and agro meteorological implications are given below.
Sorghum crop: Sorghum requires warm weather for development and it cannot grow properly or set seed at temperatures below 18˚C - 21˚C [7]. It cannot recover from freezing temperature except in the juvenile stage [8]. It can adequately recover from drought and also withstand flooding. Sorghum has very efficient photosynthesis mechanism and shows little photorespiration.
Germination: The minimum temperature for germination of sorghum is 7˚C to 10˚C [9], while optimum is 18˚C to 21˚C [10]. Recommended sowing time is when the soil temperature at sowing depth at sunrise reaches 20˚C Weather requirements for Growth and development: The sorghum life cycle is divided into three stages for consideration of its ecological relationship. These are 1) Sowing to panicle initiation 2) Panicle initiation to bloom 3) Bloom to physiological maturity.
1) Sowing to Panicle Initiation: Sorghum are short day (or long night) plants. The work of miller et al. [11] shows that while long nights hasten the flowering in tropical varieties, nights as short as 11 hours do not delay the flowering of temperate zone varieties. Minimum temperature for growth is 15˚C, while the optimum range is 27˚C - 30˚C. Temperature above 38˚C is harmful.
2) Panicle initiation to bloom: The crop at the bootleaf stage is very sensitive to temperature. Under optimum photoperiod the temperature will be a dominant factor controlling flowering while with optimum temperature regimes photoperiod would become very important. However, as pointed out by Coleman and Belcher [12] thermal requirements must be met before photoinduction take place.
3) Bloom to physiological maturity: The soil moisture regime during the period is most important and temperature regimes come into play under adequacy of soil moisture only. Mean temperature during this period should be less than 26˚C, while maximum temperature should be less than 38˚C. The accumulated growing day degree requirements in excess of 10˚C for sorghum are 145 for seedling establishment 440 for ear differentiation, 730 up to bud leaf, 880 up to half bloom 1025 up to dough stage, 1170 up to hard kernel stage and 1315 for maturity [13].
Agro meteorological Implications: A detailed study of the rainfall on short period basis is required to identify for the benefit of the breeder the possible growing season for the vegetative duration of the crop and to locate mid season risks for appropriate changes in agronomic strategy. In sowing date trials meteorological conditions throughout the crop season must be monitored and additional crop growth features must be recorded. This would help in evaluation of varieties in terms of desirable or undesirable photo and thermo sensitivity from the point of view of adaptation to local climate and weather vagaries.
Oat (Avena sativa L.) is a cool season crop that requires cool temperatures from germination through grainfilling for maximum yield. The optimum growing temperature is around 16˚C - 20˚C. Sorrells and Simons [14] reported an optimum of 13˚C - 19˚C for high grain and straw yields. The length of the grain-filling period was reduced by more than 50% if the temperature was increased from 9˚C to 24˚C. Cold temperature requirements had a greater influence on heading date and the duration of the vegetative period than day length. The results further demonstrated that day length insensitive forms occurred in the south Mediterranean region and adjacent southern territories [15].
3. Agro-Climatic Analysis of Weather Parameters in Bundelkhand Region of Central India
The surface climatic parameters (such as rainfall, temperature, relative humidity, wind speed, bright sunshine and evaporation) have proved extremely useful in planning research experiments, soil water management and for developing future strategies for management of natural resources for optimum agricultural production Knowledge of the agro climatic features is a prerequisite for agricultural planning in any area. The regional and seasonal variations in the rainfall distribution have been the major single factor influencing the economy of a region. In view of this variability and trend in weather parameters of 11 districts i.e. Bundalkhand region of central India have been analyzed.
3.1. Trend in Maximum and Minimum Temperatures
It is a matter of serious concern that nine districts (Jhansi (Figure 1), Mahoba, Sagar, Datia, Banda, Jaluan, Shiv-
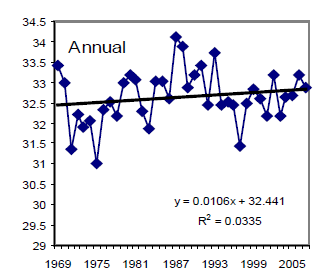
Figure 1. Trend in maximum temperature at Jhansi.
puri, Guna and Damoh) out of 11 districts are showing increasing trend in maximum temperature with the rate of 0.01 to 0.15˚C/year. However, Chatterpur and Tikamgarh showed decreasing trend in day time temperature. As regards the minimum temperature, five locations (Mahoba, Sagar, Chatterpur, Tikamigarh and Damoh) is showing increasing trend with a rate ranging from 0.025˚C to 0.20˚C. Rest of the six locations (Jhansi, Banda, Shivpuri, Guna, Jaluan and Datia) showed decreasing trend in minimum temperature.
3.2. Seasonal Variability in Evaporation and Bright Sunshine Hours
The mean annual evaporation rate during kharif (26 - 41 Standard Meteorological Week (SMW)), rabi (42 - 15 SMW) and summer season (16 - 25 SMW) were 5.5, 4.8, 3.6 and 11.1 mm/day with a standard deviation of 0.46, 0.97, 0.35 and 1.28 mm/day for the respective seasons. The mean evaporation pattern showed no significant and systematic trend in annual and rabi seasons. However, in kharif a slight increasing trend in evaporation (y = 0.036x + 4.51) was noticed whereas, in summer a decreasing trend (y = −0.050x + 11.5) was observed. The climatologically normal of bright sunshine for annual, kharif, rabi and summer season were 7.8, 5.9, 8.7 and 8.9 hours/day, respectively [16]. The annual and summer trend shows a decreasing trend which is more pounced during summer (y = −0.108x + 9.85). However kharif and rabi season did not show any significant increasing or decreasing trend.
3.3 Characteristics of Rainfall in Bundelkhand Region
3.3.1. Monthly Rainfall
The South west (SW) monsoon commence by 26th SMW (June 25-2 July) and ends by 37th SMW (Sept., 10-16). The mean annual rainfall of Bundelkhand region is 1006.6 mm with spatial standard deviation (sd) of 144.5 mm and coefficient of variation 143.6%. Most of the rainfall received during June to October accounting 93.7% of the total rainfall of which July receives 33.8% (360.8 mm) followed by August (28.3%), September (14.3%). Almost all the districts received maximum rainfall during July, followed by August. Rainfall during July ranged from 269.1 (Jalaun) to 460.5 mm (Sagar) accounting 32 to 36% of their normal rainfall. Maximum monthly rainfall variability was observed at Lalitpur (sd = ±46.7 to ±94.8 mm) followed by Sagar (sd = ±55.6 to ±88.8 mm) and Damoh (sd = ±52.6 to ±80.4 mm) districts during rainy season (July to September). The distribution of rainfall is often erratic and even wet months (July and August) many time experience long dry spell due to break in monsoon during 33 - 35th SMW. Maximum unstable rainfall with duration of 19 days (27 July to 15 August) was found at Banda followed by 18 days (16 July to 2 August) at Guna.
3.3.2. Annual and Seasonal Rainfall and Its Trend in Different Districts of Central India
The average annual rainfall ranged between 769.3 to 1251 mm being lowest at Datia and highest at Sagar. High degree of variability was observed in both annual (Standard deviation (sd) = 389 mm & coefficient of variation (cv) = 38.1%) and Kharif (sd = 360 mm & cv = 38.3%) rainfall series at Lalitpur followed by Mahoba and Datia. The average Rabi rainfall ranged between 44 to 108 mm in this region having sd of 38.7 to 133 mm and cv of 70% to 132%. A significant decreasing amount was noticed in the mean annual rainfall particularly during the latest 30 years (1980-2009) as compared to past 30 years (1941- 1970) at Lalitpur, Jalaun and Hamirpur. The reduction in annual rainfall was found to be 280.5, 137.9 and 128 mm from their normal annual rainfall values for above respective locations. A significant long term decreasing trend was found in annual rainfall series of Lalitpur, Jalaun, Hamirpur, Tikamgarh and Damoh Jhansi (Figure 2), whereas Chatterpur has shown an increasing trend in annual rainfall (fig not shown). At Jhansi, Gaussian low pass filter, LPF0 curves indicated that the trend was not linear, but oscillatory in nature consisting of periods between 5 to 10 years. The last section of low pass filter (LPF) curves for the period 1998 onwards shows a decreasing trend in annual rainfall. However, a significant long term decreasing trend (Slope = −4.26) was found in annual rainfall series (Figure 2).
A study was conducted in eleven locations of Bundelkhand region to work out and document the drought intensity and frequency in these areas. Among the different locations, Lalitpur showed maximum drought probabilities i.e. once in three years. Whereas, the disastrous drought (more than 50% rainfall deficit than normal) occurs once or twice in two to five decades s at Banda, Hamirpur, Lalitpur, Guna, Damoh Sagar and Chatterpur.
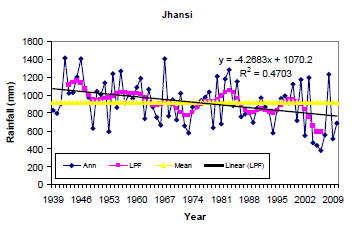
Figure 2. Trend in annual rainfall at Jhansi.
Moderate drought is a recurring feature at Tikamgarh with probability of once in six years. The changing trend is investigated for annual rainfall series of Jhansi using historical data for the period of 70 years (1939 to 2008). Out of 70 years, 36 years received below normal rainfall in the range of 2.5% to 60.4%. At Jhansi, moderate to severe drought occurs once in five years. But in the last decade, 7 years experienced moderate to disastrous drought in Jhansi region, wherein rainfall deficiency ranged between 40% and 60% from normal value (Figure 3). Of special mention was the year, 2006, which experienced a worst drought ever recorded for this region. The intensified frequency of droughts leads to decreased sorghum production, with maximum decrease i.e. 67% in the year 2002. Looking into these changes, adaptive measures are essential to mitigate the climatic changes observed into this region which has also been emphasized in recent international conference on climate change in Bali that even the most stringent mitigation efforts cannot avoid further impacts of climate change in the next few decades, which makes adaptation essential. Therefore, country has to urgently strengthen the adaptive capacity of the people and the life support systems. The possible adaptive activities include reducing vulnerability of dry lands, rainwater harvesting, development of drought resistant crop varieties and integrated land and water management with special focus on developmental issues such as strengthen alternative livelihoods.
3.3.3. Weekly Rainfall Probability in Different Districts of Central India
The study revealed that initial (P(W)) and conditional (P(W/W)) probabilities of getting 10 mm rainfall during 24th to 26th SMW was varied from 59% - 61%. An amount of 10 mm rainfall per week can be taken as the minimum requirement for seedbed preparation of rainfed kharif crops. The P(W) and P(W/W) for 20 mm rainfall during 27 to 28th SMW varied from 69% to 78%. The
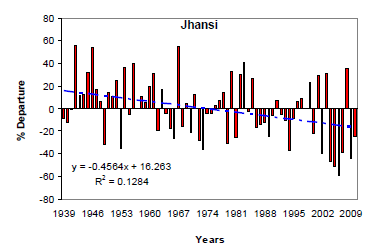
Figure 3. Percentage departure of annual rainfall from the normal at Jhansi.
probability of getting 40 mm rainfall was more than 50% in 27th SMW and continued up to 35th SMW. The highest probability (73%) of getting 40 mm rainfall is during 33rd SMW. Also, rainfall >10 mm per week could be expected at 75% probability in 27th SMW (Table 2). However, rainfall > 20 mm per week could be expected with 60% probability in 27 to 35th SMW. Hence for dry seeding, 26th SMW may be preferred for Jhansi region and 27th SMW for normal sowing [17]. The intermittent rains between 10 and 20 mm (Table 2) were also expected at 70% level during 27 to 34th SMW, which helps in growth of kharif crops. Similarly at Datia, the probability more than 10 mm during 26th (25 June-1 July) and 27th SMW (2-7, July) suggested to initiate field preparation operation for Kharif crops and sowing in subsequent week due to assured probability (70%) of more than 20 mm rainfall. The 27th and 28th (8-15, July) SMW is also an ideal time for the crop fertilization. Overall expected rainfall for getting more than 20 mm rainfall at 70% probability level is for 10 weeks at Datia suggesting that short duration varieties of various crops can be ideal in the region. At Jalaun, the field operation may be one week delay than Datia due to late onset on monsoon[18] Therefore, the ideal combination of crops of the regions may be sorghum for the grain purpose intercropped with cowpea for the fodder purpose as livestock is an integral part of rainfed rural economy. At Sagar, the expected rainfall is 11.4 mm during 26th SMW suggesting field preparation and subsequent week for sowing of the crop.
4. Crop Simulation Modelling
The natural resource management is an important aspect
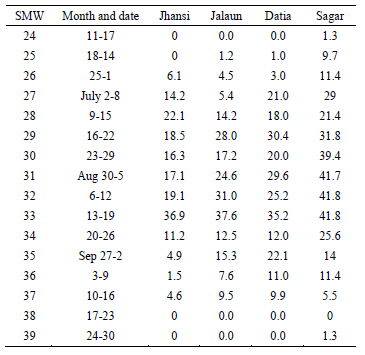
Table 2 . Expected weekly rainfall amount at 70% probability level in different location.
in agricultural production. In the present context of climate change, there is possibility of decrease in crop yield in tropical and subtropical agriculture in future. Thus a crop growth simulation model not only predicts the final state of total biomass or harvestable yield but also contains quantative information about major processes involved in the growth and development of plant [19,20]. Thus a sophisticated crop model can simulate the effects of weather, soil water and nitrogen dynamics in the soil on growth and yield for the specified cultivar. In view of the above the study has been carried out keeping the following objectives to calibrate and validate the CERESsorghum model embedded into DSSAT (Decision support system for agro-technology transfer) and its application in agronomic management and to assess the impact of climate change on forage sorghum and cowpea
4.1. Calibration and Validation of CERES-Sorghum Model
An attempt has been made to calibrate and validate CERES-sorghum model for forage sorghum crop in semiarid region of In order to be truly generic, any model should be able to predict development and growth of any genotype, grown at any location, in any season. To accomplish this, simulation models should contain a set of genetic coefficients. Calibration is the process of modifying certain model parameters to more closely reflect local weather and soil conditions etc., Thus, calibration is required before validation, which adjusts certain model parameters or relationships to make the model work for site or sites. India. The genetic coefficients of forage sorghum were obtained based on field experiment and shown in Table 3 for forage sorghum [21].
An attempt has been made to validate CERES-Sorghum model for two forage varieties i.e. PC-6 and HC-136 sown in three different dates at Jhansi during 1996 and 1997. The deviation of simulated anthesis date (50% flowering, number of days between planting and the data when half of the heads of a given cultivar had some florets in bloom) from observed was +1, −1 and +46 for D1 (11.07.1996), D2 (1.08.1996) and D3 (6.09.1996) sowings for cv. PC-6 and −2 and +42 days for D1 and D3 sowings for cv. HC-136, during 1996. Anthesis for first two date of sowing was predicted well, but the greatest error in simulating bloom date occurred during third date of sowing, which had a simulated bloom date of 120 days after planting, compared with an actual bloom date of only 96 days after planting. According to the field situations, these plants were under severe water deficit condition from the panicle initiation to maturity. This variation may be attributed to lower than normal temperature and moisture deficit experienced by the crop.
Based on the bias and RMSE criteria (combining both years data and excluding D3 sowing), agreement between simulated and actual dry biomass was reasonably good (BIAS = 68.7 g/m2 and RMSE = 110.3 g/m2 for PC –6 and Bias = 20.3 g/m2, RMSE = 120.3 g/m2 for HC-136). Regression was fitted between observed and simulated dry biomass and leaf area index (LAI) for both the varieties by taking all harvest sample data for both the years (Excluding D3 sowing). The model accounted for 94(74) and 94(69)% of the variability in dry biomass (LAI) for PC-6 and HC-136 respectively at Jhansi. As regards significance of slope and intercept for dry biomass, it is found that the slope did not differ significantly from 1 for both cultivars. Model is able to predict LAI reasonably well since slope (0.90 - 0.98) and intercept (0.72 - 0.80) for LAI for both varieties did not show and difference from 1 and 0 respectively [22].
Capability of CERES-Sorghum model in response to nitrogen level was also studied at Jhansi. At Jhansi, The deviation in total dry biomass(TDM) predicted was within the range of −3% to +13%, −12% to 23%, and −13% to +20% for N40 (40 kg nitrogen/ha), N80 (80 kg nitrogen/ha) and N120 (120 kg nitrogen/ha), respectively. The bias (Root Mean Square Error (RMSE)) statistics were found to be 494.4 (1032.9), 479 (1018) and 455.6 (1023.7) kg/ha corresponding to N40, N80, and N120 level of Nitrogen irespective of variety and date of sowing. Thus it indicates
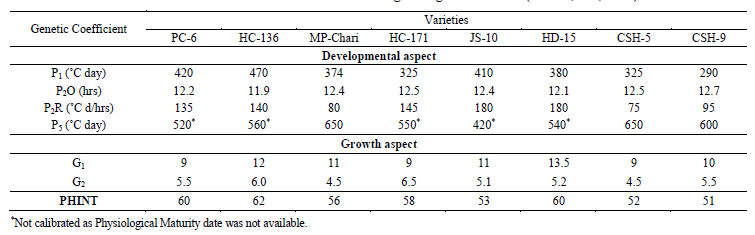
Table 3 . Genetic coefficients for the Indian forage and grain cultivars (Source; Rai, 2001).
*Not calibrated as Physiological Maturity date was not available.
that model slightly overestimates TDM at each level of nitrogen, but it is under reasonable limit. The model accounted for 68%, 76% and 80% of the variability in TDM for the respective level of nitrogen [23]. The model can act as a useful tool for informing policy makers about the extent of variation in forage yield that can be expected within combination of different treatments.
4.2. Analyzing Climatic Risk to Forage Sorghum Production in Semi-Arid Region of India: Effects of Cultivar and Planting Date
The decision-making capacity of farmers and resource planners would be greatly enhanced if they had some means of quantifying the range of likely outcomes and the risk associated with particular strategies. This could be achieved by coupling a crop growth model to longterm sequence of climatic data to generate probabilities of crop yield of different climatic conditions, cultivars, and management practices [24].
4.2.1. Mean Dry Matter Yield
Production risk varied with dates of sowing and cultivar maturity was analyzed of Jhansi district and shown in Table 4 [25]. For the medium maturing cultivar (MPchari) at Jhansi, mean total dry matter showed little variation ranging from 6.6 to 7.2 tonnes/ha with a standard deviation (sd) of 0.9 to 1.2 tonnes/ha, if crop sown during 25 June to 25 July. Thereafter, total dry matter decreased significantly to the tune of 6.3 tonnes/ha in crop sown on 5 August. Mean total dry matter for late maturing cultivar (HC-136) in response to date of sowings were similar to those of “MP Chari” at all location but with higher average dry matter. The highest total dry matter recorded in crop sown on 15 June was at par with the sowing done during 25 June to 15 July but significantly more than all other sowings at Jhansi.
4.2.2. Probability Distribution of Dry Matter in Response to Sowing Dates
Effect of early sowing (15-25 June): Crop sown during 15 and 25 June is considered as early sowing. climatic variation caused fluctuations in total dry matter of late maturing cultivar “HC 136” which exceeded by more than 4.1 tonnes/ha at Jhansi and 7.5 tonnes/ha Akola. Frequency distribution analysis indicated that in 50% of the years above ground dry matter (values given are mean of two sowings) exceeded 8.9 and 11.2 tonnes/ha for Jhansi and Akola respectively. The total dry matter variance index (TVI) were 21.9% and 5.3% for the respective locations showed low stability of forage dry matter at Jhansi as compared to Akola (high stability). Similar pattern were observed for total dry matter of “MP Chari” in response to planting time but total dry matter level were lower than “HC 136” in all years. Medium maturing forage sorghum variety showed higher stability as compared to late maturing variety at Akola as compared to Jhansi during early sowing.
Table 4. Mean dry matter (tones/ha), percent years with water stress and TVI of forage sorghum at various locations and dates of sowing (Source; Rai et al. 2006).
Values in the parenthesis indicates the standard deviation; WS: % of years when water stress between Panicle initiations and Anthesis affected total dry matter.
Effect of normal sowing (5 and 15 July). Total dry matter varied between 4.2 - 11.0, and 7.3 - 12.1 tonnes/ha at, Jhansi and Akola respectively for cultival HC-136. Difference of TDM between 25% and 75% probability level were lower (2.1 tonnes/ha) at Jhansi as compared to Akola (3.5 tonnes/ha) during normal sowing than early sowing indicating smaller production risk during normal sowing than early sowing for late maturing cultivar at Jhansi. The index of total dry matter variance was less than 20% at Jhansi indicating higher stability and better performance over the years, whereas, Akola showed lower stability of these sowings due to relatively higher values of TVI (20.5% to 33.3%) as shown in Table1 With regards to medium maturing forage variety “MP Chari”, total dry matter was decreased slightly (0.2 to 0.3 tonnes/ha) for 5 and 15 July sowing compared to early sowing at Jhansi. Again, medium-maturing variety shows lower TVI than late maturing cultivar indicating lower risk in its production.
Effect of late sowing (25 July-5 August): Frequency distribution analysis indicates that at 50% probability level, late maturing cv “HC-136” exceeded by 7.3 and 8.1 tonnes/ha at Jhansi and Akola respectively. Total dry matters were lower in late sowing as compared to normal sowing in all years. The maximum reduction (16.5%) in total dry matter was noted at Jhansi, followed by Akola (26.0%) at 50% probability level. Thus analysis revealed that late sowing had lower total dry matter as well as increased vulnerability to weather. For these locations difference in above ground dry matter between 75% and 25% probability level ranged between 3.9 and 4.5 tonnes/ha being highest at Jhansi. However, the late sowing resulted in low above ground dry matter than early and normal sowing in all years at all locations. While in medium maturing cultivar (Figure 1), above ground dry matter at 50% probability level was found to be 6.2 and 8.0 tonnes/ha at Jhansi and Akola respectively. At 75% probability level, the difference of total dry matter of “MP Chari” between normal and late sowing was comparatively higher (1.9 tonnes/ha) at Jhansi. Thus late sowing of medium maturing cultivar at Jhansi had lower total dry matter and high risk to weather. However, Medium maturing cultivar produced low total dry matter than late maturing cultivar at any given level of probability. But TVI suggests that medium maturing cultivars are highly suitable over the years and low production risks (Table 4). However at Akola, total dry matter was higher in all years during late sowing as compared to normal/or early sowing indicating no risk to weather condition [25].
Overall the simulations analysis showed that in these variable environments there is a clear advantage in all years by selecting a late maturing cultivar at Akola and Jhansi during early and normal sowing. The present analysis has shown the extent of variation in total dry matter likelihood’s with different sowing times at these locations. This provides a basis for farmers to decide a given sowing opportunity to obtain a target total dry matter with a specific degree of risk.
4.3. Impact of Climate Change on Forage Sorghum and Cowpea at Jhansi
In India, 70% of total fodder grown region is rainfed and vulnerable to climatic variability. The fodder crops are required round the year and cover C3 to C4 plants. The literature shows varied responses of enhanced temperature and CO2 level on C3 and C4 plants (Figures 4 to 6). Crop modeling studies on forage sorghum (C4) and cowpea (C3) showed increased dry biomass at anthesis (DBM) and grain yield (GY) by 3% and 10.5, respectively in sorghum under elevated CO2 from 330 ppm to 770 ppm (Figure 4). Enhanced temperature (B maximum temperature by 2.5˚C and minimum temperature by 2.0˚C) over the normal, impact was negative on DBM and GY by 8% and 18% respectively (Figure 5). Further, increase in temperature had more negative effect on DBM and GY. Interaction of increased CO2 (540 ppm) and Temperature (B; maximum temperature (MaxT) by 2.5˚C and minimum temperature (MinT) by 2.0˚C) had also negative
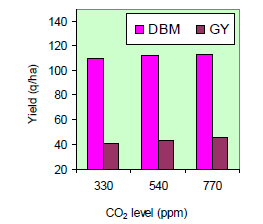
Figure 4. Sole effect of CO2 level.
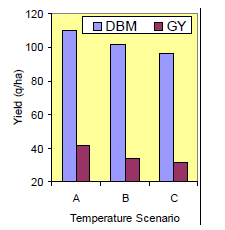
Figure 5. Sole effect of temperature (A = Mean Temperature, B: MaxT = 2.5˚C, MinT = 2.0˚C rise above the normal, C: MaxT = 3.5˚C, MinT = 3.0˚C rise above the normal).
effect and GY decreased by 13.2%, it indicates that positive effect of CO2 is cancelled out by negative effect of temperature (Figure 6). The cowpea DBM and GY also increased by 46% and 20% respectively under elevated CO2 (770 ppm) levels (fig not shown). Similarly, enhanced temperature impact was negative on grain yield by 30% with increase in maximum temperature by 1.5˚C and minimum temperature by 1.0˚C., further increased temperature (maximum temperature by 2.5 and minimum temperature by 2.0˚C) had deleterious impact on the grain yield (90% reduction from normal yield). The interaction study of enhanced CO2 and temperature showed prominent negative impact on yields. Therefore, current study suggests for further in-depth studies on these interactions effect and their adaptation and mitigation strategies. Adaptation strategies including improved climatic resilience through crop improvement programme, innovative crop management practices like adoption of conservation agriculture based practices like in-situ moisture conservation, residue management, better input use efficiency and timely field operations can help in reducing the vulnerability of fodder-livestock ecosystems to climatic changes. The mitigation strategies like changing land use and management for higher crop biomass, adopting conservation agriculture based practices to sequester carbon, avoiding tillage for reducing fuel and energy usage; better nitrogenous fertilizer management, improving grassland and wasteland management, promoting agro-forestry systems can reduce the magnitude of climate change impact in the long term. However, neither adaptation nor mitigation alone can offset all climate change impacts. To respond to this threat it will be necessary to focus both on mitigation (to reduce the level of emission of gases contributing
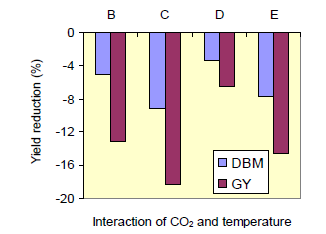
Figure 6. Interaction effect of tnhanced temperature and CO2 level (B: increase in MaxT by 2.5˚C and MinT by 2˚C under elevated CO2 level (540ppm), C: increase in MaxT by 3.5˚C and MinT by 3˚C under elevated CO2 level (540 ppm), D: increase in MaxT by 2.5˚C and MinT by 2˚C B: increase in MaxT by 3.5˚C and MinT by 3˚C under elevated CO2 level (540 ppm) under elevated CO2 level (770 ppm), E: increase in MaxT by 2.5˚C and MinT by 2 under elevated CO2 level (770 ppm).
to global warming) and on adaptation (to support local communities in dealing with the impacts).
5. Evapotranspiration Studies in Fodder Crops
Efficient water management is key to success in augmenting crop production. Reliable estimate of evapotranspiration as a function of crop stage is important for determining crop water use and efficient irrigation management. Evapotranspiration loss and rate of evapotranspiration indicate the amount of water required at different growth period for its satisfactory growth and optimum production. The crop evapotranspiration under standard conditions, denoted as ETc, is the evapotranspiration from disease-free, well-fertilized crops, grown in large fields, under optimum soil water conditions, and achieving full production under the given climatic conditions. In precision weighing lysimeters, where the water loss is directly measured by the change of mass, evapotranspiration can be obtained with an accuracy of a few hundredths of a millimeter. Since the task of improving irrigation management rests upon better understanding of water in the soil-water-plant-atmosphere continuum therefore, the timing and magnitude of reduction in ET become important criteria for irrigation practices.
Berseem (Trifolium alexandrinum)
Berseem an important forage crop of India provides nutritious and platable green fodder to livestock from November to May. It gives 5 - 6 cuts and needs copious irrigation. Using weighing lysimeters, the crop evapotranspiration of berseem was determined [26] for seven consecutive Rabi seasons. The results showed that the total evapotranspiration was 121.6, 82.6, 130.2, 166.7 and 222.1 mm during 1st to 4th cut respectively. The total dry matter yield varied from 1.31 to 3.8 t/ha whereas, the green fodder yield ranged from 12.9 to 18.6t/ha during five cuts. The green biomass increased only upto 4th cut and thereafter, it showed lower value in 5th cut. The estimated water use efficiency of the crop during the seven growing seasons shows that the maximum WUE (19.6 kg DM/ha-mm) coincides with the 3rd cutting. Thereafter it shows a decreasing value for 4th and 5th cuts.
The evapotranspiration rate of berseem crop showed an increasing trend from 1st to 5th cutting, the highest value (7.4 mm/day) corresponding to the last cutting, The average evapotranspiration varied from from 82.6 to 222.1 mm in different cuts (Table 5). In an another study based on three growing seasons, Pradeep Behari and Singh [26] reported that the highest value (8.24 mm/day) of evapotranspiration rate corresponds to fifth cutting which is in accordance with environmental conditions that are likely to affect the evapotranspiration rate greatly. Linear and quadratic equation were established [27] between evapotranspiration and dry matter yield. The crop coefficient
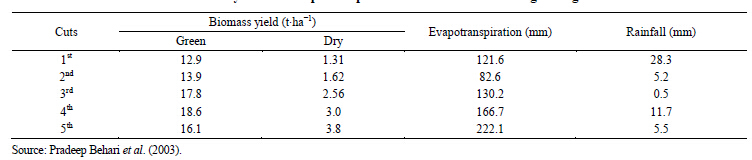
Table 5 . Biomass yield and evapotranspiration of berseem for seven growing seasons.
Source: Pradeep Behari et al. (2003).
(Kc) value at each stages has crossed the unit value (>1.0). The highest Kc (1.81) was found to coincide with 2nd cutting followed by 3rd and 4th cuts. However, the average Kc value for the entire crop duration was found to be 1.54.
Lucerne (Medicago Sativa L.)
Lucerne (Medicago Sativa L.) is a major irrigated forage crop attaining high yields with high forage quality potential. In India, it is grown successfully even in low rainfall areas with assured irrigation. Field experiment conducted on a silty clay loam soil during rabi season with annual lucerne at IGFRI, Jhansi for six consecutive years using weighing lysimeters reveals that the dry matter yield (DMY) increased with the advancement of cutting and a maximum of 3.26 t∙ha−1 was obtained in the 4th cut [28]. The total evapotranspiration losses varied from 101.9 to 224.8 mm in different cuttings The evapotranspiration rate of the crop showed an increasing pattern from first to fourth cutting. Its highest value (7.3 mm∙day−1) corresponds to fourth cutting. The estimated water use efficiency (WUE) for different cuttings ranged (Table 6) from 0.86 to 2.04 kg∙m−3 with a maximum value of 2.04 in second cut. Cutwise water use efficiency of lucerne as a function of evapotranspiration showed a significant (P < 0.05) negative linear relationship.
During first cutting, the Kc varied from a low value of 0.57 for germination phase to a peak value of 1.4 for growth phase having full ground cover [28]. In the subsequent cuts (2nd to 4th) the Kc varied from 0.85 to 0.96 during regeneration phase and from 1.41 to 1.46 during growth phase. This variation in Kc accounts for the change in water consumption with development phases during each growth cycle.
Teosinte (Euchlaena mexicana L.)
Teosinte (Euchlaena mexicana L.) is an important forage crop as it has the advantage of giving very high yields due to profuse tillering capacity. Experiment conducted [29] on a silty clay loam soil during kharif seasons of 2000-2004 to assess the crop evapotranspiration of teosinte using weighing lysimeters reveals that the crop evapotranspiration rate ranges between 3.99 to 7.11 mm/day during different years. However, the average evapotranspiration rate was found to be 5.38 mm/day for entire growth period. The estimated water use efficiency varied from 27.1 to 33.2 kg dry matter/ha-mm with an average of 31.1 kg dry matter/ha-mm. The crop coefficient ranged from 1.04 to 1.66 during different years. The mean value of Kc was found to be 1.31 for entire growth period of teosinte.
Sorghum (Sorghum bicolor L.)
Evapotranspiration rate increased with canopy development upto panicle primordial initiation and declined sharply thereafter, indicating that the peak period of water use in M.P. chari coincides with transitional zone of vegetative and reproductive phases [30,31]. The total evapotranspirational losses were 286.2 mm in dry year and 407.1 mm in normal year with mean ET rate of 5.6 and 6.1 mm/day, respectively (Menhi Lal and Shukla, 1985). The average ET was found to be 346.7 mm with daily value of 5.8 mm. Thus weather conditions and soil moisture status determine to a great extent the ET rate. In another study reported by Pradeep Behari and Hazara [32], it was observed that on average basis the highest ET rate was at boot stage (5.93) followed by the flowering (5.53),vegetative (5.07) and establishment phase (3.90). This indicated that the water requirement of crop during boot stage is quite critical followed by the vegetative phase. The WUE varied between 20.03 to 39.54 kg∙DM/ ha-mm.
Oat (Avina sativa)
The total ET loss varied from 361.9 to 431.0 mm with mean ET rates of 3.80 to 4.36 mm/day over a period of three years [33]. The ET rate in general increased with advancement in crop age up to boot stage and thereafter did not follow a definite trend. The variation in WUE was from 28.5 to 37 kg∙DM/ha-mm with an average of 32.5 kg∙DM/ha-mm. It was also noticed that the dry matter accumulation is proportionally related with evapotranspiration losses. The crop utilizes only 1/5th to 1/3rd of the total water requirement from sowing to jointing stages whereas the remaining 2/5th to 2/3rd was needed from jointing stage to milk/dough stages suggesting the need of rationalizing irrigation water during later phases of crop growth.
Maize (Zea Maize) + Cowpea (Vigna unguiculta)
Maize is a fast growing, high yielding, palatable and nutritious forage crop. For balanced nutrition, maize is generally grown in association with leguminous crops like
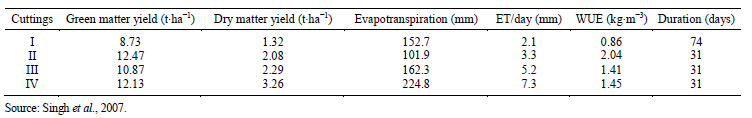
Table 6 . Average yield and evapotranspiration of lucerne for six growing seasons.
Source: Singh et al., 2007.
cowpea, which being rich in protein content forms an ideal combination. The mean crop ET of the intercropping system of maize + cowpea was 152.6, 97.4 and 143.4 mm (Table 7) during knee high, tasseling and silking stages of maize [34]. However, the total ET loss for maize + cowpea was 403.0, 332.7 and 444.7 mm during 1995, 1996 and 1997, respectively. This variation may primarily be attributed to the weather conditions prevailing during different years of the experimentation. The average dry matter accumulation of the component crops was recorded to be 2.85 t∙ha−1 for maize and 2.80 t∙ha−1 for cowpea. The water use efficiency of the intercropping system varied from 13.37 to 15.81 kg DM∙ha−1∙mm−1 during different years. The crop coefficient of the maize + cowpea system as a whole was found [34] to be 1.50. The higher value of Kc at silk stage corresponds to a higher crop evapotranspiration rate (8.0 mm∙day−1) as compared to knee high (4.4 mm∙day−1) and tasseling (6.4 mm∙day−1) stages. The higher crop evapotranspiration rate at silk stage is in accordance with the environmental conditions that are likely to affect the evapotranspiration rate greatly.
Guinea grass (panicum maximum) + berseem
Guinea grass is a hybrid quality forage crop and it is well adopted and widely grown alone or in association with legumes in many parts of India, particularly in milk shed areas. Management of water resource for enhancing the productivity of agriculture is getting concern worldwide in developing countries like India, were water is the limiting factor. The green and dry matter yield of guinea grass + berseem [35] was 15.71, 20.17, 20.10 and 15.08 t/ha and 2.68, 3.09, 3.45 and 2.72 t/ha from lst to 4th cut respectively. The WUE was found to be maximum (36.39 kg dm/ha mm) during 2nd cut followed by 3rd cut (26.87 kg dm/ha mm). The evapotranspiration for four cut varied from 84.1 to 124.6 mm being highest during 4th cut. The crop coefficient of guinea grass-berseem was found to be 1.26, 1.28, 1.23 and 1.26 from lst to 4th cut respectively. Estimates on irrigation scheduling for the guinea grass + berseem showed that the above system requires 7 irrigations at an interval ranging from 13 to 30 days and 567.6 mm of water per season as net Irrigation under mar soil type whose actual water holding capacity (AWHC) is 175 mm. Similarly, if the cropping system is grown under kabar (AHWC = 140 mm) soil, then it requires nine irrigation with a total water requirement of 591.5
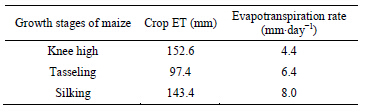
Table 7 . Phenophase-wise evapotranspiration of fodder maize + cowpea (mean of three years).
mm at an interval ranging from 10 to 24 days.
6. Weather and Pests Interactions
Weather has a highly domineering impact on incidence of disease or insect on all crops. Pest and disease management under given crop environment is both weather sensitive and weather information sensitive. Recently, the Integrated pest management (IPM) strategies have acquired importance under the plant protection umbrella, but they are found wanting in terms of utilization of weather information, which can improve their efficacy by many folds. In the above context, the importance of weather based forewarning model of pests can be emphasized by its ability to forecast their attack well in advance to plan for implementation of management schedules. Weather based forecast models can be effectively used for efficiently planning control measures well in time. Such models can reduce the pest control cost compared to prophylactic approach. Further, they would have greater impact of control measures, as a result of advance preparation and better timing of control measures.
Zonate leaf spot disease
The experiment conducted at IGFRI with three varieties of forage sorghum viz., MP-chari, SSG-59-3 and HC-171 shows that the zonate leaf spot started appearing at 10 - 11 days after sowing and its intensity increased gradually. The influence of major weather variables shows that the maximum temperature (>31˚C) coupled with morning relative humidity (>90%) of the previous week was favourable for disease initiation [36]. The high moisture conditions for specific period must have contributed to the initiation of Gloeocercospora sorghi by allowing rapid sclerotial/spore germination and penetration of the host tissue. Correlation analysis (significant at 5% level) with current week, antecedent one and two week’s meteorological variables and zonate severity revealed that antecedent one week maximum temperature (r = 0.52), evening relative humidity (r = 0.54) and sunshine hours (r = 0.67) contributes positively, whereas, minimum temperature (r = −0.79) contributes negatively towards disease development. Therefore, it is observed that both the thermal and hygric factors have influenced the disease growth at all stages.
Growth models for temporal progress
Disease development with time is a dynamic process and quantification of disease progress with time is desirable for many reasons. Logistic and Gompertz were used to fit empirically derived disease progress curves for zonate leaf spot of sorghum [37]. Both the models are capable of explaining >80% variability in disease severity during different years. Therefore, the Gompertz model was the best fit over the years for describing the progression of the disease in the sorghum-zonate leaf spot pathosystem under natural field conditions.
Degree day model for Lucerne weevil
The lucerne weevil, Hypera postica Gyllenhal (Coleoptera: Curculionidae), is the most destructive pest of lucerne, occurring in all the lucerne growing areas of the country and is particularly severe in north-western, western Himalaya, Gangetic and central plains. In India, the aestivating adult weevil makes their appearance in lucerne fields in December and start feeding on leaves. It is active from December to March only. The larva becomes fully grown in 20 to 35 days. The pupal stage is completed within 10 - 15 days. The total life cycle takes 32 to 50 days. Since each stage has its own heat requirement, the development can be estimated by accumulating degree-days from a starting point. The Degree-days (DD) accumulation requirements for different stage of development of lucerne weevil under field conditions are presented in Table8 It is noticed that the hatching of eggs requires 62 DD which takes about 10 days to complete. The larval period of lucerne weevil includes 4 instars and it is completed in 28 days requiring 160 DD (Singh et al., 2009). Therefore, the total DD requirement for lucerne weevil development from egg to adult stage is estimated to be 321 and this development process takes about 49 days in central Indian region [38].
It is observed that the weevil incidence in lucerne crop starts during the last week of December in the field. This information would be useful in monitoring the weevil
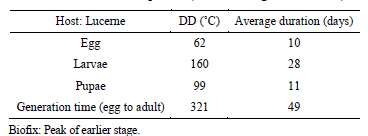
Table 8 . Degree-day accumulations required for each stage of lucerne weevil development (Source: Singh et al., 2009).
Biofix: Peak of earlier stage.
activity and evolving an integrated pest management (IPM) scheme for lucerne management.
7. Conclusions
Weather and climate information is of critical importance in the decision-making process for agriculture, water resources management and environmental conservation. The diversity of soils, hydrological regimes in different countries makes this research challenging but also provides the agro meteorologist the opportunity to make a substantial contribution to the identifications of solutions [39].
• Agro-meteorology has an important role to play in the development of drought preparedness plans which should contain basic components: monitoring and early warning, risk assessment and mitigation and response.
• Climate awareness programme is to be strengthened among the farmers and makes use of strength with enhancing the knowledge of the rural communities regarding the climatic regimes in which they operate and responding to their need for weather and climate information.
• More emphasis needs to be placed on educating the farmers on the applications of weather and climate information and on strategies to cope with the projected climate change through the organization of roving seminars in collaboration with agricultural research and extension agencies.
• Global climate changes and increasing climatic variability may constrain attainment of future production target. Some urgent actions for adaptation are: Strengthen research on development of adverse climate tolerant genotypes and land use system using modern tools. Location specific weather forecasts (both short and medium-range forecasts) and advisories in the local languages should be made available to the farmers for tactical planning, operational decisions and land management practices, early warning of outbreaks of crop pests and diseases. This will help farmers reduce their insecticide and pesticide and protect the environment.
• Potential approaches to mitigation from Indian agricultures are: Appropriate crop management practices for enhancing N-use efficiency and yield and thus ultimately reduces nitrous oxide emission, Carbon sequestration in soils, changes in land use(increase area under bio-fuels and Agro-forestry) and management, adoption of conservation agriculture (minimum tillage, residue retention and organic manures). Resourceconserving technologies such as zero tillage to large arable areas and substantial carbon dioxide could be reduced. Management of livestock diet through use of improved feed additives should be improved.
REFERENCES
- S. K. Rai and J. L. Chaudhary, “Regional Scale Climatic Variation and Their Impact on Agricultural Productivity in the Sub Humid Region,” Indian Journal of Environmental Science, Vol. 2, No. 1, 1997, pp. 45-51.
- S. K. Rai and J. L. Chaudhary, “Trends and Periodicity of Temperature Anomaly of Raipur District for Crop Planning,” Indian Journal of Environmental Science, Vol. 4, No. 1, 1997, pp. 17-25.
- M. C. Varshneya and P. B. Pillai, “Textbook of Agricultural Meteorology,” DIPA, ICAR, New Delhi, 2003.
- P. K. Aggarawal, “Global Climate Change and Indian Agriculture: Impacts, Adaptation and Mitigation,” Indian Journal of Environmental Science, Vol. 78, No. 11, 2008, pp. 911-919.
- G. Fischer, M. Shah and H. van Velthuizen, “Climate Change and Agricultural Vulnerability,” Institute for Applied System Analysis, Laxenburg, Austria, 2002.
- M. L. Parry, C. Iglesias Rosenzweigh, A. M. Livermore and G. Fischer, “Effects of Climate Change on Global Food Production under SRES Emissions and Socioeconomic Scenarios,” Global Environmental Change, Vol. 14, No. 1, 2004, pp. 53-67. http://dx.doi.org/10.1016/j.gloenvcha.2003.10.008
- A. B. Maunder, “Objectives and Approaches to Grain and Forage Sorghum Improvements in the Americas: In Sorghum in Seventies,” Oxford and IBH Pub., Co., London, 1972, pp. 60-100.
- W. H. Leonard and J. H. Martin, “Cereal Crops,” Macmillan and Co., London, 1963, pp. 449-603.
- J. R. Quinby, N. W. Kramer, J. C. Stephens, K. A. Lahr and R. E. Karper, “Grain Production in Texas,” Bull, Vol. 912, Texas Agricultural Experiment Station, 1958.
- R. V. Stoffer and G. E. Van Ripper, “Effect of Soil Temperature and Soil Moisture on the Physiology of Sorghum,” Agronomy Journal, Vol. 55, No. 5, 1963, pp. 447- 450. http://dx.doi.org/10.2134/agronj1963.00021962005500050011x
- F. R. Miller, D. K. Barnes and H. J. Cruzado, “Effect of Tropical Photoperiod on the Growth of Sorghum in 12 Monthly Plantings,” Crop Science, Vol. 8, No. 4, 1968, pp. 499-502. http://dx.doi.org/10.2135/cropsci1968.0011183X000800040032x
- O. H. Coleman and B. A. Belcher, “Some Responses of Sorghum to Short Photoperiod and Variations in Temperature,” Agronomy Journal, Vol. 44, No. 1, 1952, pp. 35-39. http://dx.doi.org/10.2134/agronj1952.00021962004400010010x
- R. E. Nield and M. W. Seely, “Growing Degree Day Predictions for Corn and Sorghum Development and Some Application Crop Production in Neberaska,” Res. Bull., Vol. 280, Agricultural Experiment Station, 1977.
- M. E. Sorrells and S. R. Simons, “Influence of the Environment on the Development and Adaptation of Oat,” In: H. G. Marshall and M. E. Sorrells, Eds., Oat Science and Technology, The American Society of Agronomy, Wisconsin, 1992, pp. 115-163.
- G. Loskutov Igor, “Influence of Vernalization and Photoperiod to the Vegetation Period of Wild Species of Oats (Avena spp.),” Euphytica, Vol. 117, No. 2, 2001, pp. 125- 131. http://dx.doi.org/10.1023/A:1004073904939
- J. B. Singh, P. Behari and S. K. Rai, “Seasonal Variability in Evaporation and Bright Sunshine in a Semi-Arid Region,” Range Management and Agroforestry, Vol. 28, No. 2, 2007, pp. 122-123.
- S. K. Rai, P. Behari, J. B. Singh and R. K. Agrawal, “Rainfall Probability and Water Balance in Relation to Agriculture in Jhansi,” Range Management and Agroforestry, Vol. 28, No. 2, 2007, pp. 120-121.
- S. K. Rai, P. Behari, Satyapriya, A. K. Rai and R. K. Agrawal, “Long Term Trends in Rainfall and Its Probability for Crop Planning in Two Districts of Bundelkhand Region,” Journal of Agro Meteorology, Vol. 14, No. 1, 2012, pp. 74-78.
- G. Algarswamy and J. T. Ritchie, “Modelling Nitrogen Uptake and Response in Sorghum and Pearl Millet,” In: S. M. Virmani, H. L. S. Tandon and G. Algarswamy, Eds., Modelling the Growth and Depelopment of Sorghum and Pearl Millet, Research Bulletien No. 12, ICRISAT, Patencheru, A.P., India, 1989, pp. 8-10.
- R. Kumar, B. R. D. Gupta, K. K. Singh, R. K. Mall and S. K. Rai, “CROPGROW—Soyabean Model for Growth, Development and Yield Prediction for Jabalpur,” Proceeding of the National Work Shop on Dynamic Crop Simulation Modeling for Agrometeorological Advisory Service, NCMRWF, DST, New-Delhi, 1999, pp. 103-118.
- S. K. Rai, “Validation of CERES-Sorghum Model, Its Application in Agronomic Management, Yield Predictions and Impact of Climate Change on Forage and Grain Sorghum in Semi-Arid Region of India,” Ph.D. Thesis, Dept. of Geophysics, BHU, Varanasi, 2001.
- S. K. Rai and B. R. D. Gupta, “Simulating dry Biomass of Forage Sorghum Using CERES-Sorghum Model,” Journal of Agrometeorology, Vol. 6, No. 2, 2004, pp. 201-211.
- S. K., Rai, B. R. D. Gupta and S. Dhar, “Performance of CERES-Sorghum Model in Simulating Forage Sorghum in Response to Nitrogen Levels in Semi-Arid Region of India,” Annals of Agricultural Research, Vol. 26, No. 2, 2005, pp. 240-248.
- R. C. Muchow, G. L. Hammer and R. L. Vanderlip, “Assessing Climatic Risk to Sorghum Production in Water— Limited Subtropical Environments II. Effects of Planting Date, Soil Water at Planting and Cultivar Phenology,” Field Crops Research, Vol. 36, No. 3, 1994, pp. 235-246. http://dx.doi.org/10.1016/0378-4290(94)90115-5
- S. K. Rai, B. R. D. Gupta and S. Kumar, “Simulation as a Tool for Analyzing Climatic Risk to Forage Sorghum Production in Semi-Arid Region of India: Effects of Cultivar and Planting Date,” Indian Journal of Agricultural Sciences, Vol. 76, No. 3, 2005, pp. 153-157.
- P. Behari, J. B. Singh and R. B. Yadava, “Crop Coefficient and Evapotranspiration of Berseem (Trifolium alexandrinum L.) Grown under Semiarid Environment,” Journal of Agrometeorology, Vol. 5, No. 2, 2003, pp. 53-57.
- P. Behari and J. B. Singh, “Evapo-Transpiration and Water Use Efficiency of Berseem (Trifolium alexandrium L.) in a Semi-Arid Region,” The Indian Journal of Agricultural Sciences, Vol. 68, No. 2, 1998, pp.71-72
- J. B. Singh, P. Behari and R. B. Yadava, “On the Estimation of Evapotranspiration, Water Use Efficiency and Crop Coefficient of Lucerne (Medicago sativa L.) in Central India,” Current Science, Vol. 93, 2007, pp. 17-19.
- J. B. Singh, P. Behari and R. B. Yadava, “Evapotranspiration and Water Use Efficiency of Teosinte (Euchlaena mexicana L.) in Semi-Arid Region of Central India,” Range Management & Agroforestry, Vol. 28, No. 2, 2007, pp. 124-125.
- M. Lal and N. P. Shukla, “Evapotranspiration and Forage yield of M. P. Chari in Relation to Growth Stages and Meteorological Conditions,” Indian Journal of Agronomy, Vol. 30, No. 3, 1985, pp. 287-291.
- N. P. Shukla and J. B. Singh, “Water Management for Forage Production Optimization: Retrospect and Prospects,” In: A. K. Dahama, Ed., Agro’s Annual Review of Crop Ecology, Agro Botanica Publishers, India, 1997, Vol. 1, pp. 199-220.
- P. Behari and C. R. Hazara, “Forage Productivity of Sorghum and Oat-Evapotranspirational Studied,” Forage Research, Vol. 15, No. 2, 1989, pp. 162-166.
- M. Lal and N. P. Shukla, “Evapotranspiration and Forage Yield of Oat in Relation to Growth Phases and Weather Conditions,” Indian Journal of Agronomy, Vol. 33, No. 2, 1988, pp. 117-120.
- J. B. Singh, P. Behari and R. B. Yadva, “Evapotranspiration and Crop Coefficients of Maize + Cowpea Intercropping Systems in Semi-Arid Region,” Range Management & Agroforestry, Vol. 23, No. 2, 2002, pp. 152-154.
- P. Behari, S. K. Rai and J. B. Singh, “Irrigation Scheduling of Guinea Grass + Berseem Intercropping Using Crop Coefficient under Different Soil Type at Jhansi,” Range Management and Agroforestry, Symposium Issue (A), 2010, pp. 83-84.
- J. B. Singh, P. Saxena, K. C. Pandey and P. Behari, “Influence of Weather Parameters on Zonate Leaf Spot (Gloeocercospora sorghi) Development on Sorghum,” Journal of Agrometeorology, Vol. 10, No. 2, 2008, pp. 186- 188.
- J. B. Singh, P. Saxena, K. C. Pandey and P. Behari, “Comparing Growth Models for Temporal Progress of Sorghum Zonate Leaf Spot (Gloeocercospora sorghi) Disease,” Indian Journal of Environmental Science, Vol. 86, No. 6, 2010, pp. 527-531.
- J. B. Singh, K. C. Pandey, P. Saxena and P. Behari, “Degree Day Model for Development and Incidence of Lucerne Weevil, Hypera postica (Gyllenhal) in central India,” Current Science, Vol. 96, No. 12, 2009, pp. 1578- 1580.
- M. V. K. Sivakumar, “Agrometerology and Food Security,” Journal of Agrometeorology, 2008, pp. 1-8.