Journal of Diabetes Mellitus
Vol.2 No.2(2012), Article ID:19357,6 pages DOI:10.4236/jdm.2012.22035
Fluorescent advanced glycation end-products (ages) detected by spectro-photofluorimetry, as a screening tool to detect diabetic microvascular complications*
![]()
Institute of Nutrition & Food Technology, University of Chile, Santiago, Chile; #Corresponding Author: mpmaza@inta.uchile.cl
Received 8 March 2012; revised 12 April 2012; accepted 7 May 2012
Keywords: Advanced glycation end-products; ages; microangiopathy; microvascular complications
ABSTRACT
BACKGROUND: Advanced glycation end-products (AGEs) are one of the mechanisms related to diabetic vascular complications. However, since AGEs are multiple and heterogeneous moieties, there is no universally accepted method to measure them for clinical purposes. The aim of this work was to study the utility of a simple fluorimetric assay as predictor of complications. METHODS: Blood samples from 102 type 2 diabetic patients were obtained to assess glucose, glycosylated haemoglobin, creatinine, lipoproteins and C Reactive Protein (CRP), fluorescent AGES by spectrophotofluorimetry and non-fluorescent AGEs by measurement of N(ε)- carboxymethyl-Lysine (CML) using an ELISA kit in a subsample of 82 patients. Urinary fluorescent AGEs, albumin and creatinine were also measured in a morning urine sample. Microvascular complications were studied by ophthalmologic examination, albuminuria and peripheral nerve conduction velocity. RESULTS: Patients without microvascular complications had significantly lower levels of both serum and urinary AGEs. CML was associated with retinopathy. Multiple regression analysis confirmed that AGEs, length of diabetes and glycosylated haemoglobin were all variables associated with diabetic complications, in this sample. CONCLUSIONS: A simple fluorimetric assay to measure low molecular weight fluorescent AGEs, and CML could be employed as screening tools to predict diabetic complications, at a primary care setting. AGEs should probably be considered as another therapeutic target in diabetes management.
1. INTRODUCTION
Advanced glycation end-products (AGEs) are moieties formed endogenously by the non-enzymatic “browning” or Maillard biochemical reaction of a ketone or aldehyde group from reducing sugars such as glucose, with free amino groups from proteins,with further rearrangements, to form stable and undigestible compounds, which crosslink to lysine residues of long-lived proteins, such as collagen. Intracellular sugars such as glucose 6-phosphate and fructose, originate AGEs faster than glucose. If oxidation accompanies glycation (glycoxidation), specific AGEs can be formed, such as pentosidine and Nε-[carboxymethyl]-lysine (CML). The generic term AGEs also includes lipooxidation products formed by a Maillard-type reaction of amino groups and oxidized fatty acids, originating the same final AGEs and protein structural alterations, even in the absence of hyperglycemia. Thus, AGEs can be viewed as a complex and heterogeneous groups of proteins, with different structures, some of which have not been yet identified, while some are intermediate reactive species of glycation or oxidation of fatty acids (i.e. 3-deoxyglucosone and methylglyoxal) [1]. They can also be created exogenously during heating of food, and incorporated though the digestive system and excreted through the kidney [2]. Impaired renal clearance sharply increases serum and tissue concentration of AGEs [3]. Persistent hyperglycemia and oxidative stress increase AGEs in diabetic patients, establishing a vicious cycle of AGEs/free radical formation [4].
In addition to metabolic control, AGEs are even better predictors of diabetic microvascular complications (neuropathy, nephropathy and retinopathy) [5-8], related to the increased stiffness of the protein matrix, thickening of the basal membrane and trapping of lipoproteins within the vascular walls. Also the binding of AGEs to specific receptors (RAGE) activate intracellular signals of the inflammatory cascade [1]. However, which specific AGEs are responsible for these complications is still unknown. Roberts et al. found that mortality in haemodyalisis patients was associated with the fluorescent low molecular weight fraction, derived from degradation of AGE-modified protein (from tissue or diet) [9].
At present, there is no universally accepted method to detect AGEs at a clinical level. Methods such as highperformance liquidchromatography (HPLC), competitive enzyme-linkedimmunosorbent assays (ELISA), and immunohistochemistry have been employed, however no standard unit of measure exists to compare data. Food AGEs have been assessed by measurement of CML by Goldberg et al. [2], through ELISA. Since most AGEs have a characteristic fluorescence, with an excitation maximum approximately at 370, and emission around 445 nm, detection through fluorescence spectroscopyof serum is a widely available method, however less specific. Wröbel et al. developed the flow injection assay (FIA) [10], which employs on-line double spectrophotometric and spectro fluorometric detection, using the flow system of the HPLC equipment. However, since we lack this tandem system, the assay requires the individual injection of the sample by triplicate and then measurement of protein concentration by another method, making it less practical. In this study we treated the serum and urine samples as for FIA (precipitating proteins with TCA, and extracting lipids with chloroform), but measured flurescence and photometry of the remaining low molecular weight fraction, in a 96 plate spectro-photofluorimeter, to see if this simpler method was able to discriminate between patients with or without microvascular complications. Our results indicate that, although less sensitive, this methodology could represent a simple way to screen for microvascular complications in type 2 diabetics.
2. PATIENTS AND METHODS
We invited ambulatory diabetic patients from primary care facilities, with more than 4 years of treatment either with oral anti-diabetic drugs or subcutaneous insulin, aged 30 to 60 years. Exclusion criteria were renal failure (serum creatinine > 1.6 mg/dL), alcoholism, cancer o uncompensated cardiac or pulmonary disease. The study was approved by our local ethics committee and every patient accepted to participate by signing a written informed consent.
A fasting blood sample was obtained to measure serum glucose, glycosylated haemoglobin, lipoproteins and creatinine, using automated methods, and ultrasensitive C Reactive Protein (usCRP) using a DRG Internacional kit. A spot urine sample was also obtained to measure albuminuria and urinary creatinine. AGE concentrations were also measured, after centrifuging the blood and urine samples. For fluorescent AGEs, we employed a 96-plate spectrophotofluorimeter (Spectra Max Gemini EM). Briefly 100 µl of serum, or 200 µl of urine were deproteinized with TCA at concentrations of 0.3 and 0.15 m/L respectively. Then 200 µl chloro form was added, vortexed for 60 seconds and centrifuged at 14,000 rpm. Finally 200 µl of the respective supernatant was placed in each well, in triplicate. Fluorescence intensity was read at 440 nm after excitation at 355 nm. Results were expressed as arbitrary units (AU) corrected by serum proteins (measured by absortiometry at 280 nm) for serum samples and urinary creatinine for urine samples respectively. Intraassay variation coefficients were 8.4% and 4.6% for serum and urine samples correspondingly. To ensure adequate readings of the spectrophotofluorimeter, fluorescence calibration curves were performed using quinine sulfate as standard, which has a similar excitation and emission spectra (360 and 440 nm respectively). In addition, CML concentration was measured in frozen serum samples from 82 of these diabetics, using the competitive ELISA kit from Micro Coat Biotechnologie GmbH, Bernried, Germany. Characteristics of these patients did not differ significantly from the whole sample, except for slightly higher LDL cholesterol concentrations in the entire group.
Diabetic microvascular complications were assessed by microalbuminuria/urinary creatinine (renal involvement was considered with albuminuria > 30 mg/g urinary creatinine), retinal examination by ophthalmologist (grading 1 as no retinopathy, 2 as mild involvement, 3 as moderate lesions and 4 as severe proliferative retinopathy) and measurement of peripheral nerve conduction in a Sinergy 2000 equipment, using normal values from Kimura [11], grading from cero polyneuropathy to mild, moderate or severe polyneuropathy, according to motor and sensitive nerve conduction velocity in lower extremities.
Statistical analysis were performed in Stata for Windows, version 10.0. Distribution of variables was assessed through the Shapiro Wilks test. To analyze the association between the presence and severity of diabetic microvascular complications and specific variables such as AGEs concentration and other metabolic parameters we calculated correlations using Spearman’s coefficient, since most variables were distributed non-parametrically. Frequencies were compared by Fischer’s exact test and comparison of medians between more than 2 groups by Kruskall Wallis 2.A logistic regression was performed between microvascular complications, AGEs concentrations and other variables associated with the former, such as length of diabetes, metabolic control and lipoproteins.
3. RESULTS
We preselected 134 type 2 diabetic patientsto participate in this study. According to the described criteria, we excluded 32 patients for final analysis (3 for suspected glucose intolerance in spite of previous diagnosis of DM2, 1 due to unknown end-stage renal failure, 4 aged >60 years, 14 because duration of disease was unknown or was less than 4 years, and 10 patients that did not complete all the required assessments).
Mean serum and urinary fluorescent AGEs were 4.9 ± 3.5 AU/g protein and 0.016 ± 0.11 AU/g urinary creatinine respectively. When separating according to number of microvascular complications, serum fluorescent AGEs were found to be significantly lower among uncomplicated diabetics (Table 1). CML concentrations averaged 650.1 ± 124.2 ng/mL and its correlation with fluorescent AGEs did not reach statistical significance.
Serum fluorescent AGEs were weakly associated with renal function (r = 0.2, p = 0.046 for creatinine), but did not correlate with age, duration of diabetes, glycosylated haemoglobin, BMI, serum lipoproteins and usCRP.
Likewise, urinary excretion of fluorescent AGEs were not associated with any of the former variables. CML serum concentrations correlated negatively with BMI and triglycerides (rho = −0.3, p = 0.04 and −0.3 p = 0.007 respectively) and weakly with HDL cholesterol (rho = 0.22, p = 0.04). Table 2 shows the factors associated with specific organ involvement in these diabetic patients.
Microvascular complications were highly prevalent: 28% of patients had retinopathy, 33% had albuminuria and 64% had peripheral polyneuropathy, coexisting in many cases. In multiple regression analysis, urinary fluorescent AGEs, years of diabetes and glycosylated haemoglobin remained as the only variables associated with the occurrence of microvascular complications, while serum fluorescent AGEs, years of diabetes and glycosylated haemoglobin remained as variables associated with number of complications (from none to all three of them). As shown in table 3, fluorescent AGEs were also associated with the severity of retinopathy and neuropathy, since lower levels of these AGEs correlated inversely with the magnitude of each complication. For instance, urinary AGE excretion was significantly lower in patients without neuropathy versus mild, moderate or severe
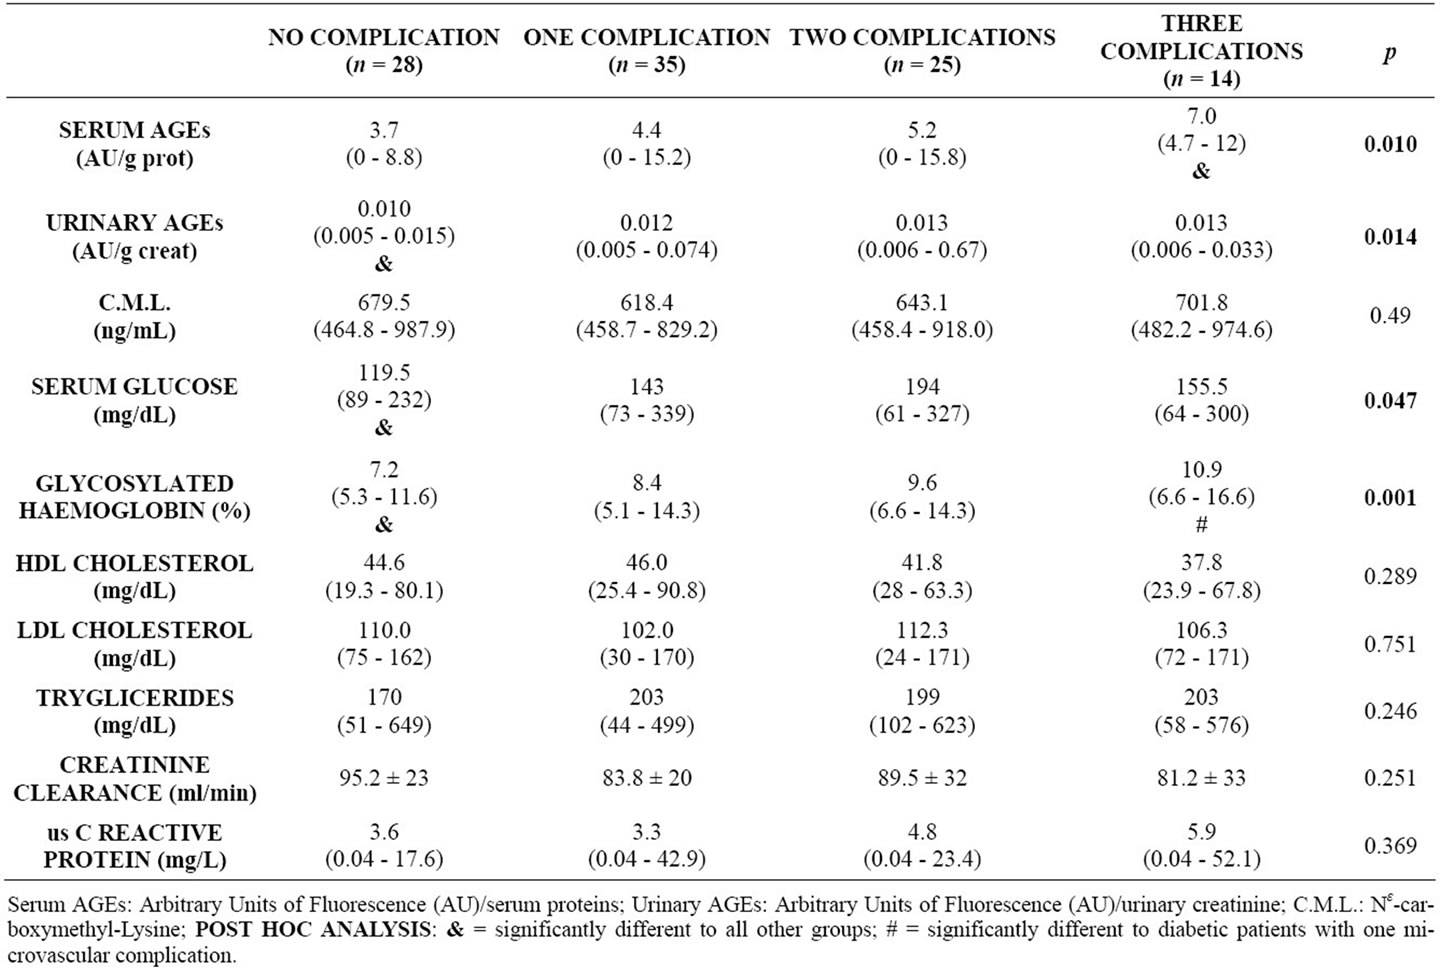
Table 1. Ages concentration and metabolic parameters, grouped according to number of microvascular complications, in diabetic patients.
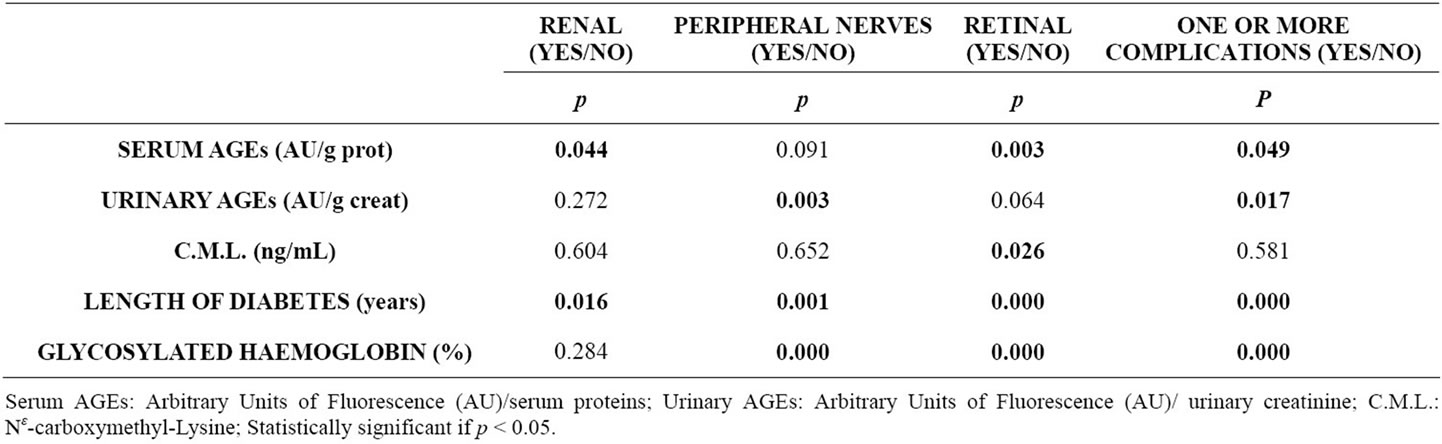
Table 2. Factors associated with microvascular complications in diabetic patients.
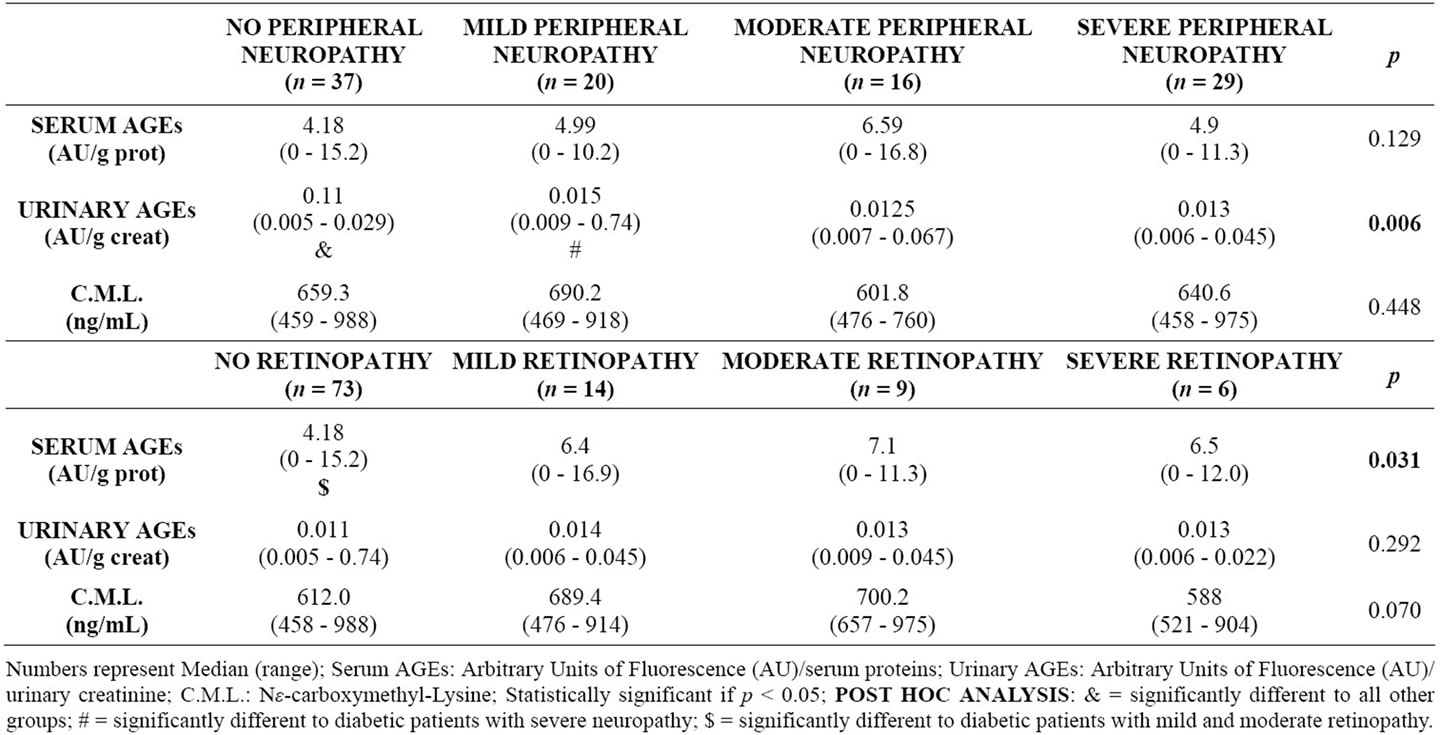
Table 3. Severity of peripheral neuropathy and retinopathy, versus concentration of AGEs.
peripheral neuropathy (p = 0.006), while serum AGEs were significantly lower in patients without retinopathy versus mild, moderate or severe retinopathy (p =0.031). Serum CML concentrations were significantly associated with the presence of retinopathy and not with microalbuminuria or peripheral neuropathy. The regression model for severity of retinopathy included serum CML, years of diabetes and glycosylated haemoglobin (area under the roc curve = 0.8467), while the model for polineuropathy included only urinary fluorescent AGEs and years of disease (area under the roc curve = 0.8235), and the model for degree of albuminuria included only years of diabetes.
4. DISCUSSION
Although serum and tissue accumulation of AGEs have been implicated in diabetic complications and ageing, there is no agreement in the best assay for its measurement, because AGEs are heterogeneous and complex structures, and also because which specific molecule causes which physiopathological disarrangement is still not known. Most studies have employed non-fluorescent CML and also FIA, with tandem photo and fluorimetry, and have reported significant associations between AGEs concentration and diabetic microvascular complications, markers of ageing and oxidative stress [3-9]. However, these methods are expensive and laborious, making them unfeasible for screening purposes at a primary care setting. In the present study we used a simple fluorimetric assay, but first obtaining the low molecular weight fraction, as required for FIA. Since kidney failure impairs AGEs excretion, we excluded patients over 60 years and those with high creatinine concentrations (only 15 patients had creatinine clearance below 60 ml/min, calculated through the MDRD formula), to isolate the influence of serum AGEs concentration irrespective of renal damage, and avoiding artificially low urine AGEs excretion. In a previous study in elderly subjects with relatively preserved renal function, we did not find any relation of diabetes with urinary excretion of fluorescent AGEs (assessed by FIA), but a positive association with protein ingestion [12]. However the methodology employed in the present study is significantly less sensitive compared with FIA, which was demonstrated through a calibration curve with quinine sulphate (data not shown). The spectrophotofluorimetry employed here did not detect concentrations below 0.1 µg/mL, easily read by FIA. In a subsample of these patients we measured CML concentrations through a commercial ELISA kit, and as expected, values were not linearly correlated with fluorescent AGEs, because some AGEs are better associated with certain types of microvascular involvement than others [13]. However CML showed an association specifically with retinal involvement.
In spite of the above mentioned drawbacks, the most relevant finding of this study is that a simple and economical assay could be useful for screening of microvascular complications in diabetic patients. Diabetic patients with undetectable, or low urine concentrations (below 0.015 AU/g creatinine) or serum AGEs below 8.5 AU/g protein, have a lower probability of microvascular damage. However, it is important to point out that spot urine samples should be obtained in first or second morning samples, since assays obtained after noon had a variability up to 75%. We did not obtain repeated blood samples to study day to day variability of serum fluorescence.
Although the relation between serum AGEs and microvascular complications shows extensive overlap, the more accepted and well-known predictors of vascular damage, usCRP and glycosylated haemoglobin behaved worse (figure 1).
Apart from diabetes and renal function, AGEs are critically dependent on dietary intake, as has been largely demonstrated by Uribarri et al. [14,15]. However, in these patients we did not measure dietary AGEs, which requires the analysis of numerous local foods and preparations, and to measure both fluorescent AGEs and CML. Preliminarly we have observed that consumption of powdered milk explains up to 20% of CML serum concentration in type 2 diabetics (unpublished data). Our group continues to investigate on this area, because numerous studies also confirm that “westernized” dietary patterns, with high intakes of processed foods, increase circulating, urinary and tissue AGEs [16-18], and adversely affect the expression of receptors, activating de
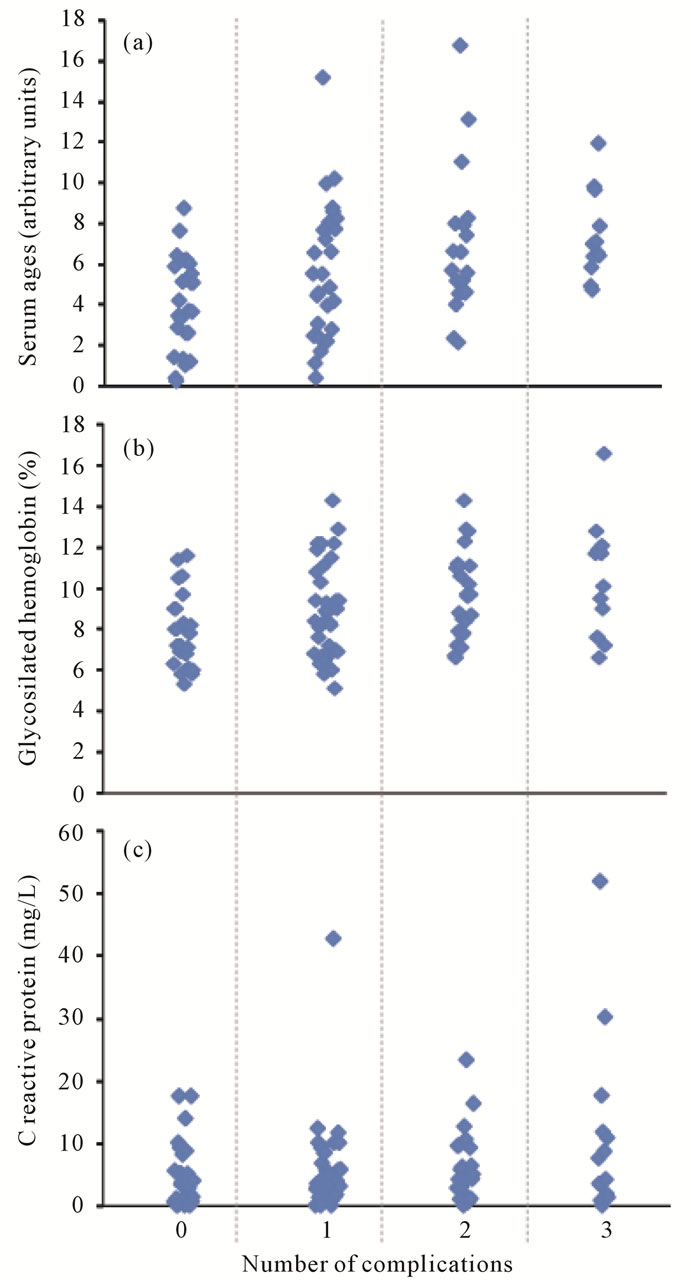
Figure 1. Factors associated with number of microvascular complications in diabetic patients. (a) = Advanced glycation end-products; (b) = Glycosilated hemoglobin; (c) = C reactive protein.
inflammatory cascade [19]. This is extremely relevant for the growing diabetic population, rapidly increasing among Latin Americans.
![]()
![]()
REFERENCES
- Singh, R., Barden, A., Mori, T. and Beilin, L. (2001) Advanced glycation end products: A review. Diabetologia, 44, 129-146. doi:10.1007/s001250051591
- Goldberg, T., Cai, W., Peppa, M., Dardane, V., Baliga, B.S., Uribarri, J. and Vlassara, H. (2004) Advanced glycoxidation end products in commonly consumed foods. Journal of the American Dietetic Association, 104, 1287- 1291. doi:10.1016/j.jada.2004.05.214
- Thomas, M.C., Tsalamandris, C., MacIsaac, R., Medley, T., Kingwell, B., Cooper, M.E. and Jerums, G. (2004) Low-molecular-weight AGEs are associated with GFR and anemia in patients with type 2 diabetes. Kidney International, 66, 1167-1172. doi:10.1111/j.1523-1755.2004.00868.x
- Forbes, J.M., Soldatos, G. and Thomas, M.C. (2005) Below the radar: Advanced glycation end products that detour “around the side”. Is HbA1c not an accurate enough predictor of long term progression and glycaemic control in diabetes? Clinical of Biochemistry Reviews, 26, 123-134
- Genuth, S., Sun, W., Cleary, P., Sell, D.R., Dahms, W., Malone, J., Sivitz, W. and Monnier, V.M. (2005) Glycation and carboxymethyllysine levels in skin collagen predict the risk of future 10-year progression of diabetic retinopathy and nephropathy in the diabetes control and complications trial and epidemiology of diabetes interventions and complications participants with type 1 diabetes. Diabetes, 54, 3103-3111. doi:10.2337/diabetes.54.11.3103
- Sampathkumar, R., Balasubramanyam, M., Rema, M., Premanand, C. and Mohan, V. (2005) A novel advanced glycation index and its association with diabetes and microangiopathy. Metabolism, 54, 1002-1007. doi:10.1016/j.metabol.2005.02.017
- Grossin, N., Wautier, M.P., Meas, T., Guillausseau, P.J., Massin, P. and Wautier, J.L. (2008) Severity of diabetic microvascular complications is associated with a low soluble RAGE level. Diabetes Metabolism, 34, 392-395. doi:10.1016/j.diabet.2008.04.003
- Gerrits, E.G., Lutgers, H.L., Kleefstra, N., Graaff, R., Groenier, K.H., Smit, A.J., Gans, R.O. and Bilo, H.J. (2008) Skin autofluorescence: A tool to identify type 2 diabetic patients at risk for developing microvascular complications. Diabetes Care, 31, 517-521. doi:10.2337/dc07-1755
- Roberts, M.A., Thomas, M.C., Fernando, D., Macmillan, N., Power, D.A. and Ierino, F.L. (2006) Low molecular weight advanced glycation end products predict mortality in asymptomatic patients receiving chronic haemodialysis. Nephrology Dialysis Transplantation, 21, 1611-1617. doi:10.1093/ndt/gfl053
- Wróbel, K., Wróbel, K., Garay-Sevilla, M.E., Nava, L.E. and Malacara, J.M. (1997) Novel analytical approach to monitoring advanced glycosylation end products in human serum with on-line spectrophotometric and spectrofluorometric detection in a flow system. Clinical of Chemistry, 43, 1563-1569.
- Dumitru, D., Amato, A.A. and Zwarts, M.J. (2001) Electrodiagnostic medicine. 2nd Edition, Hanley & Belfus, San Antonio.
- De la Maza, M.P., Bravo, A., Leiva, L., Gattás, V., Barrera, G., Petermann, M., Garrido, F., Uribarri, J., Bunout, D. and Hirsch, S. (2008) Urinay excretion of fluorescent advanced glycation end products in the elderly. The Journal of Nutrition, Health & Ageing, 12, 222-225. doi:10.1007/BF02982625
- Sun, J.K., Keenan, H.A., Cavallerano, J.D., Asztalos, B.F., Schaefer, E.J., Sell, D.R., Strauch, C.M., Monnier, V.M., Doria, A., Aiello, L.P. and King, G.L. (2011) Protection from retinopathy and other complications in patients with type 1 diabetes of extreme duration: The Joslin 50-year medalist study. Diabetes Care, 34, 968-974. doi:10.2337/dc10-1675
- Uribarri, J., Peppa, M., Cai, W., Goldberg, T., Lu, M., Baliga, S., Vassalotti, J.A. and Vlassara, H. (2003) Dietary glycotoxins correlate with circulating advanced glycation end product levels in renal failure patients. American Journal of Kidney Disease, 42, 532-538. doi:10.1016/S0272-6386(03)00779-0
- Uribarri, J., Cai, W., Peppa, M., Goodman, S., Ferrucci, L., Striker, G. and Vlassara, H. (2007) Circulating glycotoxins and dietary advanced glycationendproducts: Two links to inflammatory response, oxidative stress, and aging. The Journal of Gerontology Series A: Biology Science and Medicine Science, 62, 427-433. doi:10.1093/gerona/62.4.427
- Delgado-Andrade, C., Seiquer, I., Navarro, M.P. and Morales, F.J. (2007) Maillard reaction indicators in diets usually consumed by adolescent population. Molecular Nutrition Food Research, 51, 341-351. doi:10.1002/mnfr.200600070
- Delgado-Andrade, C., Tessier, F.J., Niquet-Leridon, C., Seiquer, I. and Navarro, M.P. (2001) Study of the urinary and faecal excretion of Nε-carboxymethyl-lysine in young human volunteers. Amino Acids, in press. doi:10.1007/s00726-011-1107-8
- Vallejo-Cordoba, B. and González-Córdova, A.F. (2007) CE: A useful analytical tool for the characterization of Maillard reaction products in foods. Electrophoresis, 28, 4063-4071. doi:10.1002/elps.200700314
- Uribarri, J., Cai, W., Ramdas, M., Goodman, S., Pyzik, R., Chen, X., Zhu, L., Striker, G.E. and Vlassara, H. (2011) Restriction of advanced glycation end products improves insulin resistance in human type 2 diabetes: Potential role of AGER1 and SIRT1. Diabetes Care, 34, 1610-1616. doi:10.2337/dc11-0091
NOTES
*Funding: FONIS Grant N°SA06I20037 and FONDECyT Grant N°1090226.