Journal of Behavioral and Brain Science
Vol.2 No.2(2012), Article ID:19578,4 pages DOI:10.4236/jbbs.2012.22026
A Modification of the Relative Weightings of Symptoms Utilizing a Logistic Function to Enhance the Linearity of the Brief Psychiatric Rating Scale: A Retrospective Analysis
1Department of Psychiatry, Tokyo Women’s Medical University, Tokyo, Japan
2Depression Prevention Medical Center, Kyoto Jujo Rehabilitation Hospital, Kyoto, Japan
Email: jsawamura@psy.twmu.ac.jp
Received November 16, 2011; revised January 22, 2012; accepted February 22, 2012
Keywords: Evaluation Scale; Linearity; Weightings; Modification; BPRS; Schizophrenia
ABSTRACT
Introduction: Although the Brief Psychiatric Rating Scale (BPRS) is widely used for evaluating patients with schizophrenia, the meaning of the weights of the individual symptoms is ambiguous. The aims of the study were 1) to investigate whether the modification of relative weights of items of the BPRS is able to enhance its correlation with the Clinical Global Impression-Schizophrenia scale (CGI-SCH) and 2) to construct a potential modified BPRS. Methods: We evaluated 200 schizophrenia patients using the BPRS and the CGI-SCH and drew the scatter plot distributions of the two scales. Next, univariate regression for the CGI-SCH using individual symptoms of the BPRS was performed. Multivariate regression utilizing the “logistic function” was then conducted to allocate marks to each item and Pearson’s r correlation coefficient and r-squared between the two scales were assessed. After that, we constructed an example of a potential modified BPRS. Results: With the scatter plot for the two scales, a logarithmic curve was obtained; this was described by [CGI-SCH] = 3.2248 × ln[18-item BPRS] – 7.2044 (p < 0.001). Pearson’s r for the relationship between the scales was 0.8216 and r-squared was 0.7718 (both p < 0.001). The univariate regression indicated a positive association between all symptoms of the BPRS and the CGI-SCH, although some of them were significant (p < 0.05) and others were not (p ≥ 0.05). Multivariate regression utilizing a logistic function provided the values “Pi” that could express the relative weights of individual symptoms. Subsequently, modification of point allocations according to “Pi” yielded a Pearson’s r of 0.8491 and an r-squared of 0.7718 (not changed) (both p < 0.001). An example of a potential modified BPRS was constructed. Conclusions: Within the limits of our data, the weightings of items of the BPRS improved the correlation of the BPRS with the CGI-SCH for evaluating schizophrenia.
1. Introduction
Schizophrenia is a serious mental disorder characterized by a number of symptoms. To evaluate the effects of treatment for schizophrenia, it is important to assign quantitative values to the symptoms. Many rating scales have been used to evaluate various symptomatic domains in schizophrenia [1]. This has led to confusion regarding the suitability of the different scales available, not only for evaluation and treatment of the disease but also in research and clinical studies of the effects of medication. Currently, consensus is lacking about which rating scales are most appropriate for evaluating schizophrenia. Evaluation scales that are relevant, quick, user-friendly, graduated at equal intervals and with high linearity are needed to facilitate measurement-based treatment of schizophrenia. Conventionally, we often utilize the evaluation scales for mental disease as if there were a perfect linear relationship between the scores and the global state of illness. However, it is uncertain that these scales have perfect linearity and that they reflect the true states of patients with schizophrenia. The Brief Psychiatric Rating Scale (BPRS) [2] is one of the standard instruments used most frequently in daily practice for evaluating the severity of schizophrenia. Other than the BPRS, also popular are the Clinical Global Impression-Schizophrenia scale (CGISCH) [3], the Positive and Negative Syndrome Scale (PANSS) [4], the Scale for Assessment of Positive Symptoms (SAPS) [5] and the Scale for Assessment of Negative Symptoms (SANS) [6]. Although the BPRS includes 18 items and the allocation of marks is defined clearly, as all items have the same range of marks (from 1 (not present) to 7 (extremely severe), with “0” meaning “not assessed”), it is not unusual to find that scores for the BPRS differ widely in proportion from those for the CGI-SCH in the same patient.
Ideally, scores from one scale could be mapped directly onto the other, making it possible to compare individuals evaluated with one scale or the other. We decided to investigate this divergence analytically, looking at the clinical weights of various symptoms (the relative magnitudes of symptoms in schizophrenia) and the issue of scale nonlinearity. It was discussed in our previous report that there might not be a linear relationship between the two scales (the shape of distribution between them was assumed to be a logarithmic curve) and that the degree of linearity between the BPRS and the CGI-SCH might be influenced not only by the former’s selection of items but also by modification of the points allocated to each symptom [7]. However, there was a crucial weakness in this analysis as some items of the BPRS were excluded. This method probably caused various biases in the results, which we are now attempting to correct. This time, our aim was to examine whether the modification of the point allocations apart from selection of items (if possible, using the same number of items, 18) enhanced the degree of the linearity of the BPRS with the CGI-SCH. We believe that, for all evaluation scales, the determination of items is most important for precise evaluation of the patient’s state. There are many reports examining which items should be selected for the adequate composition of a scale, not only in the fields of psychiatry but also in other fields of medicine. However, there are few studies that have investigated whether the weights of symptoms of the BPRS were related to the global state of mental illness (as measured by the CGI-SCH) and whether there was a possibility that modification of these weights in the BPRS rather than an altered selection of items could enhance its correlation with the CGI-SCH score utilizing a multivariate regression method, particularly, utilizing a logistic function.
The aims of the present study were: 1) to confirm whether a modification of point allocation to individual items rather than a selection of items is able to enhance the degree of correlation of the 18-item BPRS with the CGI-SCH global impression of the severity of schizophrenia, utilizing non-linear multivariate regression analysis (not with the maximum-likelihood method but with the least-squares method) with a logistic function; and 2) to consider an example of a potential modified BPRS that expresses relative weights of respective symptoms and would be expected to have improved correlation with the CGI-SCH scores compared with the original 18-item BPRS.
2. Methods
2.1. Participants
This was a retrospective study of outpatients and inpatients treated at the Tokyo Women’s Medical University, Miyazaki Hospital and Depression Prevention Medical Center, Kyoto Jujo Rehabilitation Hospital, Japan, who met the DSM-IV-TR [8] criteria for schizophrenia. A total of 200 patients (99 males, 101 females) with a mean age of 45.13 years (range, 16 - 83) were included in this study. Fifty patients were suffering their first episode of schizophrenia or attending for initial treatment (Group A) and 150 were randomly selected during either the acute or chronic phase of schizophrenia (Group B). The study involved a retrospective chart review and was approved by the ethics committee of our institution.
2.2. Research Design
All patients were evaluated and rated from their medical records using the BPRS and the CGI-SCH during the same session, but at the initial consultation for Group A and at a random treatment session for Group B. In this study, we utilized the CGI-SCH as a scale that substituted for the evaluation made by the patients’ psychiatrists, under the assumption that the CGI-SCH had perfect linearity and that it represented the precise clinical global impression of the treating psychiatrists, in order to simplify the analysis.
Two experienced psychiatrists shared their evaluations, and the scores for the BPRS and the CGI-SCH were presented graphically. At this stage, we examined the distribution on a scatter plot of the two scales and, if the linearity of the BPRS to the CGI-SCH was not initially apparent, we aimed to express the relationship in a more precise mathematical equation. Next, univariate linear regression analysis was performed with the CGI-SCH as the dependent variable and with individual symptoms of the BPRS as the independent variables. We examined whether the relationship between an individual symptom of the BPRS and the CGI-SCH had a positive or negative correlation with or without significance. After the univariate regressions, the variables that were positively associated with the CGI-SCH were entered into a multivariate model, while those that were negatively correlated with the CGI-SCH were excluded from this trial regardless of whether they were significant (p < 0.05) or not (p ≥ 0.05). After that, multivariate non-linear regression analysis utilizing the logistic function as the regression equation was conducted, with the CGI-SCH as the dependent variable and with all 18 items of the BPRS as independent variables. In multivariate regression, we ordinarily do not utilize a logistic function as a regression function in the “least-squares method” but in the “maximum-likelihood method” at which the dependent variable takes only the binominal number “0” or “1”, because logistic regression was devised for outcomes with only two states, e.g., “remission” or “non-remission” [9-14], “coronary heart disease” or not [15-17].
However, we decided to adopt a way of utilizing the logistic function as the regression function in a “non-linear least-squares method” because the dependent variable of the CGI-SCH could take polychotomous points, ordinarily one to seven, and putting a cut-off value on the CGISCH score might cause a loss of data in terms of the raw distribution of the scatter plot between the BPRS and the CGI-SCH. Another crucial reason for this choice is that, with multivariate regression analyses, we often obtain regression coefficients of independent variables that are inversely associated with the dependent variable. In our previous study, by performing multivariate regression, some symptoms of the BPRS were inversely correlated with the CGI-SCH, although the phenomenon of the higher score on some symptoms implying a less ill state was a departure from clinicians’ experiences [7]. To be sure, there might be a case where independent variables are inversely correlated with a dependent variable in multivariate regression, even though the independent variables have positive correlations in their respective univariate regression analyses (utilizing each variable as the only independent variable). However, to our knowledge, it seems likely that symptoms that are significantly and positively correlated with the CGI-SCH tend to have more meaning for evaluating the true state of schizophrenic patients, and that symptoms that are insignificantly and/or inversely associated with the CGI-SCH tend to have less meaning for that. If so, by increasing the point allocations of the symptoms significantly and positively correlated with the CGI-SCH and decreasing the point allocations of those inversely associated with the CGISCH, we might be able to obtain a modified almost 18-item BPRS that would have a higher correlation with the CGI-SCH, in other words, that might be closer to clinicians’ impressions than that of the original 18-item BPRS. If some form of modification of point allocation could enhance the correlation between the two scales, that might indicate a possibility that point allocation itself is associated with the linearity of the BPRS to the CGI-SCH. Considering these aspects, we conducted a series of manipulations as below.
Historically, the logistic function was explored in the Framingham study to identify risk and protective factors for coronary heart disease [15,16] (e.g., LDL cholesterol, triglycerides, blood glucose, systolic blood pressure, diastolic blood pressure, cigarettes/day, age, relative weight, etc.), and the methodology was based on that of Walker and Duncan [17], who proposed the logistic function that provided the advantage of the probability of occurrence of an event such as the presence/absence of heart failure in a dichotomous model. They used the logistic function in line with the least-squares method for estimating the relative weights of risk and protective factors for coronary heart disease through the rough comparison of the standardized coefficients obtained by multiplying partial regression coefficients by the individual standard deviation of the characteristic. Here, a larger standardized coefficient represented a stronger risk factor, and vice versa. We presumed that this method might be applicable for enhancing the linearity of an evaluating scale such as the BPRS, especially to improve the relative weights of symptoms.
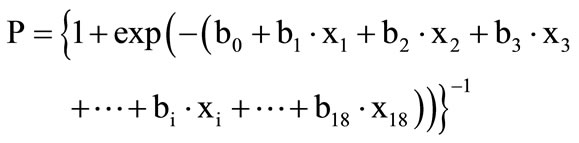
As it is usually known, a logistic function has a value between 0 and 1 and the function transforms both positive and negative numbers that exceed “1” or are less than “0” into a positive number within the interval “0 - 1” according to its characteristic behavior on a graph (that is, an ascending sigmoid curve). By adjusting the size of the CGI-SCH score into “a ratio to 1” as “P” (0 ≤ P ≤ 1), (e.g., the CGI-SCH score of “2” is converted into “2/7 = 0.2857”), and inserting the variables of the BPRS into the logistic function described below, we were able to conduct nonlinear multivariate regression analysis utilizing the logistic function as the regression function that provides values of “P” ranging between “0 - 1” continuously.
 .
.
(0 ≤ P ≤ 1; strictly, 0 < P < 1), –∞ < xi < +∞, i = 1 - 18, xi: a score of symptom of number “i” of the BPRS, usually within 1 - 7; bi: a coefficient of the symptom of number “i” (which is able to take a positive or negative value). Strictly, “P” could not take “0” or “1” exactly; however, this problem also occurs in the ordinal logistic function as the ordinal logistic regression of the maximum-likelihood method.
The “bi” terms are neither regression coefficients of linear multivariate regression analysis nor of logistic regression. These are coefficients that were optimized to meet the condition of the least-squares method, which minimizes the sum of squared differences between values adjusted from the CGI-SCH score into “0 - 1” and expected values according to the BPRS.
The logistic function provides the probability that the value of the predictor variable (symptom) of the BPRS will give the CGI-SCH outcome variable its full mark of “7”. In other words, it expresses the ratio or degree of share in the full score of the CGI-SCH = “7”. For example, P = 0.4 means a value that provides that ratio to the full score of the CGI-SCH “7”, indicating that the expected score of the CGI-SCH will be 2.8 (calculated as 0.4 × 7 = 2.8). Moreover, if the size of the partial regression coefficient of the number-“i”-symptom, “bi”, is significant (p < 0.05), inserting the parameter (as xi = 7, where xj = 0 (j ≠ i)) utilizing “bi” (when the i-th symptom of the BPRS takes the full score “7” and other symptoms of the BPRS take nothing) provides an expected ratio Pi (0 ≤ Pi ≤ 1; strictly, 0< Pi < 1) that expresses how much the CGI-SCH score shares in its full score “7”. So, from a certain viewpoint, the size of “Pi” has the meaning of “relative weight of the i-th symptom of the BPRS” given by its full score to the CGI-SCH independently. Therefore, if a set of “Pi” terms are obtained through multivariate regression utilizing the above logistic function, we consider the values of the “Pi” terms as the relative weights of the symptoms. We are then able to evaluate the influence of this manipulation before and after in terms of the degree of the linearity of the BPRS with the CGISCH. Conversely, if “bi” is not significant (p ≥ 0.05) and tends to become a small number, we infer that it is permissible to ignore “bi”, which is then exchanged for the number “0”. So, we chose the way that we utilized each significant “bi” term from its size (Pi was calculated as = {1 + exp(–(b0 + bi∙7))}–1) and the non-significant “bi” as “0” (Pi was calculated as = {1 + exp(–(b0))}–1) when we determined the size of “Pi” terms and whether “bi” was a positive number or not (Figure 1). Furthermore, if the results provide acceptable implications for improving the BPRS, by utilizing the results of multivariate regression, we would allocate marks in proportion to the size of “Pi” to individual items or symptoms.
With regard to linearity, we then examined the distribution on the scatter plot of the BPRS and the CGI-SCH scores. We obtained the Pearson’s r coefficient as an indication of the degree of linearity of the relationship between the two scales, r-squared being one of the values used to estimate the degree of the fit of the model (by observing how r-squared changes), before and after a series of manipulations. Furthermore, we examined whether the modification in this trial is able to enhance the correlation of the BPRS with the CGI-SCH. On the basis of the results, if possible, we planned to construct a prototype of a potential modified 18-item BPRS, “the modified 18-item
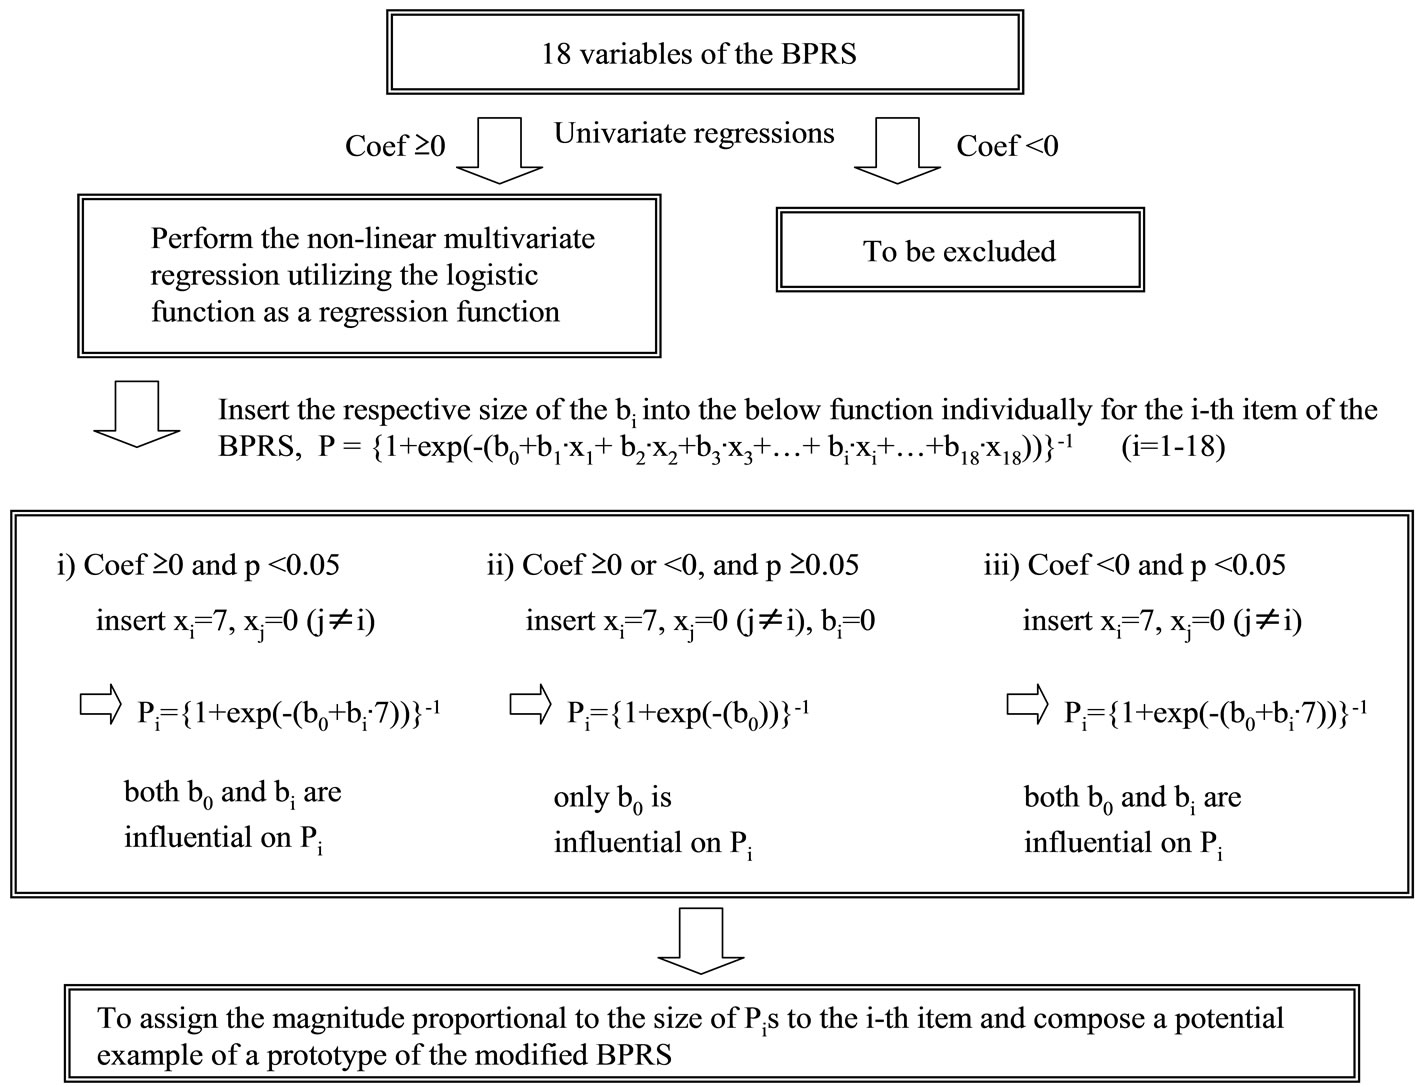
Figure 1. A flow chart of the manipulation. The non-linear multivariate regression analysis utilizing the logistic function as a regression function after the selection of items of the BPRS with the univariate linear regressions is illustrated. For the i-th item where the p-value is significant (p < 0.05), the number bi is inserted into the logistic function under the condition xi = 7 and xj = 0 (j ≠ i), while, for the i-th item where the p-value is not significant (p ≥ 0.05), the number bi is ignored because its size is considered less meaningful as a regression coefficient, and those coefficients are regarded as “0” except for b0. After that, Pi terms would be provided for each item according to the sizes and significance of regression coefficients. Multiplying Pi equally by an appropriate constant would be expected to yield an example of a prototype of the modified BPRS. As a further improved algorithm, the selection of items conditioned on whether coefficients are positive and significant (p < 0.05) is permissible at the first step of the algorithm.
BPRS”, which would express the relative weights of respective symptoms and be expected to have a higher correlation with the CGI-SCH within the limitations of the applicability for our data at this stage. We used Stata Release 10.0 [18] for the multivariate linear/non-linear regression analysis, used SPSS for Windows, version 14 [19] for calculating the p-values of r-squared at analysis of variance (ANOVA), and Microsoft Excel 2003 [20] for plotting the graph.
3. Results
The sequence of the series of manipulation is presented as a flow chart in Figure 1. Table 1 shows the results of univariate linear regression analysis performed with the CGI-SCH score as the dependent variable and with each symptom in the BPRS as the independent variable. Within the limits of our data, each symptom by itself was positively correlated with the CGI-SCH score, although some had significance (p < 0.05) and others did not (p ≥
0.05). Accordingly, we did not exclude any symptom from the BPRS through all subsequent manipulations. Figure 2 shows the relationship between the 18-item BPRS score and the CGI-SCH score (p < 0.001). Pearson’s r coefficient for the relationship between the 18-item BPRS and the CGI-SCH was 0.8216 (p < 0.001) and r-squared (that of multivariate linear regression using all items of the BPRS) was 0.7718 (p-value of ANOVA was less than 0.001). On the scatter plot, there was a rough correlation where a curve with upper convexity was obtained and the straight-line relationship that had been thought to exist between the two scales was not apparent (this is also described in our previous report [7]). Because the shape of the curve was similar to a logarithmic curve, we performed a natural logarithmic transformation of the 18-item BPRS total score. The curve was then modified to an almost linear distribution, which was described by the equation [CGI-SCH] = 3.2248 × ln[18-item BPRS] – 7.2044 (p < 0.001; Figure 3).
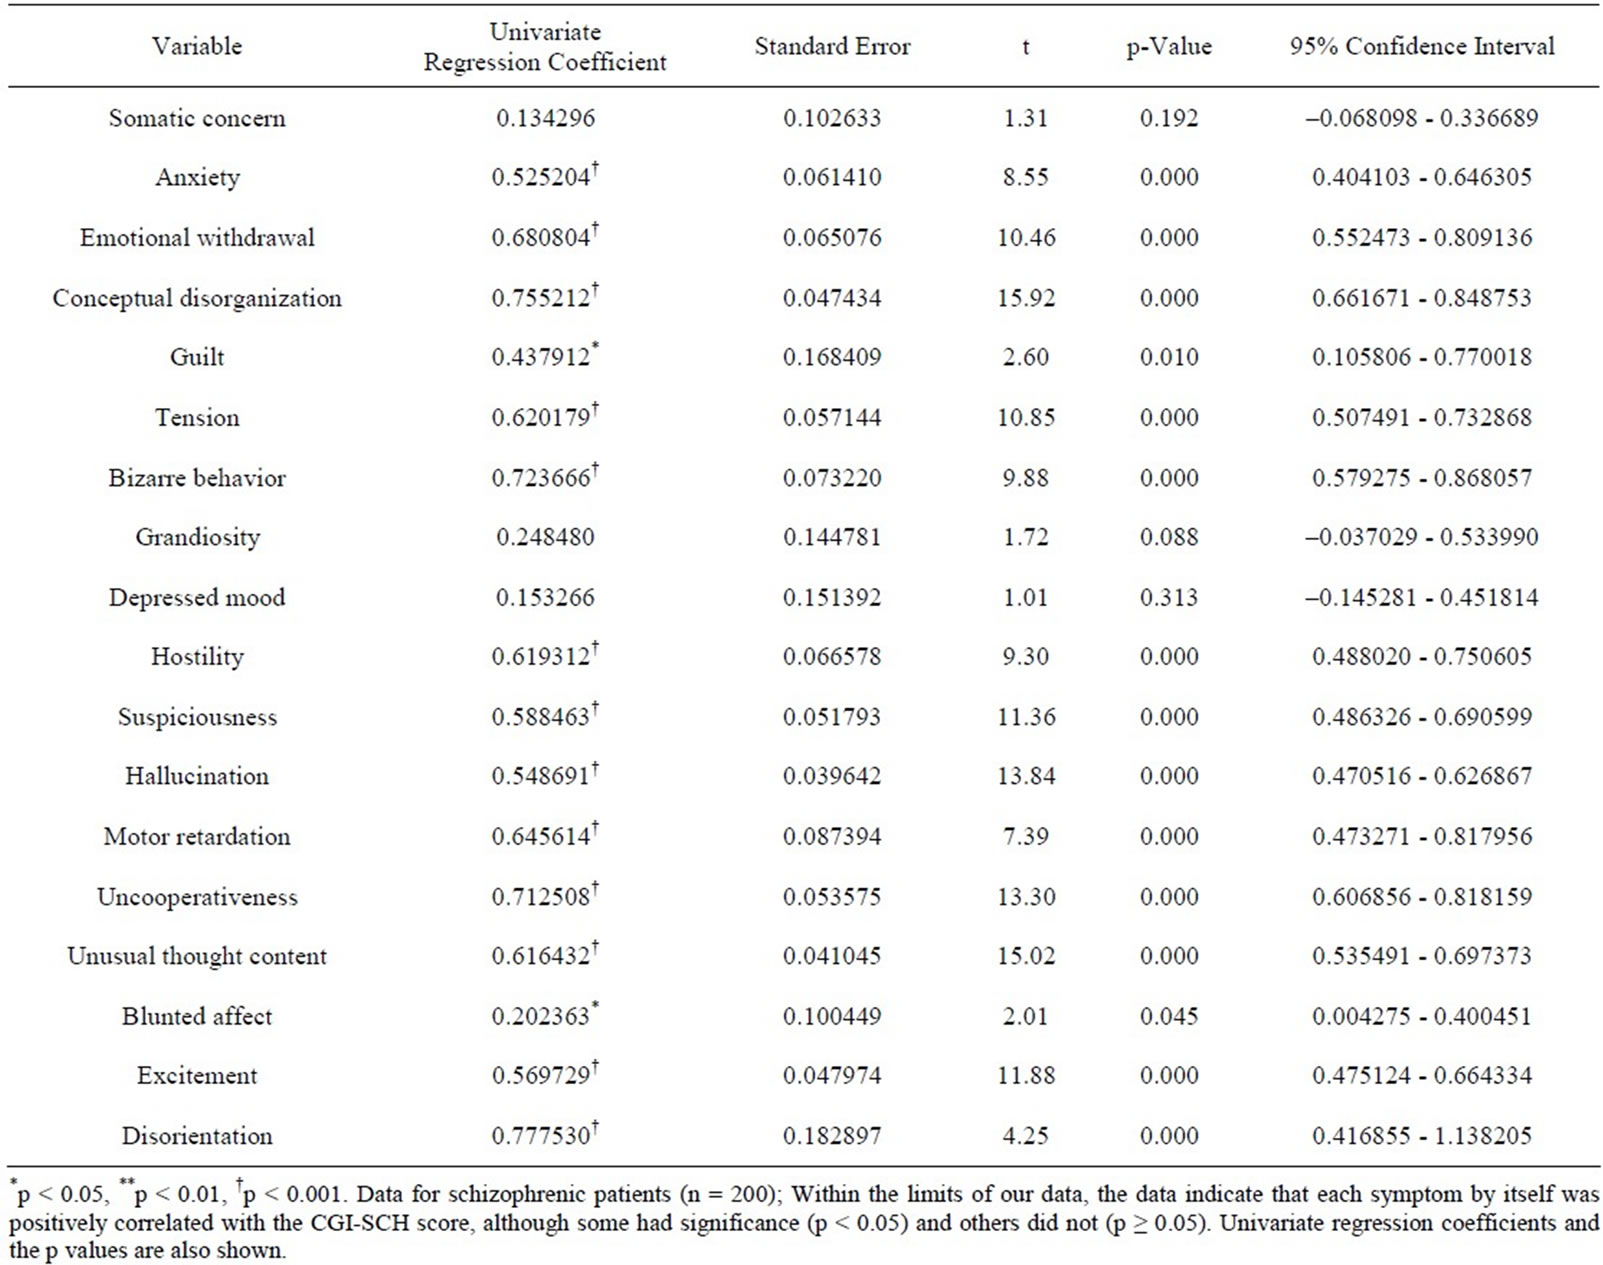
Table 1. Results of univariate linear regression using each variable of the BPRS in sequence.
Together with this, Pearson’s r between the ln[18-item BPRS] and the CGI-SCH was 0.8530 (p < 0.001). The results of non-linear multivariate regression analysis utilizing a logistic function are shown in Table 2. In Table 2, some symptoms were significantly and positively/negatively correlated with the CGI-SCH, and others were insignificantly and positively/negatively associated with the CGI-SCH. Intriguingly, there was a tendency for the symptoms that did not have significant correlation (p ≥ 0.05) with the CGI-SCH score in the univariate linear regression analysis (Table 1) to have insignificant positive associations with the CGI-SCH and/or significant negative associations with the CGI-SCH in the non-linear multivariate regression utilizing the logistic function as the regression function (Table 2).
Inserting xi =7, xj = 0 (j ≠ i), with b0= –1.779568 consistently, without change for significant bi terms and with change (inserting bi = 0) for insignificant bi terms in the above logistic function provided the set of “Pi” terms (Table 3). Because the “Pi” terms were considered as the
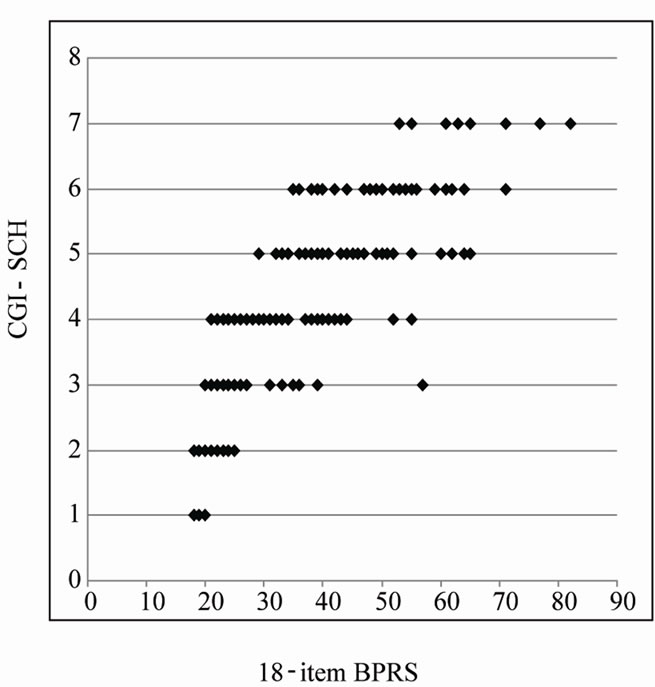
Figure 2. Scatter plot of the 18-item BPRS total score and the CGI-SCH score. An upper convexity curve similar to a logarithmic curve was evident and a linear relationship was not apparent. The range of the 18-item BPRS is 18 - 126, and that of the CGI-SCH is 1 - 7.
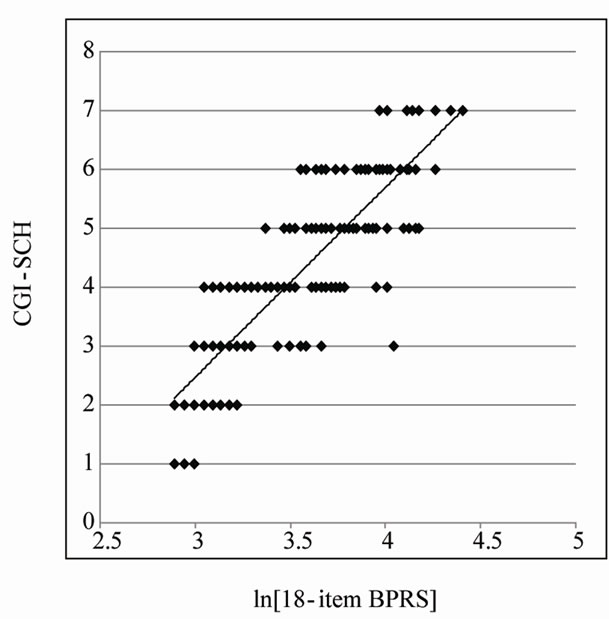
Figure 3. Scatter plot of the natural logarithm of the 18-item BPRS total score and the CGI-SCH score. After performing a natural logarithmic transformation on the 18-item BPRS score, the approximately logarithmic curve was modified to an almost linear distribution and the increase in the natural logarithm of the 18-item BPRS total score was almost proportional to the increase in the CGI-SCH score.
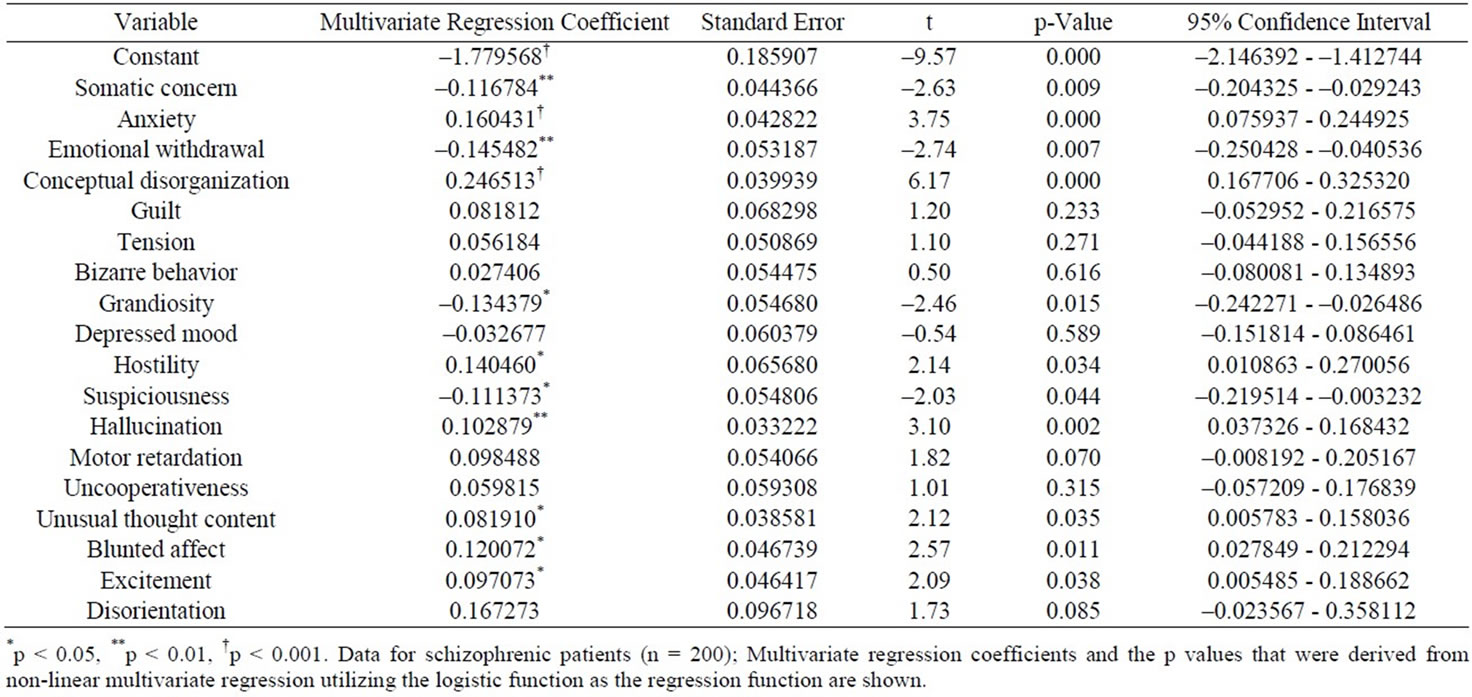
Table 2. Results of non-linear multivariate regression analysis utilizing a logistic function.
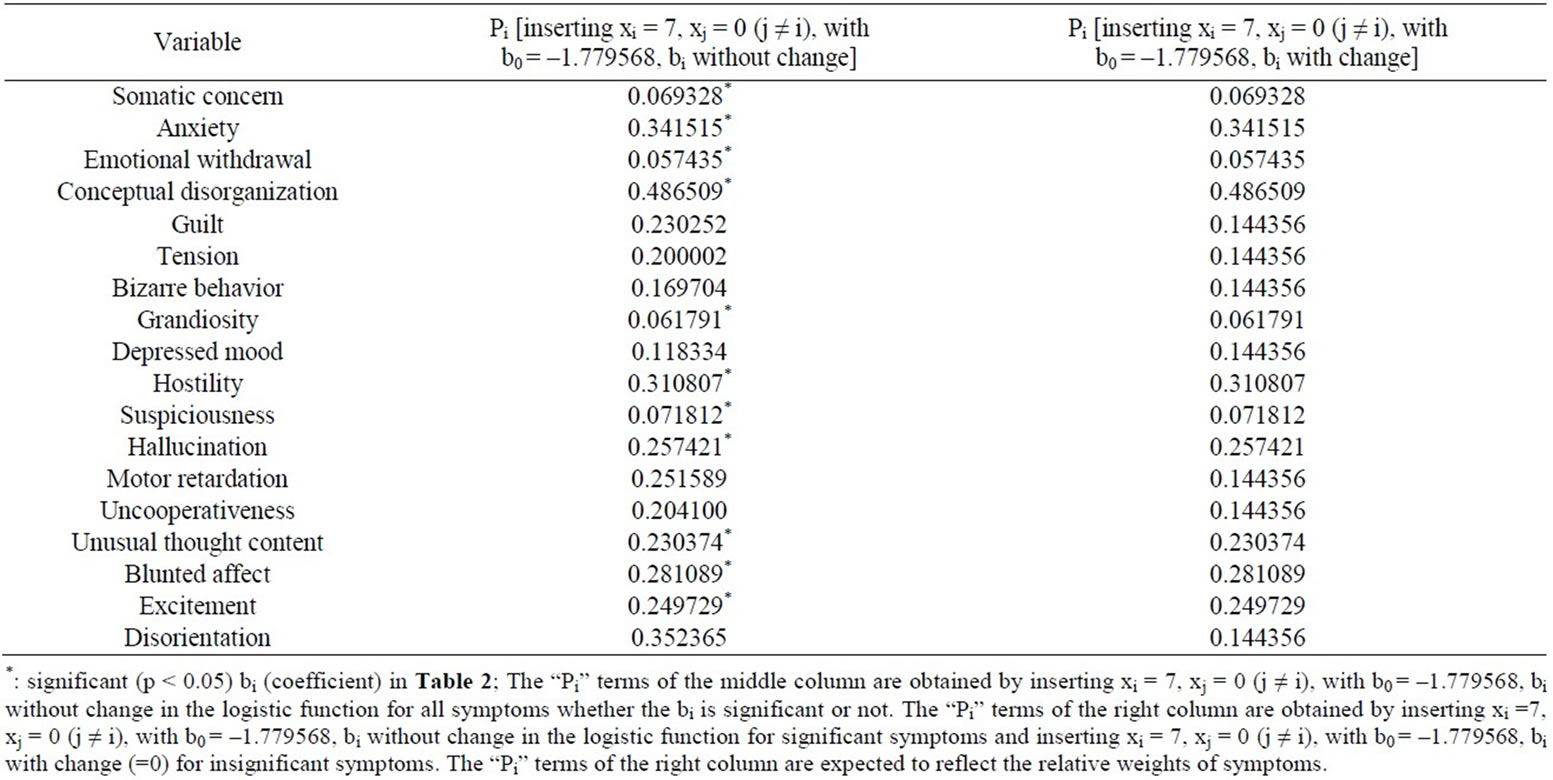
Table 3. The values of “Pi” terms.
degrees of the expected ratio (0 - 1) of the CGI-SCH score to its full score “7”, we regarded these as clinical weights. Moreover, allocating marks to each of the 18 items of the BPRS in proportion to the “Pi” term (multiplying each i-th score by Pi) provided the scatter plot of the total score modified using “Pi” terms and the CGISCH score (p < 0.001, Figure 4), in which Pearson’s r was 0.8491 (p < 0.001) and r-squared was 0.7718 (p-value of ANOVA was less than 0.001). Through all manipulations, Pearson’s r was increased from 0.8216 to 0.8491, and r-squared did not change (0.7718). As a result, the distribution on the scatter plot of the two scales changed from that shown in Figure 2 to that shown in Figure 4, yielding a more linear relationship between “the modified 18-item BPRS” and the CGI-SCH than was the case between the original 18-item BPRS and the CGI-SCH. In addition, we confirmed that the Pearson’s r when the BPRS was modified only through decreasing the magnitude of those items that were significantly inversely correlated with the CGI-SCH was 0.8325 (p < 0.001).
Between Figures 2 and 4, r-squared for the linear multivariate regression utilizing the unmodified and modified score of each symptom was not changed (0.7718). However, r-squared for the multivariate non-linear regression analysis utilizing the logistic function as the regression function (with the CGI-SCH score adjusted from 1 - 7 into 0 - 1 (as “P” where 0 ≤ P ≤ 1) as the dependent variable and with all the individual items of the BPRS as independent variables) was 0.9750, considerably higher than that for the ordinal multivariate linear regression using the same full set of items (although a p-value was not able to be calculated with the SPSS & Stata programs).
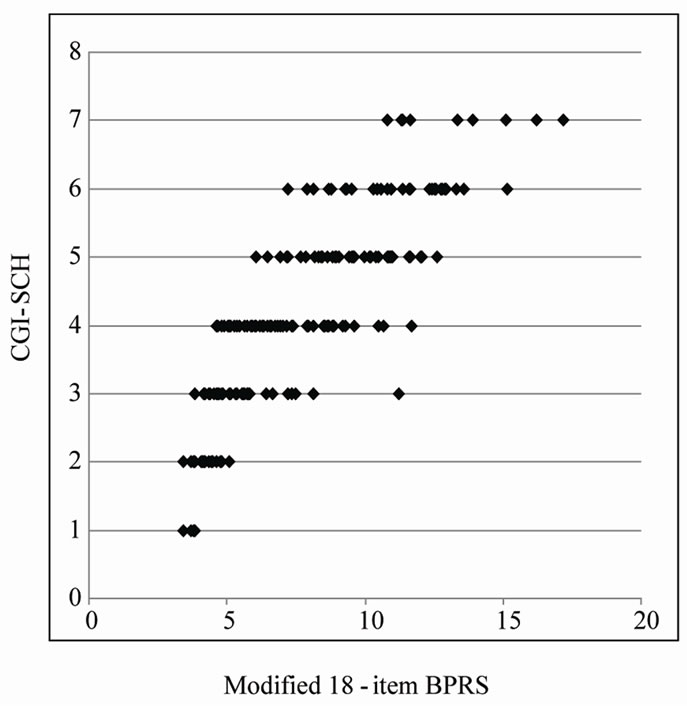
Figure 4. Scatter plot of the 18-item total score, modified using the Pi ratios and the CGI-SCH score. The score for each of the items was multiplied by the ratio Pi for each symptom. The range of the total score for the 18 BPRS items modified using multiple regression coefficients via the logistic function is 3.43 - 17.17, and that for CGI-SCH is 1 - 7.
By utilizing the set of the individual “Pi” ratios, we composed a prototype of a potential modified 18-item BPRS: “the modified 18-item BPRS” (of tentative meaning, given the limits of our data at this stage) (Figure 5).
4. Discussion
The BPRS is one of the most frequently used standards for
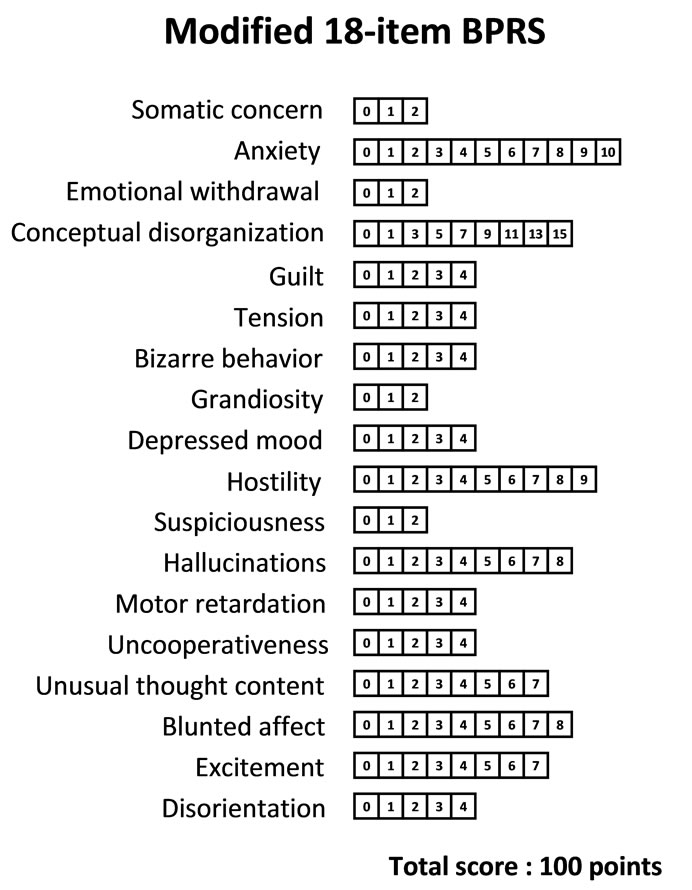
Figure 5. An example of a potential modified 18-item BPRS. Marks for each item were calculated by multiplying the ratio Pi (relative weight of the i-th symptom of the BPRS), obtained as the right column of numbers in Table 3, for each of the 18 items by 30.
evaluating the psychopathology of patients with schizophrenia. Although its psychometric properties in terms of reliability, validity and sensitivity have been extensively examined [21], patients examined by clinicians are given different observer ratings using different criteria. On the other hand, assessment with the CGI-SCH is based on a score of 1 - 7, making it simple and relevant. The CGISCH may be as sensitive as the BPRS in detecting efficacy differences between antipsychotic drugs [22], but it is necessary for treatment response to be interpreted in the context of patient characteristics [23]. However, patients with different characteristics but with similar scores are often treated similarly in clinical trials. Therefore, training is required for performing a standardized evaluation [24]. Other user-friendly assessments include the Revised Global Outcome Assessment of Life in Schizophrenia (Revised GOALS) [25], the Investigator’s Assessment Questionnaire (IAQ) [26] and the Targeted Inventory on Problems in Schizophrenia (TIP-Sz) [27], although they have some limitations in terms of methodology. We also believe that other important aspects of illness management should be supplemented with appropriate subjective scales as necessary [28]. Nonetheless, there is no consensus among clinicians regarding the most suitable scale. To address this perplexing issue, more advanced investigations are necessary to devise rating scales using some form of statistical method.
Leaving aside the debate over whether psychopathological severity or state can be expressed in evaluation scales such as the BPRS or the CGI-SCH and accepting the need and utility of such instruments, we focused here on improving the BPRS scale. We examined whether the more detailed assessment afforded by its point allocations could be made proportional to the ratio “Pi”, which provides probabilities of the expected values that share in the full score of the CGI-SCH.
Many previous attempts have been made to evaluate the adequacy of the BPRS from the viewpoint of which items should be selected because of their relevance. However, no study has approached this issue by addressing how the degree of linearity of the BPRS can be changed by modifying the symptom weightings, using non-linear multivariate regression analysis (non-linear least-squares method). In the present study, by plotting the BPRS scores and the CGI-SCH scores in the form of a graph, the scatter plot of the 18-item BPRS and the CGI-SCH yielded a curve with upper convexity, thus de-monstrating that the relationship between the two scales was not linear (see Figure 2).
Because the shape of the curve had an upper convexity similar to a logarithmic curve, by performing a natural logarithmic transformation on the 18-item BPRS score, a regression equation was obtained in a logarithmic form, as shown in Figure 3. From this result, we presumed that there was a possibility that an increase in the logarithm of the total score for all symptoms might be roughly proportional to the global increase in symptom severity observed clinically in schizophrenic patients that was mentioned in our previous report [7]. Also in this report, we presumed that the logarithmic relationship between the single score scale, the CGI-SCH, and the plural score scale, the BPRS, might be an important tool in our determination of the severity of illness (e.g., there might be a possibility that a clinician’s impression of the severity of a certain disease is approximately proportional not to the simple sum of respective severity of symptom ratings but to the logarithm of this sum). In addition, Pearson’s r between the ln[18-item BPRS] and the CGI-SCH was 0.8530 (p < 0.001) (higher than that between the original BPRS and the CGI-SCH of 0.8216). This result might imply that the facility of the symptoms for explanation of the model was better in the former than in the latter, and that there might possibly be a more linear relationship between the log-transformed BPRS and the CGI-SCH than between the non-log-transformed BPRS and the CGI-SCH. However, the r-squared of the above non-linear multivariate regression analysis (using the logistic function as the regression function, with the CGI-SCH score size-adjusted from 1 - 7 into 0 - 1 as the dependent variable and all items of the BPRS as independent variables) was 0.9750. This value was also two scales. To evaluate the clinical severity of schizophrenia, we substituted the CGI-SCH score for the clinical impression.
The values of Pearson’s r were slightly higher between “the modified 18-item BPRS” (constructed by modification of specific point allocation) and the CGI-SCH than between the original 18-item BPRS and the CGI-SCH without decreases of r-squared in terms of the results of greater than that for ordinal multivariate linear regression using the same full set of items (0.7718, although p-value could not be calculated with the SPSS & Stata programs). Therefore, a sigmoid function such as the logistic function might be more suitable as a regression function than a simple linear function, as shown in Figure 2 (although we recognize that the results have applicability to only this trial at this stage).
We then investigated whether modifying the allocation of marks could affect the linearity of the BPRS, at least within this trial, looking at the correlation of the BPRS with the CGI-SCH in terms of Pearson’s r and r-squared, which express one of the degrees of the fit between the linear multivariate regression before and after modification of point allocation. We inferred that because the shape of the scatter plot between the two scales became more linear after the modification of the score than before, there was a possibility that the clinical weights might be related to the heightened values of Pearson’s r between “the modified 18-item BPRS” and the CGI-SCH. We presumed that there was a possibility that the weightings themselves were associated with the linearity of the BPRS.
Furthermore, by assigning different weights to each item proportional to the “Pi” that was calculated from the regression coefficients, “bi”, we were able to construct an example of a potential modified 18-item BPRS: “the modified 18-item BPRS” (Figure 5). We assumed that the magnitude of each “Pi” represented the respective clinical weight of each item because the value of “Pi” was defined as a probability by the logistic function. We were also able to consider that the value of “Pi” provides a probability of or ratio to the full score of the CGI-SCH (“7”) according to the set of item scores of the BPRS. The scale is only a tentative example of a potential modified BPRS subscale that we were able to construct within our data, and as a result, the number of items need not be 18 consistently.
Some problems have been reported with multivariate regression analysis. To compare the relative magnitudes of variables, the partial regression coefficients are often normalized using their respective standard deviations. However, the predictor variable is at least partially redundant with other predictors and the partial regression coefficient is influenced by the range of the predictor variable [29,30]. In addition, the relative importance of predictor variables is a tenuous concept and comparison of the importance of predictors is not always the best approach in multiple regression. As the individual items of the BPRS had the same range of marks (ordinarily, 1 - 7), we considered that there would not be crucial differences in the sizes of standard deviations for predictor variables in this study. With this assumption, we treated the partial regression coefficients (“bi” terms) as if they expressed the value of the weight with which each symptom affected the score of the CGI-SCH through the logistic function. With each manipulation, the range of point allocations to each symptom before the manipulation might have to be coordinated with the same size of range. On the other hand, the use of standardized regression coefficients is difficult because the values are not included in the logistic function and are not connected with the “Pi” terms directly. Perhaps, if we would use the standardized regression coefficients themselves, a more complex and/or especially technical adjustment might be needed for derivation of the “Pi” terms. This might then differ considerably from the operations that we have devised to this point. For instance, J Lee reported a method of covariates-adjusted rates for ordinal logistic regression, in which inserting xi of each variable individually provided more adequate results (although the independent variables were binominal) [31]. Also with reference to this, we utilized the magnitude of the “Pi” (calculated by inserting bi and xi = 7, xj = 0 (j ≠ i) into the logistic function) to modify the distribution of marks of the BPRS and to design a potential modified BPRS. Our method, however, does not utilize insignificant “bi” terms and this might cause a bias in the results.
As for the method we used in the present study, there is a problem in utilizing the logistic function because it is a non-linear function described as P = {1 + exp(–(b0 + b1∙x1 + b2∙x2 + + b18∙x18))}–1. If the value of “Pi” was defined so that “Pi” provides a probability or ratio to the full score of the CGI-SCH of “7” according to the set of item scores of the BPRS, the “Pi” was not linearly related to the expected CGI-SCH. Ideally, to determine the weight of symptoms, we might have used only multivariate linear regression for keeping the equal interval/calibration of the parameter. Therefore, if “Pi” expresses the positive or negative correlation of each symptom with the CGI-SCH roughly, the absolute value of “Pi” will not have equal intervals or calibration. However, inserting the value of P not as “0 or 1” but as a decimal number (e.g., P = 0.30) reflecting the ratio (to the full score of the CGI-SCH) into the logistic function as the dependent variable might be expected to produce more valid results than those obtained with ordinal logistic regression (inserting the value of P as only “0 or 1”), because permiting the use of a decimal number from 0 to 1 for the dependent value (P) utilizes the polychotomous value of the CGI-SCH score, which is impossible in the dichotomous model. In other words, since the maximum likelihood method could be interpreted as a generalized least-squares method [11,32], we inferred that the non-linear multivariate regression utilizing the logistic function could be viewed as one specific case of the maximum-likelihood method. If the manipulation used in this article was generalized within the maximum-likelihood method, and the dependent variable was permitted to take a continuous decimal value between zero and one, we presumed that this might produce more generalized results than those of the ordinal least-squares method.
When supplemented with this adjustment, the scatter plot representing the relationship between “the modified 18-item BPRS” and the CGI-SCH showed a distribution proportional to the scatter plot connecting the score of “the 18-item BPRS” multiplied by “Pi” for each i-th item and the score of the CGI-SCH. This is because both have almost the same significance on the graph. Additional improvements in fit may be possible.
The limitations of the present study should be noted. The first was the use of the CGI-SCH as a scale that substituted for the evaluation made by the patients’ psychiatrists. The CGI-SCH is not a gold standard and there is no evidence that the CGI-SCH has perfect linearity; this was merely an assumption to allow modification of the BPRS under a determinate condition. For the CGI-SCH, only a certain degree of reliability has been reported [3, 22,23]. Nonetheless, we thought that this kind of simplification was unavoidable and the trade-off necessary, even if this assumption would sacrifice rigor to some extent in exchange for examining the degree of an abstract value such as “linearity”.
Second, there is no evidence supporting the assumption that the BPRS score and the CGI-SCH score obtained retrospectively by coding of the symptoms reported in the clinical chart would be comparable to the data obtained prospectively. Mullins, et al. reported the utility of the Brief Psychiatric Rating Scale for Children (BPRS-C) for transcribing narrative medical records into a standard quantitative form in which the medical records were the primary sources of information and the inter-rater reliabilities were adequate in most major domains of psychopathology, the one notable exception being symptoms in the anxiety domain [33]. The value of Pearson’s r, 0.8216, might be to some extent considered high. We presume that this was because the study was retrospective. Therefore, some items of the BPRS might not have been marked, thus minimizing the distribution of the BPRS score. The ideal weighting of individual symptoms of the BPRS should be determined prospectively. However, one of themes intended to be examined in this study is whether increasing the magnitudes of independent variables of significance (e.g., symptom scores of the BPRS) that are positively associated with the dependent variable (e.g., the CGI-SCH score) and decreasing the magnitudes of those are negatively correlated with the dependent variable could heighten the degree of the correlation (e.g., Pearson’s r) of the two data sets, such as the BPRS and the CGI-SCH, keeping the same number of variables (symptom scores of the BPRS). From this standpoint, our report might be regarded as an experimental case report demonstrating some degree of validity for this manipulation (modification of point allocations utilizing the logistic function). At any rate, prospectively randomized trials are needed in future studies.
Third, the reproducibility of the result that all of the symptoms of the BPRS were positively correlated with the CGI-SCH using univariate linear regression is doubtful. As for the exclusion of any item, in general, the more variables we exclude from the model, the more r-squared tends to decrease. The selection of the subset for which the decrease of r-squared is smallest is preferred so that the loss of model fit would be minimal. As a result, because the items were not excluded after univariate linear regression in Figure 1 and the r-squared for the results of multivariate regression utilizing all 18 items did not change (0.7718), we did not address the problem of item selection in the present study. However, the true aim of this study was, if possible, to examine the effect of modification of point allocation alone on the degree of linearity (in this study, correlation between the two scales; e.g., Pearson’s r). As a further improved algorithm of Figure 1, after univariate regression, only positive and significant (p < 0.05) coefficients would be selected. In the further revised algorithm, the exclusion of items from the 18 item selection might occur in a first step of manipulation and different results might be obtained. This issue should be examined in a prospective study.
Fourth, there may be some problems in our treatment of the size of coefficients. We did not regard positive values for insignificant coefficients (whether those were positive or negative) for multivariate non-linear regression. Therefore, the size of insignificant “bi” terms was ignored by inserting “bi = 0”. As a result, relative point allocations of those insignificant items did not change and point allocations of items positively and significantly associated with the CGI-SCH score increased while those of negatively and significantly correlated items decreased. If there are few significant items after the procedure in Table 2, we infer that the degree of modification in this model is very low and that there might be some need of a device for adjustments. This is one of the future tasks that should be addressed rigorously.
Fifth, despite the manipulations employed here, the degree of change in Pearson’s r was rather ambiguous. The increases appear slight; as a total, from 0.8216 to 0.8491. Moreover, it is considerably uncertain whether this change has statistical significance. However, from another viewpoint, despite the fact that the number of items remained the same, the degree of correlation (Pearson’s r) increased just slightly and this fact might indicate the possibility that modification of point allocation itself might be able to heighten the correlation of the BPRS with the CGI-SCH. In the supplement, we confirmed that the Pearson’s r (when the BPRS was modified only through decreasing the magnitude of those items that were significantly inversely correlated with the CGI-SCH) was 0.8325, a value higher than that between the original 18-item BPRS and the CGI-SCH, but smaller than that between the fully modified 18-item BPRS and the CGI-SCH. This fact might imply that only decreasing the point allocation of inversely correlated symptoms of the BPRS could also heighten the linearity of the BPRS. However, as was said before, the reproducibility of point allocation is quite uncertain in this model. Therefore, a randomized prospective study of this question in the future is desirable.
Sixth, the modification of point allocation may have contributed some artifacts of multi-collinearity. There are likely to be inter-correlations among the data. In this study, variables that were inversely correlated with the CGI-SCH score, indicating that the more severe the BPRS item, the lower the CGI-SCH score (a phenomenon that was a departure from the clinicians’ experiences), were decreased in an ad hoc procedure. Additional unknown and complicated factors are predicted to exist as well; for example, that both inpatients and outpatients were evaluated by the CGI-SCH and that the results might have been negatively influenced by differences in cognitive ability [34].
Seventh, we consider that our model is only applicable for a pair of scales where one is a single score scale (e.g., the CGI-SCH) and the other is a plural score scale (e.g., the BPRS). The condition that those two scales are intended for the same state of illness and are in a positive relationship intrinsically, at least roughly, is presumed necessary. Otherwise, if the two are in an inverse relationship, for instance, as is the case between the CGISCH and the Global Assessment of Functioning (GAF) [8], the method we discussed might be expected to produce nothing.
Eighth, the range of scores from 1 to 7 on the CGISCH may have been narrow and floor and ceiling effects should not have been ignored. This problem would be remedied by prospective research to obtain a normallydistributed data set. In relation to details of the form of the scales, we speculate that a more precise way approached from another viewpoint might be possible, for example, utilizing a visual analogue scale (VAS) [35-39] or a numerical rating scale (NRS) [40,41] for the ratings by psychiatrists, both of which range from 0 to 10, for the scores that we substituted for the clinical impression (although the true estimation of their validity is in flux at present [42-48]). We chose instead the ordinal CGI-SCH scores, which range ordinarily from 1 to 7 (taking “0” as “not assessed”), to express the clinicians’ global impresssion of illness with schizophrenic patients. S. Stevens proposed a “ratio scale” on which four arithmetic operations could be possible [49]. As the “0” of the BPRS and of the CGI-SCH means “not assessed”, these might produce differences from the ordinal meaning of “0” (none) of the “ratio scale”. If so, the difference between the definitions of “0” might cause a distortion for the BPRS and the CGI-SCH. As we commented previously, the possible absence of linearity and of equal increments between each point of the CGI-SCH are serious problems that could not be ignored. In addition, the individual scores of the BPRS should ideally correspond to a visual analogue scale whose respective score ranges of 0 - 7 or 0 - 10 would have a more adequate degree of linearity than the CGI-SCH. If this condition were met, the BPRS would become one of the more linear evaluating scales.
Ninth, the modified 18-item BPRS should be regarded as a result based on mixed data from acute phase and chronic phase schizophrenic subjects. This origin might yield various types of biases and inadequate impressions (e.g., peculiar items that are likely to be observed strongly only in an acute or a chronic phase might be included in the modified scale presented in Figure 5). To define the “acute” or “chronic” phase of schizophrenia clearly was too complex and difficult an issue, so, ideally, the prototype we proposed tentatively in Figure 5 should be redetermined as several scales, one each for the acute phase, the chronic phase and others phases, through more rigorous definitions for various phases of schizophrenia, by way of prospective ratings.
Tenth, and above all, these results are not likely to be reproducible and our model has a meaning only for comparison purposes within a given study. If we performed the same procedure on new data, it is very likely that different point allocations would be assigned to individual items. We infer that a possible way to remedy this problem, even if partially, might be to perform a number of prospective trials in line with our method, and then summarize and calculate an average on items and point allocation. If these scales are composed as a summary, they might be less problematic than that of our trials. However, even in such scales, there would still be no assurance that they would have a greater degree of reproducibility. Therefore, the extent to which the results of this paper could be applicable may be quite limited. For this reason, future studies are necessary.
Eleventh, the problem that we have addressed may be insoluble in principle. This approach to optimizing many parameters (variables) so that a certain value would be maximized might not always provide the ideal magnitudes for the other values. The challenge of the setting of this study was to find the optimized value of individual symptoms whose severities were recognized independently when they were rated. If the solution of these kinds of problems, in which many values should be determined ideally at the same instant under the condition that a certain parameter (e.g., Pearson’s r) would take the maximum value, is impossible in principle, the applications might then be quite limited.
The true aim of the present study was not always to determine the best point allocation, but to consider a specific example of a potential modified BPRS through pursuing “the ideally modified BPRS” reflecting an abstract “true score”. Therefore, “the modified 18-item BPRS” is merely a tentative idea at this stage to propose a new viewpoint of the importance of point allocation in the BPRS. The present study has many limitations and is thus only a half-step from which further studies may learn. We believe that improving evaluation scales to make them more linear could minimize distortions in evaluations for severity of illness, including overand under-diagnosis and estimations for efficiency and effect in clinical research. We anticipate that our present results will serve as a useful reference for clinicians attempting to devise an evaluation scale, and that further research will focus on the optimal number of items, the fittest items for selection, and the allocation of marks in a rigorous methodology to maximize the linearity of the BPRS.
5. Conclusion
Within the limits of our data, a roughly logarithmic relationship was discerned between the two scales and the item-weightings of the BPRS (apart from item-selection) were identified as important for the improvement of the BPRS for evaluating schizophrenia.
6. Authors’ Contributions
JS performed the evaluation of the patients and the statistical analysis, and wrote the manuscript. SM also performed the evaluation of the patients and revised the manuscript. JI was responsible for checking the methodology of the study and evaluating the results of the statistical analysis. In addition, all authors read and approved the final version of the manuscript.
7. Acknowledgements
The authors wish to acknowledge Katsuji Nishimura, Ken Inada and Kaoru Sakamoto for providing us with very useful advice in this study.
REFERENCES
- J. P. Lindenmayer, P. D. Harvey, A. Khan and B. Kirkpatrick, “Schizophrenia: Measurements of Psychopathology,” Psychiatric Clinics of North America, Vol. 30, No. 3, 2007, pp. 339-363. doi:10.1016/j.psc.2007.04.005
- J. E. Overall and D. R. Gorham, “The Brief Psychiatric Rating Scale,” Psychological Reports, Vol. 10, No. 3, 1962, pp. 799-812. doi:10.2466/PR0.10.3.799
- J. M. Haro, S. A. Kamath, S. Ochoa, et al. and SOHO Study Group, “The Clinical Global Impression-Schizophrenia Scale: A Simple Instrument to Measure the Diversity of Symptoms Present in Schizophrenia,” Acta Psychiatrica Scandinavica, Suppl. 416, 2003, pp. 16-23. doi:10.1034/j.1600-0447.107.s416.5.x
- S. R. Kay, A. Fiszbein and L. A. Opler, “The Positive and Negative Syndrome Scale (PANSS) for Schizophrenia,” Schizophrenia Bulletin, Vol. 13, No. 2, 1987, pp. 261-276. doi:10.1093/schbul/13.2.261
- N. C. Andreasen, “Scale for the Assessment of Positive Symptoms (SAPS),” University of Iowa, Iowa City, 1984.
- N. C. Andreasen, “Scale for the Assessment of Negative Symptoms (SANS),” University of Iowa, Iowa City, 1983.
- J. Sawamura, S. Morishita and J. Ishigooka, “Is There a Linear Relationship between the Brief Psychiatric Rating Scale and the Clinical Global Impression-Schizophrenia scale? A Retrospective Analysis,” BMC Psychiatry, Vol. 10, 2010, p. 105. doi:10.1186/1471-244X-10-105
- American Psychiatric Association, “Diagnostic and Statistical Manual of Mental Disorders,” 4th Edition, American Psychiatric Publishing, New York, 2000.
- C. R. Mehta and N. R. Patel, “Exact Logistic Regression: Theory and Examples,” Statistics in Medicine, Vol. 14, No. 19, 1995, pp. 2143-2160. doi:10.1002/sim.4780141908
- B. J. Friedman, T. Hastie and R. Tibshirani, “Additive Logistic Regression: A Statistical View of Boosting,” The Annals of Statistics, Vol. 28, No. 2, 2000, pp. 337-407. doi:10.1214/aos/1016218223
- B. Jorgensen, “Maximum Likelihood Estimation and LargeSample Inference for Generalized Linear and Nonlinear Regression Model,” Biometrika, Vol. 70, No. 1, 1983, pp. 19-28. doi:10.1093/biomet/70.1.19
- F. E. Harrell Jr., “Regression Modeling Strategies: With Applications to Linear Models, Logistic Regression, and Survival Analysis,” 2nd Edition, Springer-Verlag, New York, 2001.
- F. E. Harrell Jr. and K. L. Lee, “Regression Modeling Strategies for Improved Prognostic Prediction,” Statistics in Medicine, Vol. 3, No. 2, 1984, pp. 143-152. doi:10.1002/sim.4780030207
- F. E. Harrell Jr., K. L. Lee, D. B. Matchar and T. A. Richert, “Regression Models for Prognostic Prediction: Advantages, Problems, and Suggested Solutions,” Cancer Treatment Reports, Vol. 69, No. 10, 1985, pp. 1071-1077.
- T. R. Dawber, G. F. Meadors and F. E. Moore Jr., “Epidemiological Approaches to Heart Disease: The Framingham Study,” American Journal of Public Health, Vol. 41, No. 3, 1951, pp. 279-286. doi:10.2105/AJPH.41.3.279
- T. Gordon, W. P. Castelli, M. C. Hjortland, W. B. Kannel and T. R. Dawber, “High Density Lipoprotein as a Protective Factor against Coronary Heart Disease,” The American Journal of Medicine, Vol. 62, No. 5, 1977, pp. 707-714. doi:10.1016/0002-9343(77)90874-9
- S. H. Walker and D. Duncan, “Estimation of the Probability of an Event as a Function of Several Independent Variables,” Biometrika, Vol. 54, No. 1-2, 1967, pp. 167- 179. doi:10.1093/biomet/54.1-2.167
- Stata Corporation, “Stata User’s Guide, Release 10.0,” Stata Corporation, College Station, 2007.
- SPSS Inc., “SPSS for Windows Version 14,” SPSS Inc., Chicago, 2007.
- Microsoft Corporation, “Microsoft Excel 2003,” Microsoft Corp., Redmond, Washington DC, 2003.
- J. L. Hedlund and B. W. Vieweg, “The Brief Psychiatric Rating Scale (BPRS): A Comprehensive Review,” Journal of Operational Psychiatry, Vol. 11, No. 1, 1980, PP. 48-65.
- S. Leucht and R. Engel, “The Relative Sensitivity of the Clinical Global Impressions Scale and the Brief Psychiatric Rating Scale in Antipsychotic Drug Trials,” Neuropsychopharmacology, Vol. 31, No. 2, 2006, pp. 406-412. doi:10.1038/sj.npp.1300873
- S. Leucht, J. M. Kane, W. Kissling, J. Hamann, E. Etschel and R. Engel, “Clinical Implications of Brief Psychiatric Rating Scale Scores,” British Journal of Psychiatry, Vol. 187, No. 4, 2005, pp. 366-371. doi:10.1192/bjp.187.4.366
- M. J. Müller, W. Rossbach, P. Dannigkeit, F. MüllerSiecheneder, A. Szegedi and H. Wetzel, “Evaluation of Standardized Rater Training for the Positive and Negative Syndrome Scale (PANSS),” Schizophrenia Research, Vol. 32, No. 3, 1998, pp. 151-160. doi:10.1016/S0920-9964(98)00051-6
- D. Naber and A. Vita, “Tools for Measuring Clinical Effectiveness,” European Neuropsychopharmacology, Vol. 14, Suppl. 4, 2004, pp. S435-S444. doi:10.1016/j.euroneuro.2004.08.002
- R. Tandon, R. F. Devellis, J. Han, H. Li, S. Frangou, S. Dursun, J. N. Beuzen, W. Carson, P. K. Corey-Lisle, B. Falissard, D. N. Jody, M. J. Kujawa, G. L’italien, R. N. Marcus, R. D. McQuade, S. Ray, P. Van Peborgh and IAQ Validation Study Group, “Validation of the Investigator’s Assessment Questionnaire, a New Clinical Tool for Relative Assessment of Response to Antipsychotics in Patients with Schizophrenia and Schizoaffective Disorder,” Psychiatry Research, Vol. 136, No. 2-3, 2005, pp. 211-221. doi:10.1016/j.psychres.2005.05.006
- T. Suzuki, H. Uchida, K. Nomura, H. Takeuchi, S. Nakajima, A. Tanabe, G. Yagi, K. Watanabe and H. Kashima, “Novel Rating Scales for Schizophrenia-Targeted Inventory on Problems in Schizophrenia (TIP-Sz) and Functional Assessment for Comprehensive Treatment of Schizophrenia (FACT-Sz),” Schizophrenia Research, Vol. 106, No. 2-3, 2008, pp. 328-336. doi:10.1016/j.schres.2008.08.013
- G. M. Burlingame, T. W. Dunn, S. Chen, A. Lehman, R. Axman, D. Earnshaw and F. M. Rees, “Selection of Outcome Assessment Instruments for Inpatients with Severe and Persistent Mental Illness,” Psychiatric Services, Vol. 56, No. 4, 2005, pp. 444-451. doi:10.1176/appi.ps.56.4.444
- C. M. Judd, G. H. McClelland and C. S. Ryan, “Data Analysis: A Model Comparison Approach,” 2nd Edition, Routledge/Taylor and Francis, New York, 2009.
- F. E. Harrell, “Regression Modeling Strategies with Applications to Linear Models, Logistic Regression, and Survival Analysis,” Springer, New York, 2001.
- J. Lee, “Covariance Adjustment of Rates Based on the Multiple Logistic Regression Model,” Journal of Chronic Diseases, Vol. 34, No. 8, 1981, pp. 415-426. doi:10.1016/0021-9681(81)90040-0
- K.-Y. Liang and S. L. Zeger, “Longitudinal Data Analysis Using Generalized Linear Models,” Biometrika, Vol. 73, No. 1, 1986, pp. 13-22. doi:10.1093/biomet/73.1.13
- D. Mullins, B. Prefferbaum, H. Schultz and J. E. Overall, “Brief Psychiatric Rating Scale for Children: Quantitative Scoring of Medical Records,” Psychiatric Research, Vol. 19, No. 1, 1986, pp. 43-49. doi:10.1016/0165-1781(86)90091-0
- J. S. Brekke, B. Kohrt and M. F. Green, “Neuropsychological Functioning as a Moderator of the Relationship between Psychosocial Functioning and the Subjective Experience of Self and Life in Schizophrenia,” Schizophrenia Bulletin, Vol. 27, No. 4, 2001, pp. 697- 708. doi:10.1093/oxfordjournals.schbul.a006908
- M. H. S. Hayes and D. G. Patterson, “Experimental Development of the Graphic Rating Method,” Psychological Bulletin, Vol. 18, 1921, pp. 98-99.
- M. Freyd, “The Graphic Rating Scale,” Journal of Educational Psychology, Vol. 14, No. 2, 1923, pp. 83-102. doi:10.1037/h0074329
- N. Crichton, “Information Point: Visual Analogue Scale (VAS),” Journal of Clinical Nursing, Vol. 10, No. 5, 2001, pp. 697-706.
- G. B. Langley and H. Sheppeard, “The Visual Analogue Scale: Its Use in Pain Measurement,” Rheumatology International, Vol. 5, No. 4, 1985, pp. 145-148. doi:10.1007/BF00541514
- V. A. L. Williams, R. Morlock and D. Feltner, “Psychometric Evaluation of Visual Analog Scale for the Assessment of Anxiety,” Health and Quality of Life Outcomes, Vol. 8, 2010, p. 57. doi:10.1186/1477-7525-8-57
- D. C. Turk, T. E. Rudy and B. A. Sorkin, “Neglected Topics in Chronic Pain Treatment Outcome Studies: Determination of Success,” Pain, Vol. 53, No. 1, 1993, pp. 3-16. doi:10.1016/0304-3959(93)90049-U
- J. T. Farrar, J. P. Young Jr., L. LaMoreaux, J. L. Werth and R. M. Poole, “Clinical Importance of Changes in Chronic Pain Intensity Measured on an 11-Point Numerical Pain Rating Scale,” Pain, Vol. 94, No. 2, 2001, pp. 149-158. doi:10.1016/S0304-3959(01)00349-9
- D. D. Price, P. A. McGrath, A. Rafii and B. Buckingham, “The Validation of Visual Analogue Scales as Ratio Scale Measures for Chronic and Experimental Pain,” Pain, Vol. 17, No. 1, 1983, pp. 45-56. doi:10.1016/0304-3959(83)90126-4
- J. S. Dixon and H. A. Bird, “Reproducibility along a 10 cm Vertical Visual Analogue Scale,” Annals of the Rheumatic Diseases, Vol. 40, No. 1, 1981, pp. 87-89. doi:10.1136/ard.40.1.87
- C. Maxwell, “Sensitivity and Accuracy of the Visual Analogue Scale: A Psycho-Physical Classroom Experiment,” British Journal of Clinical Pharmacology, Vol. 6, No. 1, 1978, pp. 15-24.
- S. M. Grunberg, S. Groshen, S. Steingrass, S. Zaretsky and B. Meyerowitz, “Comparison of Conditional Quality of Life Terminology and Visual Analogue Scale Measurements,” Quality of Life Research, Vol. 5, No. 1, 1996, pp. 65-72. doi:10.1007/BF00435970
- C. T. Hartrick and J. P. Kovan, “The Numeric Rating Scale for Clinical Pain Measurement: A Ratio Measure?” Pain Practice, Vol. 3, No. 4, 2003, pp. 310-316. doi:10.1111/j.1530-7085.2003.03034.x
- L. J. DeLoach, M. S. Higgins, A. B. Caplan and J. L. Stiff, “The Visual Analog Scale in the Immediate Postoperative Period: Intrasubject Variability and Correlation with a Numeric Scale,” Anesthesia and Analgesia, Vol. 86, No. 1, 1998, pp. 102-106. doi:10.1097/00000539-199801000-00020
- P. S. Myles, S. Troedel, M. Boquest and M. Reeves, “The Pain Visual Analog Scale: Is It Linear or Nonlinear?” Anesthesia and Analgesia, Vol. 89, No. 6, 1999, pp. 1517- 1520.
- S. S. Stevens, “On the Theory of Scales of Measurement,” Science, New Series, Vol. 103, No. 2684, 1946, pp. 677-680. doi:10.1126/science.103.2684.677