Journal of Transportation Technologies
Vol.4 No.1(2014), Article ID:42486,9 pages DOI:10.4236/jtts.2014.41011
Investigation Motorcycle Safety at Exit Ramp Sections by Analyzing Historical Crash Data and Rider’s Perception
1Department of Civil Engineering, Embry-Riddle Aeronautical University, Daytona Beach, USA
2Center for Urban Transportation Research, University of South Florida, Tampa, USA
Email: hongyun.chen@erau.edu, clee@cutr.usf.edu, lin@cutr.usf.edu
Received August 30, 2013; revised October 1; 2013; accepted November 3, 2013
ABSTRACT
The purpose of this study is to evaluate the safety performance of four exit ramp types and the major contributing factors on motorcycle crashes and injury severity of motorcycle riders. A six-year crash data were collected in Florida, and a web-based survey (234 samples) was conducted. 573 crashes were found at 419 exits, including 178 diamond exits, 71 directional exits, 85 loop exits and 85 outer connection exits. For a diamond exit, both the survey and crash data showed that this type was safer and more preferable by motorcycle riders; while a loop exit was the most dangerous exit due to the sharp curve and a certain length of curve with limited visibility. For a directional exit, longer ramp lengths and the reverse curvature are the major factors causing motorcycle crashes. For an outer connection exit, the riders rated it as a safe type; however, the data showed higher average crash frequency and rate than those at diamond exits or directional exits. The possible reason could be the unexpected curvature in the middle of the ramp, which could be dangerous if the rider is not familiar with the exit ramp location or doesn’t pay attention to the ramp curvatures. The crash predictive model was developed, and the result indicated that if all remained the same, a directional exit, a loop exit, or an outer connection exit will have 16%, 27%, and 42% more crashes than a diamond exit, respectively. The findings from this study can help policy-makers and engineers to develop and apply effective countermeasures to reduce motorcycle crashes and injury severity levels for different exit ramp types.
Keywords:Motorcycle Safety; Exit Ramp Configurations; Crash Modeling; Riders’ Survey
1. Introduction
Unlike an auto or truck, a motorcycle itself provides virtually no protection in a crash. According to National Highway Traffic Safety Administration (NHTSA), in 2010, motorcyclists accounted for 3% of all registered vehicles in the United States with only 0.6% of all vehicle miles traveled, while motorcyclists accounted for 14% of all traffic fatalities and 16% of all occupant fatalities. The motorcycle fatality and injury rates are extremely high, about 3300% and 500% more compared to average motor vehicle fatality and injury rates respectively [1].
To find a proper remedy for this rising concern in an effective and efficient manner, it is important to understand high crash prone locations and the contributing factors. Savolainen and Mannering [2] found that critical areas and contributing factors for motorcycle crashes included the following characteristics: presence of horizontal and vertical curvatures, speeding, alcohol use and age. Exit ramps are the only control accesses from freeways to secondary crossroads and they do generally include a section of curvature. To conduct a safe maneuver at an exit ramp, motorcycle riders should slow down to a safe exit speed in a timely manner and negotiate the curve by leaning the motorcycle to a certain extent. This requires a proper visual assessment of the curve as well as good positioning of the motorcycle on the traffic lane, which are both relatively challenging tasks for many motorcycle riders.
A recent study found that ramps were the risk areas where more crashes were likely to occur [3]. However, there is limited information available regarding the type of exit ramp associated with motorcycle crashes. A preliminary analysis was conducted by the research team. Approximately, 80% of reported motorcycle crashes at exit ramps result in injury or death from 2005 to 2010 in the State of Florida. Therefore, the objective of this study is to understand and determine the impacts of different exit types and contributing factors on motorcycle crashes and injury severity of motorcycle riders.
2. Typical Exit Ramp Types
Exit ramps are all one-way roads with one or more legs at terminals connecting secondary crossroads. Many possible influential factors might affect the safety, including ramp configurations, ramp design speed, volume, number of lanes, ramp length, etc. Ramp configurations are generally considered as ramp types. Previous studies concluded that different ramp types have significantly different impacts on traffic safety [4-6]. Figure 1 shows four typical exit ramp types defined by America Association of State Highway and Transportation Officials (AAHTO) Green Book [7]: a diamond exit, a directional exit, a loop exit, and an outer connection exit.
Diamond exits are the most common interchange configurations applied in both rural and urban areas with major-minor crossings. A diamond exit is a relatively straight roadway and the capacity is limited. Loop exits have continuous curvature changes (usually sharp curvatures) along the exits providing major-minor connections with high right-turn volumes to the minor road. Directional exits are usually used for important turning movements, connecting either a freeway to a freeway or a freeway to a major highway. The exit typically heads right first and then gradually reverses the direction until entering the secondary road. In comparison to loop exits, directional exits have the benefit of higher operating speeds, higher levels of service (LOS), shorter travel distance, and less weaving. Outer connection exits are similar to diamond exits except that some curves exist in the middle of the ramps due to the inner entrance ramp (on-ramp). The selection of ramp configuration is not solely dependent upon one factor, but on a combination of area type, volume, availability of right-of-way, cost, etc.
Previous studies demonstrated that Poisson and the negative binomial (NB) regression models are appropriate to predict crashes in the interchange areas. Lundy [4] was the first one to determine the crash rates by ramp types and concluded that diamond ramps have the lowest crash rate while loop ramps have a higher crash rate due to the higher curvature. In 1998, Bauer and Harwood’s study combined a total of 356 exit ramps and 287 en-
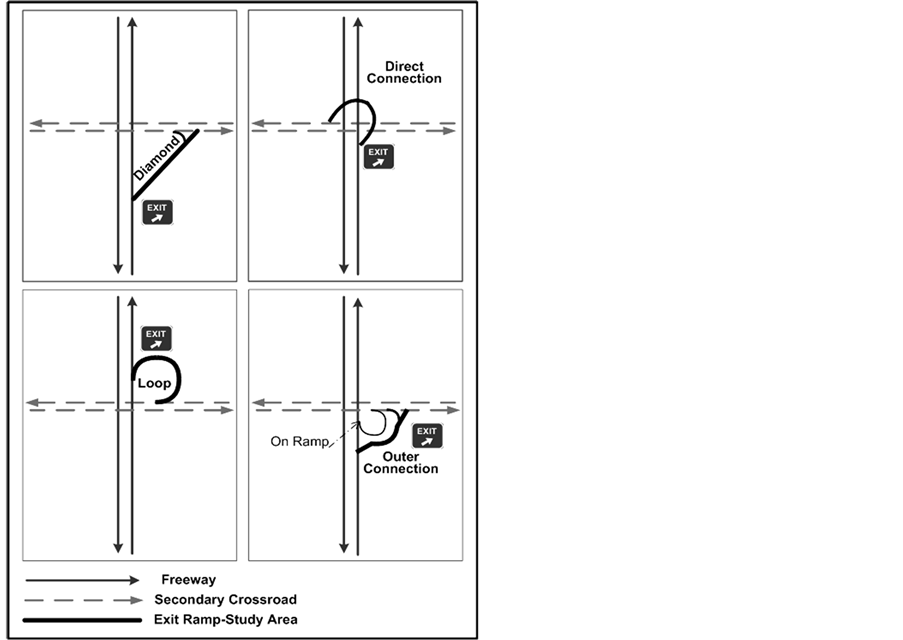
Figure 1. Four typical exit ramp types.
trance ramps and the results showed similar patterns to Lundy’s study. Diamond ramps have lower crash rates than loop ramps while both outer connection and directional exits have slightly higher crash rates than that of diamond exits [5]. The conclusions are consistent with the latest study conducted by Chen and Lu [6]. Diamond and outer connection exits have the best safety performance while free-flow loops are norecommended in terms of the high crash rate and injury severity level.
However, all the aforementioned conclusions were made based on all motor vehicle crashes. These conclusions cannot be directly applied to motorcycles since different types of ramps might have different impacts on motorcycles, as motorcyclists are more vulnerable, react differently, and are more sensitive to grades and curvatures [5,8-10]. Thus, this study attempts to understand and determine the influence of different exit types and contributing factors on motorcycle crashes and injury severity of riders.
3. Data Collection and Methodology
3.1. Crash Data Collection
Crash data were obtained from the Florida Traffic Crash Records Database containing all motorcycle related crashes with geo-coordinates from 2005 to 2010. Crash events were plotted in the Geographic Information Systems (GIS) with Google map; therefore, the ramp types, and crash locations (gore area, main section, and merging section) could be determined visually at each exit ramp. The geometrics, traffic, and other related data were collected from FDOT Roadway Characteristic Inventory (RCI) database. Each identified ramp had at least one crash count during the six-year study period. Alcohol or drug involved crashes were excluded from the database as these crashes may be directly caused by the influence of alcohol or drugs but not the types of ramp types.
Crash counts, crash rates (defined as crashes per million vehicles per mile per day), crash severity, crash types, and main contributing factors were compared by four exit types. There are five categories in the injury severity levels in the crash database: no injury/Property Damage Only (PDO), possible injury, non-incapacitating evident injury, incapacitating injury, and fatal injury (an injury sustained in a crash resulting in death within 30 days). Each crash level was compared by the percentages among the four exit types.
3.2. Web-Based Motorcycle Rider Survey
A web-survey was conducted to collect motorcycle riders’ perceptions and attitudes toward the four exit ramp types. A total of 800 motorcycle riders who participated in the 2011 Florida motorcycle survey were invited by email to participate in this web survey. The participants’ ages, genders, motorcycle types, and riding experiences were collected, as detailed in Table1
A total of 272 responses were initially received, of which 38 responses were incomplete. As a result, 234 responses were used for an analysis. Nearly 84.2% of the respondents (197) had more than 5 years of riding experience and most of the respondents (80%) were aged from 25 to 64. Figure 2 was presented in the survey and the participants were asked to rank the ramp types from the most dangerous to the least dangerous, with an explanation of their selections. A score was assigned to each response. Score “1” indicates the most dangerous type and “4” is the safest one compared to the other three types.
3.3. Statistical Methodology
3.3.1. Statistical Test
Cross-sectional comparisons have proved to be valuable and were performed by past studies [11]. For the collected crash data, statistical tests (t tests and proportionality tests) were used to quantitatively evaluate whether or not the safety performances are statistically significantly between different exit ramp types by average crash rates and injury severity levels. A significance level of 0.05 was selected.

Table 1. Summary of riders demographic information.
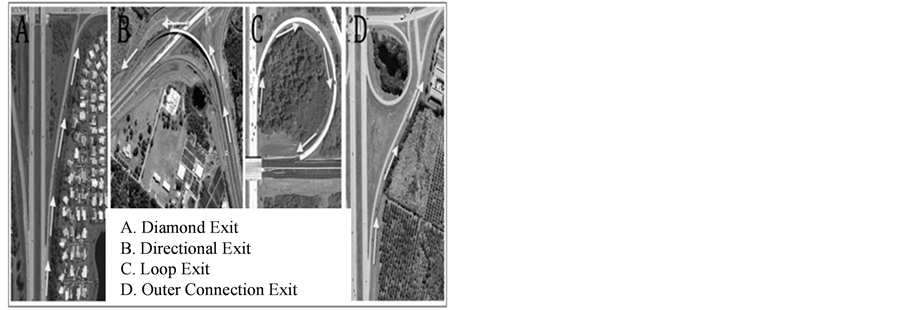
Figure 2. Four ramp types pictures for web-survey.
3.3.2. Negative Binomial Model
The Poisson and NB models have been widely used to model crash counts [10,12,13]. The NB model is generally preferred to solve the overdispersion problem (variance larger than mean). Schneider IV et al. [10] used a NB model to assess the impacts of horizontal curvatures on the crash frequency of 225 single-vehicle motorcycle crashes along rural two-lane highways. The model result indicated that a 1% change in curve length leads to 0.39% increase in crash frequency. The NB model assumes that the crash counts are Poisson-gamma distributed. The probability density function of the negative binomial model is given by Equation (1) [13]:
 (1)
(1)
where  = the crash count at exit i,
  = the expected crash counts at exit i, Γ () = gamma function, α = the dispersion parameter.
The inverse of the dispersion parameter determines the variance of the Poisson-gamma distribution. If it is zero, the negative binomial regression model converges to a Poisson regression model. Usually α and estimated coefficients of explanatory variables can be estimated by the Maximum Likelihood Method. The below Equation (2) shows the maximum likelihood parameter (L) with likelihood function estimating the parameters of a negative binomial regression model [10]:
 (2)
(2)
Then, the fitted crash prediction model can be converted to a linear function of the explanatory variables in Equation (3):
 (3)
(3)
where,  = constant,
  = coefficients of explanatory variables;
  = explanatory variables affecting motorcycle crashes on exit ramps section i;
If the linear predictor is a linear function of the logarithm of the explanatory variables, the functional form can be converted to:
 (4)
(4)
4. Crash Data Analysis
From 2005 to 2010, a total of 573 motorcycle-involved crashes were found at 419 selected sites, including 178 diamond exits, 71 directional exits, 85 loop exits, and 85 outer connection exits. The descriptive statistics are listed in Table2 The diamond exit shows a relatively lower average crash frequency (1.19 crashes per site) followed by the directional exit (1.43 crashes per site), the loop exit (1.44 crashes per site), and the outer connection exit (1.60 crashes per site). The average crashes per site for an outer connection exit were found to be 26%, 11%, and 10% more than a diamond exit, a directional exit, and a loop exit respectively.
While comparing the average crash rate among the
Table 2 . Summary of motorcycle crash frequency and crash rate by four exit types.
four types, no substantial difference was observed between the diamond exit (0.52 crashes per million vehicles per mile per day per site) and the directional exit (0.61 crashes per million vehicles per mile per day per site). This, rather, can be explained by the different lengths of the exit ramps. Generally, directional exits are longer than other ramp types due to the design layout, while loop exits are usually shorter. At the selected 419 sites, the average ramp lengths were found to be 0.34 miles for the diamond exits, 0.50 miles for the directional exits, 0.28 miles for the loop exits, and 0.39 miles for the outer connection exits.
Loop exits and outer connection exits were found to be more dangerous for motorcycle riders than the other two types, considering both have high average crash counts and crash rates. Interestingly, the results are slightly different from previous studies with all vehicles [4-6]. A possible reason for high crash counts and crash rates for outer connection exits might be the unexpected occurrence of curvature and curvature changes in the middle of the ramps compared to the straight diamond ramps, especially when riders are not familiar with locations. Motorcycle riders might not be able to negotiate the curved section effectively if they fail to decelerate the motorcycle and place it in the correct position. Schneider et al. [10] found that it is significantly more difficult for the motorcycle rider to brake on curves, even for skilled riders compared to a tangent section. For the loop exit, more than two-thirds and one-third crashes can be observed as compared to that at the diamond/directional exits.
Table 3 lists the injury severity levels by each ramp type from 2005 to 2010. Exit ramps are high risk areas with an average of 4.54% fatal crashes and 29.67% of incapacitating injury crashes. The loop exits have a relatively higher percentage of fatal crashes (6.56%), followed by directional exits (4.90%), diamond exits (4.23%), and outer connection exits (2.94%). Though outer connection and loops have high crash counts and
Table 3. Injury severity levels of motorcycle crashes by four exit types and all motorcycle crashes.
crash rates; crashes on the loop ramps, including long and sharp curves, resulted in more severe consequences than the outer connection exits. About 33% of the total crashes are severe crashes for the diamond exits, directional exits, and outer connection; while almost 40% crashes of the loop exits result in either a fatal or an incapacitating injury.
T-tests and proportionality tests were conducted to compare whether there are significant differences in crash frequency, crash rates, and injury severities between the four exit types. The results evidence that diamond exits have significantly less crash counts than the other three types, at a 95% confidence level; however, it was also found no significant differences of average crash counts among the other three types. Table 4 shows the t-test and proportionality test results of average crash rates (highlighted in dark grey) and the percentage of severe crashes between two exit types. The loop exits have a significantly higher average crash rate than the diamond exits and the directional exits; while the difference between the loop exits and the outer connection exits is not statistically significant. The percentages of severe crashes (fatal plus incapacitating injury) among the four exit types are not significant as well. The result is consistent with previous findings as exit ramps are high risk areas where the consequences of crash occurrences are usually severe and the differences among exit ramp types are not significant.
Further analysis was conducted to understand crash types, crash contributing factors, and prone locations. Figures 3 and 4 show the percentages of crash types and major contributing factors. “Overturned” and “Collided with fixed object” are the most prevalent types of all motorcycle crashes. The definition of “fixed object” includes poles, trees, barrels, signs, or any fixed objects on the roadside of the exits determined by the long form crash report. Normally, the operating speeds on the exit ramps are higher than the design speeds [9,14].
It would be more difficult for motorcycles to react to the geometric changes or unexpected situations and turn smoothly than passenger cars under a high operating speed. The authors recommend that countermeasures should focus on implementing safety improvements in geometric changes, or/and speed enforcements. The outer
Table 4 . Statistical test results of crash rates and injury severity levels by four exit types.
connection exit has the highest percentage of crashes caused by exceeding the safe speed limit of the four types. Higher travelling speed would reduce the perception-reaction time for riders to properly react to the geometric changes and traffic patterns. Thus, it would increase the risk of being involved in crashes for riders and interpret the reason that the outer connection exit has the highest average crash counts among the four exit types.
Each crash was plotted in a GIS map so that the crash locations along the exit ramp could be divided into three sections: the exit ramp within gore areas, which might be influenced by the freeways; the main ramp sections; and the crossing/merging sections, which might be influenced by the secondary roads. The average percentages of crashes located in the three segments are listed in Figure 5. The crash analysis proves that the crossing/merging section of a diamond exit is more dangerous than the other three types, with the highest percentage (28%) of crashes. For loop exits, the probability (50%) of crashes occurring in the main ramp section is equally within the gore areas and the crossing/merging areas. Directional exits had a slightly higher percentage of crashes in the main ramp sections since the ramp length for this type is usually much longer. However, for the outer connection exits, more than two-thirds of the crashes were located in the main ramp sections. This can be explained by the unexpected curves in the middle of the ramp, which highly affects the motorcycle’s safety.
5. Motorcycle Crash Predictive Model
Poisson, and the NB regression models were initially selected to develop the crash counts during the study

Figure 3. Percentages of crash types by four exit types and all motorcycle crashes.
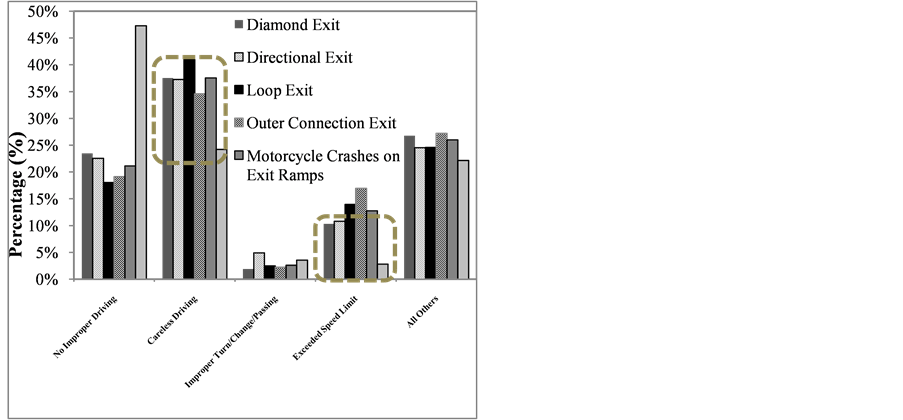
Figure 4. Percentages of contributing factors by four ramp types and all motorcycle crashes.

Figure 5. Percentages of motorcycle crash locations by four exit types.
period. A negative binomial model was finally selected to have the best fitted model. Ten independent variables were initially selected, containing one count variable, four continuous variables, three dummy variables (indicating four ramp types), and two ordinary variables. Table 5 lists all of these variables including geometric features, traffic data, demographic data, and other related variables, obtained from Florida RCI database. To get the best estimated model, correlations between variables and different functional forms of continuous variables were tested. 0.05 was selected as the significant level.
Table 6 shows the results of the final model with six variables: exit ramp types (directional exit, loop exit, outer connection exit), ramp length, average annual daily traffic (AADT), and posted speed limit. The increasing ramp length and traffic volume will certainly increase the total motorcycle-involved crashes. From the model, every 0.1 mile increase of the ramp length will lead to a 5% increase in the total motorcycle-involved crashes (all other conditions are same). Similarly, a 5 mph increase in the posted speed limit will cause a 7% increase in crashes if other variables remain unchanged.
Exit types were found to be the most significant factors affecting motorcycle-involved crashes with a 95% confidence level. If all of the selected variables remain the same, a directional exit, a loop exit, or an outer connection exit will have 16%, 27% and 42% more crashes than a diamond exit respectively. The model results confirm that diamond exits have the best safety performance with the lowest crash counts while the other three types have significantly higher crash counts than diamond exits. In addition, compared to the previous study for all motor vehicles [6,10] motorcycle riders should be cautious while travelling on the outer connection due to the unexpected curves and should not operate their motorcycle at a high rate of speed.
6. Motorcycle Riders’ Web-Based Survey
A web-survey was conducted to collect motorcycle riders’ perceptions and attitudes toward the four exit ramp types and results were compared with crash data analysis. Figure 6 exhibits the counts of each score and average scores for four exit types. About half of the riders (103 out of 234) rated diamond exits as the safest exit ramp type while over 60% (145 out of 234) believed that loop exits were the most dangerous exit type. The average score was 3.05 for a diamond exit, 2.98 for an outer connection exit, 2.32 for a directional exit, and 1.65 for a loop exit. Diamond exits were considered to be a safer design than the outer connection and directional exits, while loop exits were considered not preferable for riders.
A total of 172 riders (74%) rated a diamond exit as the safest (score: 4) or less dangerous (score: 3) ramp. They commented that less turning would be safer. Most of the riders mentioned that a diamond exit was simple and straight, requiring less turning, and they reported that they were able to clearly look ahead to adjust for the correct speed and direction. The safety problem of a di
Table 5. Descriptive statistics of original selected variables.
Table 6. Negative binomial regression model for total motorcycle crashes on exit ramps from 2005 to 2010.
amond exit is the ramp terminal control. A total of 29 responders rated a diamond exit as the most dangerous and 20 of them thought a left turn to cross the intersection at the end of the ramp was more dangerous than merging to the secondary street, as with the loop and directional exits. Ramp terminals are usually a four-leg or T intersection either with stop signs or traffic lights controls. From this point, the authors believe that it is
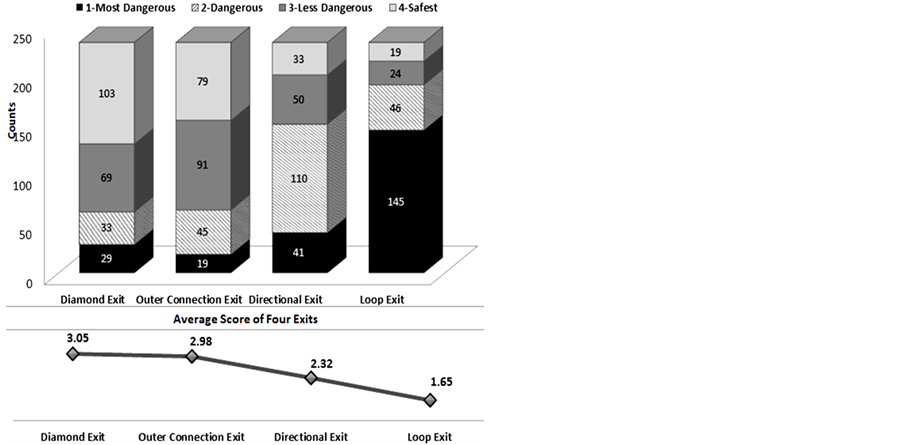
Figure 6. Counts of each score and average scores by four exit types based on web-survey data.
dangerous for any riders to make a left turn at an intersection than merging, not only at the ramp terminals.
A total of 191 riders (82%) rated a loop exit as the most dangerous (score: 1) or dangerous (score: 2) ramp. The major problem of a loop ramp is the continuous curve with a high turning speed which requires maximum attention and skills. The tighter a loop ramp, the more chance to lose control and be involved in a crash. With limited visibility and little room to turn, the loop ramp does not incorporate enough space to slow down gradually, and thus heavy braking is required. Rain or surface moisture can make a loop ramp even more dangerous.
About 50% of the responders rated the directional exits as the second most dangerous ramp for two reasons. First, a directional exit is too long and riders can easily not pay attention. Secondly, a reverse curve in the middle of the ramp usually has a raised curb or a guard rail and motorcycles can easily hit a fixed object if the turn is not properly maneuvered. However, compared to a loop exit, a directional loop has more space for a rider to adjust their speed smoothly.
The average score for an outer connection exit is 2.98, a little bit lower than that for a diamond exit. However, the fewest number of people rated it as the most dangerous ramp. Some riders stated that this ramp was not common to them. The possible reason might be riders not unfamiliar with the outer connection exit compared a diamond exit which is widely used. So riders will have less direct riding experiences on the outer connection exit. However, it also shares the same problem with a diamond exit of the switching and crossing the secondary street if riders want to make a left turn. Some skilled riders mentioned that another potential safety problem is that it would be dangerous if the rider was not familiar with this ramp due to the high existing speed and hard to adjust speed if there is a curve ahead. The authors believe that this explains the reason that this exit type had high crash counts.
Overall, the web-survey results reveal that a diamond exit requires less riding skills and is safer and more preferable to other exit types; however, more attention needs to be paid to the ramp terminal if the riders need to cross the secondary street. It is the same for an outer connection exit, which could be more dangerous if the riders are not familiar with this kind of ramp. A loop exit is the most dangerous exit and not preferred by most riders. For a directional exit, longer ramp lengths and the reverse curvature with fixed objects are the major factors causing motorcycle-involved crashes.
7. Conclusions
This study evaluated the safety performance of four exit ramp types and related contributing factors of motorcycle crashes by using crash data and a web-based survey. Statistical tests and a negative binomial regression model were adopted to assess the association between the ramp types and motorcycle crashes.
According to the study, the diamond exit is the safest exit ramp type for motorcycles in terms of the lowest average crash frequency, crash rate and percentage of severe crashes. The statistical tests showed that diamond exits had a significantly lower crash frequency compared to the other three exit ramp types at a 95% confidence level, which was consistent with the result of the webbased survey. Riders expressed that a diamond exit generally required less riding skills and was safer and more preferable than other exit types.
A loop exit is the most dangerous exit due to the short, tight and continuous curve that can make riders easily feel out of control with limited visibility and room to negotiate. For a directional exit, longer ramp lengths and the reverse curvature are the major factors causing motorcycle-involved crashes. As for the outer connection exit, the crash data analysis result and web survey result are not quite consistent. According to the web survey, most riders indicated that it was similar to a diamond exit in many aspects. However, the study found that it had a high motorcycle crash frequency and crash rate. The possible reason could be the unexpected curvature change in the middle of ramp while riders travel at a relatively high operating speed. This can cause an unsafe environment for motorcycle riders as motorcycles can be more easily overturned or face more under-steering than passenger cars. It is noted that some skilled riders commented that the outer connection exits would be dangerous if the rider was not familiar with the given geometry.
It was also found that exit ramps had a higher injury level but no significant difference was found among exit types. The negative binomial was developed, and the final model included six variables: three exit types, ramp length, average annual daily traffic (AADT) and ramp speed limit. Exit ramp types were found to be the most significant factors in motorcycle crashes at a 95% confidence level. If all of the selected variables remain the same, a directional exit, loop exit, or outer connection exits will have 16%, 27%, and 42% more crashes than a diamond exit.
The findings from this study can help engineers to develop and apply effective countermeasures to reduce motorcycle crashes and injury severity levels for different exit ramp types. For example, enhancing speed enforcement, limiting and reducing sharp curves, providing proper warning, or conducting outreach to both motorcycle riders and car drivers might be efficient ways to make exits safer. In addition, the ramp terminal type (diverging/crossing/merging) is an important factor for motorcycle safety according to the web-based survey. Selecting optimal ramp terminal types, control types (signalized/stop signs), and improving secondary street geometrics can be expected to improve motorcycle safety.
REFERENCES
- National Highway Traffic Safety Administration (NHTSA), “Traffic Safety Facts 2010 Data—Motorcycles,” DOT HS 811 639, 2010. http://www-nrd.nhtsa.dot.gov/Pubs/811639.pdf
- T. P. Savolainen and F. Mannering, “Probabilistic Models of Motorcyclists’ Injury Severity in Singleand MultiVehicle Crashes,” Accident Analysis and Prevention, Vol. 39, No. 5, 2007, pp. 955-963. http://dx.doi.org/10.1016/j.aap.2006.12.016
- D. Chimba, C. J. Lan and J. B. Li, “Statistical Evaluation of Motorcycle Crash Injury Severities by Using Multinomial Models,” Transportation Research Board Annual Meeting, Washington DC, 2006.
- R. A. Lundy, “The Effect of Ramp Type and Geometry on Accidents,” California Department of Public Works, Division of Highways, Sacramento, 1965.
- M. K. Bauer and W. D. Harwood, “Statistical Models of Accidents on Interchange Ramps and Speed-Change Lanes,” FHWA-RD-97-106, Federal Highway Administration, US Department of Transportation, 1998.
- H. Chen and J. J. Lu, “Evaluating the Impacts of Ramp Configurations and Influential Factors on Freeway Exit Ramps,” ICCTP2009: Critical Issues in Transportation Systems Planning, Development and Management, America Society of Civil Engineers (ASCE), 2009, pp. 895- 905.
- A Policy on Geometric Design of Highways and Streets, American Association of State Highway and Transportation Officials (AASHTO), Washington DC, 2011.
- M. M. Haque, C. H. Chin and H. L. Huang, “Modeling Fault among Motorcyclists Involved in Crashes,” Accident Analysis and Prevention, Vol. 41, No. 2, 2009, pp. 327-335. http://dx.doi.org/10.1016/j.aap.2008.12.010
- M. Hunter, R. Machemehl and A. Tsyganov, “An Operational Evaluation of Freeway Ramp Design,” Transportation Research Board of the National Academies, Vol. 1751, 2001, pp. 90-100.
- H. W. Schneider IV, T. P. Savolainen and N. D. Moore, “Effects of Horizontal Curvature on Single-Vehicle Motorcycle Crash Along Rural Two-Lane Highways,” Transportation Research Record: Journal of the Transportation Research Board, Vol. 2194, Washington DC, 2010, pp. 91-98,
- N. B. Janson, W. Awad and J. Robles, “Truck Accidents at Freeway Ramps: Data Analysis and High-Risk Site Identification” Journal of Transportation and Statistics, Vol. 1, 1998, pp. 75-92.
- A. M. Abdel-Aty and A. E. Radwan, “Modeling Traffic Accident Occurrence and Involvement,” Accident Analysis and Prevention, Vol. 39, 1999, pp. 657-670.
- P. S. Washington, G. M. Karlaftis and L. F. Mannering, “Statistical and Econometric Methods for Transportation Data Analysis,” 2nd Edition, Taylor & Franicis Group, London, 2010.
- M. Hunter, R. Machemehl and A. Tsyganov, “Reevaluation of Ramp Design Speed Criteria: Summary Report,” Center for Transportation Research, The University of Texas at Austin, Texas Department of Transportation Research and Technology Transfer Section/Construction Division, 2000.