Agricultural Sciences
Vol. 4 No. 12 (2013) , Article ID: 41153 , 5 pages DOI:10.4236/as.2013.412093
Application of computer vision technology on raising sow and procreating of processing
![]()
School of Election and Information Engineering, Ningbo University of Technology, Ningbo City, China; yunyoung@163.com
Copyright © 2013 Yun Yang. This is an open access article distributed under the Creative Commons Attribution License, which permits unrestricted use, distribution, and reproduction in any medium, provided the original work is properly cited.
Received 15 August 2013; revised 2 November 2013; accepted 13 November 2013
Keywords: Computer Vision System; Infrared Sensor; Image Processing; Raising Sow
ABSTRACT
This paper expounds the application of machine vision theory, composition and technology in the sow breeding process monitoring, auxiliary judgment, and growth of young monitoring. It also points out the problems and deficiency in the application of machine vision technology, and discusses the development trends and prospects of the machine vision technology in agricultural engineering. The application of machine vision is a process in which dynamic original image from the sows estrus is collected with a CCD camera, and then black and white ash three binarization image in adjournments of the threshold value is made by using image acquisition card, through the median filtering and gray processing. The practitioners can extract respective image information from the sow estrus, pregnancy and birth delivery. Applying the computer vision system in the sow farm effectively enhances the practitioners’ objectivity and precision in their efforts to assess the whole process of sow birth delivery.
1. INTRODUCTION
Computer vision technology is based on visual system, using the image analysis of automatic classification, analysis, and testing. It has been applied in many Industries and investigated for the automatic sensory analysis of an image of a real scene [1]. In order to manage such a system we must simplify it and describe it in terms of a set of measurable values that are known to have the most important effects on production [2]. The aim of this paper is to describe how to accurately characterize the sow production processing and the increased expectation of high and objective standards for accurate assessment. There is a need for high efficiency in the process control, which relies on the performance of the computer vision to generate precise descriptive data.
2. THE PRINCIPLE OF COMPUTER VISION
Computer vision is seen as an easy and quick way to acquire data that would be otherwise difficult to obtain manually. Often due to the unique structure of typical agricultural settings, it is a considerably different purpose for object identification in these applications. Visual system is composed of such five units, as light source, lighting, camera, image acquisition board, computer hardware and software. The proposed lighting control systems were found to be effective in computer-controlled system. To provides consistent with appearance and to improve preprocess in for physical characteristics is the lighting. It results in the reduction of noise interference. So there is no need to focus on the object for avoiding additional interference. Different method is chosen to deal with the object in different lighting [3]. An illumination is usually provided with equipments including halogen lamps, xenon lamp, LED. Particularities of the object determin the kinds lighting to be used, including direct lighting light, scattering light, backlight source, coaxial illumination light sources, and special lighting light source. Scattering illumination light source is more suitable for our research and development of the project than other sources. Scattering illumination light is casted on a rough cover. A diffuse plate which has no direction is used. Soft light is then projected on the tested object. Many techniques are used to optimize the results while a light source is chosen. One key change we had in mind was something called color [4]. Non-luminous body can be divided into two kinds of transparent and opaque body, opacities with the ability of reflection or absorption of different wavelengths of light can not be made visible with absorbing light. The light we see is the reflected light. So the opacities of color are from the “reflected color” that comes from the reflected light. If natural light illuminates the object with color, essential features mainly are black color. When it illuminates the object with other colors, brightness increases in turn. In order to get the maximum brightness, we illuminate the same color of the object. It will have been raised to the image contrast in the appropriate light source color. The advances in the speed of the processing of useful information and eliminating unnecessary data and noise by filters are rapid. The filter technology is a technology which limiting rays enter the camera, where the three filters in the polarizer and wave and block mirror are used. It is similar to the filter for filtering the signal in accordance with certain conditions. The CCD chip [5] is an imaging element. We have obtained a line of object imaging. Each time when the CCD chip has only one line of photosensitive device every time, it is called linear array camera for the line scan. Imaging is overall objects every time. A rectangular array image is resulted from overall object by CCD chips every time. It is based on a scanning type of camera called array camera. Computer vision in detection system has been applied in testing result, displaying image outputting data, issuing instructions [6]. There is increasing evidence that actuators cooperatively can finish position adjustment, selecting quality processing statistical data etc. The biggest advantages of computer vision include accuracy, fast speed, reliability, and digital information compared with artificial vision. The original image of dynamic sow oestrus is collected by the CCD camera through image acquisition card and the median filtering. Becoming black and white ash three binarization images, it can extract respective information on sow oestrus, pregnancy, image of production by the adjustment of the threshold value. Processing of an image can collect information on the sow for the raw data of the database in the background. From raw data of the database in the background with IHS color values, one can get available information to be compared with the classification information In order to determine the information on the sow. The processing of computer vision is as follows: Reb2gray [7] function has been used in gray processing in gray image of sow secretion. In order to adopt medfilt2 two-dimensional median filtering function, filtering the noise. According to gray level histogram statistics from IMHIST function, using Imadjust function can separate production area from the background. The concentration from sow oestrus secretions (determining the best pregnant time) is the use of Bwarea function calculate information. Concentration of discharge rate can be obtained by im2bw function from properly selecting threshold. As a result of the calculation result, the sow discharges concentration and the color is in accord with the requirements of human eyes [8]. It is evident that computer replaces human eyes to control the perfect time to sow pregnancy.
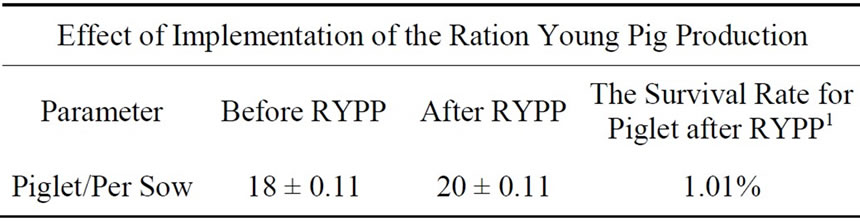
Through sow secretions, the project has resulted in both more favorable sow breeding and the increase of the number of young pigs. The number of piglets born alive was greater than before. Sow ratio and piglets survival rate to those of uncontrolled pigs.
3. THE INFRARED REMOTE SENSING DETECTION SYSTEM
CCD camera with near infrared filter can get spectral image information for detecting the pregnancy of sows, determining a time of labor, and a other information. Infrared sensors is a sensor converted infrared radiation energy in the system that produces the energy of the battery. Infrared radiation (infra-ray) is a kind of light invisible to human eyes [9]. It is some form of wavelength that ranges roughly from 0.76 to 100 microns. Any objects above thermodynamics zero degree in temperature (273.15˚C) can produce infrared radiation [10]. Any object with outward radiation energy and above thermo dynamics zero degree in temperature is called thermal radiation, and known as infrared radiation, or commonly known as infrared light. It is a kind of light invisible to human eyes, In fact, like any other light, this is also a kind of material in the objective world. Infrared light is located on the visible light for outside red light. Its wavelength ranges roughly 0.76 - 100, corresponding to roughly 3 × 10¹¹ - 4 × 10¹⁴ Hz in frequency. Infrared propagation speed is the speed of light in vacuum, c = 3 × 10⁸ m/s. Its attributes is the same as visible light including reflection and refraction, scattering, interference, and absorption. Thermal sensor can successfully estimate temperature change through infrared radiation. Thus, more physical parameters could be made corresponding to changes [11]. For instance, the temperature was measured using sow labor in time. In this method, we can accurately determine a time of sow delivery. Analysis process from Near-infrared was done to measure standard method for accurate determination of the apparent spectrum of samples by biased sampling (if there was a urine test was conducted to determine whether the sow fertility success or not). In this method, information was collected and analysed. The modeling pectrum matrix and the ratio of matrix contain the information. So it is called the modeling data. Signals from the sow and the young pig were captured by two CCD cameras transferred to the PC through the video capture card, digitized, and stored on the PC in RGB (red, green, blue) color space. A program was developed to capture and record the images of excrement. Algorithms were implemented using Visual Basic 6.0 programming language. However, RGB system is sensitive to lighting or other conditions. Another color model is HSI (Hue, Saturation and Intensity). Here we prefer using HIS, as in this system Hue value is comparatively stable. Thus more algorithms could be developed to detect and analyse whether there is parasites or not in the stool. Many researches in this area indicate which young pigs are suitable for swine through the analysis of fluid from waste in the body.
4. IMAGE PROCESSING AND IMAGE ANALYSIS
Computer vision system consists of two main processes [12]: 1) image processing and 2) image analysis. It is a key to image processing and image analysis in the computer vision system. A series of steps is included in the image processing and image analysis. The image processing includes representation, problem description identification and the interpretation of the knowledge base and the result from problem.
Image processing technique developed a machine vision system to eliminate such image defects.as geometric distortion, focusing on the fuzzy, noise repeatedly, shadow, motion capture. The process of identifying objects from the background is captured by the image analysis of the quantitative information. Here we use it in the decision controlsystem. Image analysis is determined by using the following 1) gray-scale image; 2) binary image; 3) the color and multi-spectral image; 4) image sequence analysis; 5) binocular image analysis. A series of algorithm is developed to comprehensively utilize the classification and value.
Firstly, there are three different ways for image segmentation after the image acquisition: 1) a method of the pixel clustering in which each pixel drives into the corresponding object or area, namely area method; 2) the way from integral boundary directly determined through the regional boundary; 3) the detection of the edge pixels. What is more, it is linked so that the edge pixels are used in the segmentation boundary formation. The commonly method of thresholds deals with image segmentation in the processing of image segmentation. Threshold is selected, by tracing edge, splitting image and pre-treating. The image is transformed to black and white binary image. The biggest difference is the different threshold used in the process of image threshold. The spare part will be extracted by larger threshold. And then, the image of the required parts. And then if a smaller threshold value is extracted, the image of the required parts will be losted. (Note: the background is black, when the objects are white). Therefore, it is very important for the selection of threshold. It is necessary for tracking a target edge while the target is in the image recognition, which is also called contour tracking. The edge points are found by orderly tracking the boundary. The image of different pixel values is both binary image and different areas. Here, a smaller image is based on each area of the pixel values matching the same template. Therefore, it becomes models for comparing between the templates. What is from research is whether there is the same as the template or similar region by an identified source image. If the area exists, its location can be determined and the area is extracted.
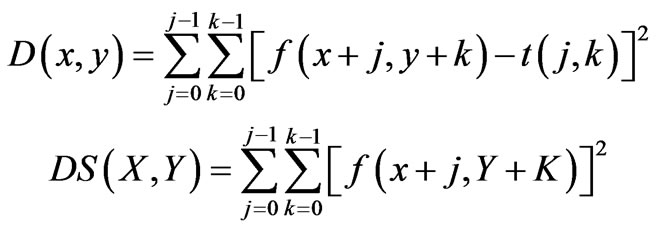
It is often useful to match the template with a kind of measure which is from the image error sum of squares of corresponding area. Hence, F(x, y) is M × N of the original image, t(j, k) is j × k (j, M or less, k, N) template of image. The error sum of squares measure is defined as: (1) [13] expansion then obtain
 (1)
(1)
 (2)
(2)
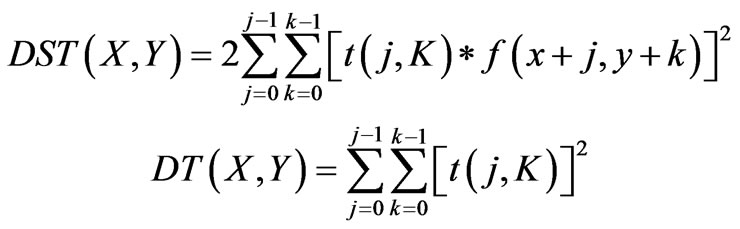
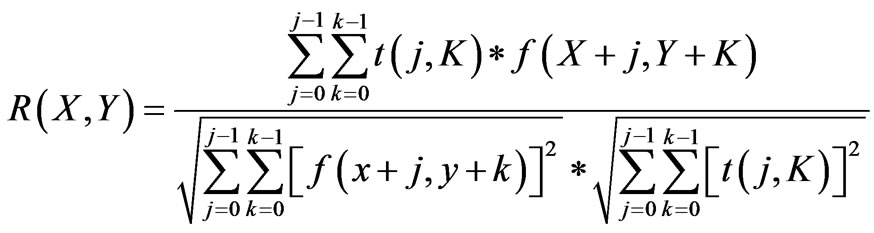
DS(x, y) is called the template from the original image corresponding to the areas of energy It is associated with pixel position (x, y), Once the pixel position (x, y) changes, DS(x, y) will change slowly. The area from the original image associated with DST(x, y) is called template. DS(x, y) changes along with the change of pixel position (x, y). If maximum can be obtained from the template of t(j, k) matching the original image; DT(x, y) is referred to as the energy of the template. DT(x, y) has nothing to do with the image pixel position (x, y) in only one calculation. If the DS(x, y) are constant based on the above analysis, DST(x, y) is used for matching the image. If the maximum value is from DST(x, y),it was found that the template matches the image. The DS(x, y) will not be able to correctly match original image if the DS(x, y) for the constant produce more error. So Normalization normalized cross-correlation can be the error sum of the squares of the measure. It is defined as
 (3)
(3)
Obviously, the amount of calculation will reduce error sum of squares and measure with Type (3). Figure 1 presents the schematic of template matching, which assumes that the original image f(x, y) and t(k, l) is the origin of the template image in the upper left corner. Based on the Type (2) we can calculate a value R(x, y) for any one of (x, y) from f(x, y). With x and y changes, it can obtain from R(x, y) all values that t(j, k) is moved in the original image area. The best position that R(x, y) matches. t(j, k) is indicated as the maximum of R(x, y). The position were extracted from the size of an original image that is the same as the template in order to match features [13].
The main limitation of the matching is that it can only move parallelly. If the rotation or size of the object is changed with the matching image, the algorithm will be invalid. In addition, the parts of images can only be observed from the match the object, the algorithm cannot complete the matching. An important feature is that color is the description of image content. In order to get better color space, it is better to retrieve H, S, I color space, by means of statistical histogram of the image characteristics, and to use the threshold on image segmentation with histogram for all the matching and texture segmentation, and the statistical texture feature. Surface fitting can extract the interested objects or the range, size, and the shape of the object to estimate parameters from an image. Surface fitting can estimate some other factors (e.g. the background shadow) in order to remove bad effects. It would be possible that the two image contents were completely different when histogram lost location information of color but their histograms were similar. It is easy to cause false identification if simple color histogram is used for matching. A similar approach has been proposed by B. S. Hahraray: Video frame or image segmentation into sub-block was carried out to block the matching. A nonlinear statistical algorithm can be used for the comprehensive evaluation on the results of all sub block matching. Histogram of each block by the characteristics of the color location was reflected to some extent since the sub-block was located at the position. The sub-block was divided and matched method can accommodate to the object motion, camera movement, zoom, etc on. There are three problems that need to be considered when using shape matching: First of all, the shape with the target is often related to the color. The feature of the image shape is of a higher level. We often partition image in order to obtain the goal of the shape parameter. The shape characteristics will be affected by the image segmentation effect. Secondly, it is a very complicated thing to do to describe the shape of a target. Thus, a precise mathematical definition hasn’t been found for the image of the shape. Finally, direct difference operation test can be used to observe the law of pig’s life. One of the most effective ways is to build computer vision sys-
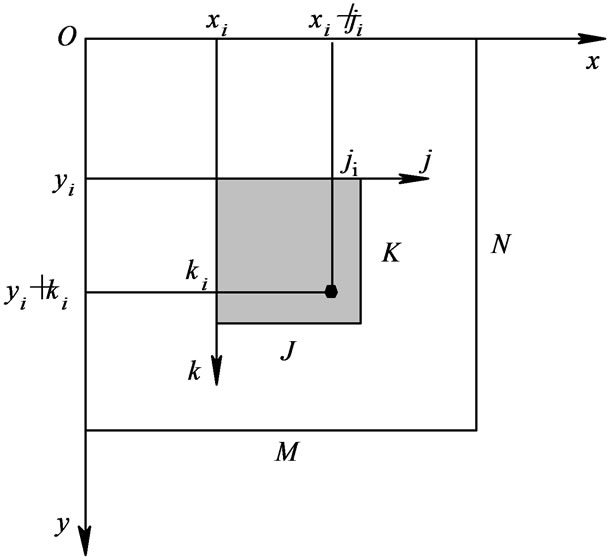
Figure 1. Diagram is to match with the template.
tem for different operation test with threshold processing. The best image threshold segmentation algorithm was determined by vc++ programming to realize the image [14]. vc++ programming can also achieve addition and subtraction [15]. Here, we do not need to deal with too many images processing in our application of vision.
5. CONCLUSION
Computer vision has been applied to various industries. The paper first reviews the progress of computer vision in raising pigs, and then explores the areas of research with a wider scope to enhance the existing problems to meet today’s challenges. At present, the sow production, estrus, breast-feeding, and statistical data are almost blank in a computer database. Computer vision is a computerized imaging technology to establish all production statistics, in order to facilitate work or compare the collected history data. A new standard for assessment data of high reliability will be set for establishing comprehensive control of sow production and quality. Computer vision systems have been used increasingly in breeding and agricultural areas for quality inspection and evaluation purposes, because they provide rapid, economic, consistent, and objective assessments [16]. With the accumulation of the professional experience in breeding industry, the configuration of the computer vision will be improved. And the efficiency and competence of pig industry will be enhanced. Computer vision is more than something feasible only in theory. It can replace human eyes in function and can even be fully implemented into the area where human eyes can’t reach [10]. With the continuous development of its related technology, the accumulation of experience in its application, machine vision will play a bigger role in the various fields of national economy.
REFERENCES
- Gao, H. and Wang, Y.Q. (2004) Study on the shape classification of farm produce based on computer vision. Computer engineering and Applications, 227-229.
- He, D.J., Yang, Q., Xue, S.P. and Geng, N. (1998) Computer vision for sorting of fresh fruits. Transactions of CSAE (The Chinese Society of Agricultural Engineering), 14, 202-205
- Liu, Z.T. (2011) Sensor principles and application. Xi’an Electronic and Science University Press, Xi’an.
- Fang, C.Y. and Xie, L.H. (2008) Study on identification of rice varieties using computer vision. Food Science, Beijing.
- (Canada) Parker (Translated by Jing Li) (2012) Algorithms for image processing and computer vision. 2nd Edition, Tsinghua University Press, Beijing.
- Guo, C.L. (2009) Fundament of digital signal obtaining and information processing. Tsinghua University Press, Beijing.
- Ma, Y.Z., Tao, L.Y. and Wang, X.H. (2006) Application of computer vision technology. The Technology and Testing Machine, 61-65.
- Patel, K.K., Kar, A., Jha, S.N. and Khan, M.A. (2012) Machine vision system: A tool for quality inspection of food and agricultural products. Journal of Food Science and Technology, 49, 123-141.
- Raji A.O. and Alamutu, A.O. (2005) Prospects of computer vision automated sorting systems in agricultural process operations in Nigeria. Invited Overview.
- Zazueta, F.S., Bucklin, R. and Jones, P.H. Basic concepts in environmental computer control of agricultural systems.
- Khojastenazh, M., Omidand, M. and Tabatabaee-far A. (2010) Development of lemon sorting system based on color and size. African Journal Plant Science, 4, 122-127.
- Dong, Y.W. and Ji, B.P. (2007) CCD-NIR analysis of acidity and sugar content in apples. Food Science, 28.
- Zhang, Y.J. (2011) A course of computer vision. People’s Posts and Telecommunications Press.
- Narendra, V.G. and Hareesh Sr., K.S. (2010) Lecturer, quality inspection and grading of agricultural and food products by computer vision—A review. International Journal of Computer Applications, 2.
- Johnson, L.F., Herwitz, S., Dunagan, S., Lobitz, B., Sullivan, D. and Slye, R. (2003) Collection of ultra high spatial and spectral resolution image data over California Vineyards with a small UAV. Proceedings of the Int’l Symposium on Remote Sensing of Environment. Earth Science Division, NASA Ames Research Center 242-4, Moffett Field.
- Adewumi, B.A. (2012) Transformation of field to food materials: Agro-food process engineering approach. Funaab Inaugural Lecture Series No. 36.
NOTES
1Ration Young Pig Production.