International Journal of Geosciences
Vol. 4 No. 8 (2013) , Article ID: 38636 , 13 pages DOI:10.4236/ijg.2013.48115
Geoelectric Structure of the Crust along the Mbere Trough (South Adamawa) from Audio-Magnetotelluric Data
1National Institute of cartography, Yaounde, Cameroon
2Department of Physics, Faculty of Science, University of Yaounde I, Yaounde, Cameroon
Email: *lkande2001@yahoo.fr
Copyright © 2013 Ludovic Houetchak Kande et al. This is an open access article distributed under the Creative Commons Attribution License, which permits unrestricted use, distribution, and reproduction in any medium, provided the original work is properly cited.
Received August 6, 2013; revised September 7, 2013; accepted September 28, 2013
Keywords: Adamawa; trough; fault; resistivity; pseudo-section; geoelectric section
ABSTRACT
The South Adamawa trough represents a major structure associated to the tectonic activity in the Adamawa region. The Mbere and the Djerem troughs represent the eastern and the western parts of the South Adamawa trough respectively. The audio-magnetotelluric (AMT) method is used to study the Mbere trough and to bring out tectonic features that affect the basement of this region during the Cretaceous. From analysis and interpretation of AMT data, based on pseudo-section and geoelectric section, two geologic models are constructed across the trough at Belel and Nyambaka. Those models bring more information on the sediments thickness and the borders faults of the trough compared to previous studies. The results shows that the Mbere trough is dissymmetric, and bounded on its northern side by an intra-gneissic fault and on its southern side by two faults with at least one considered as a faulted contact between the granitic and gneissic rocks. The sediments filling of the trough are consist mainly of conglomerates on which lay sandstones. The thickness of these sediments is about 2060 m at Belel and decreases to about 1800 m at Nyambaka, with a low sandstones thickness, which does not exceed 360 m. The basement consists of granite in the South of the trough and gneiss in the North, with resistivity more than 10,000 Ω.m. The Moho is located between 25 and 35 km in the South Adamawa region.
1. Introduction
The Adamawa plateau represents a post-Cretaceous uplifted and elongated zone which trends SW-NE in Central Africa. The plateau is bounded in the NW by the Benoue trough and in the south by the South-Adamawa trough. It consisted of Mbere and Djerem basins which are separated by a volcanic outflow (Figure 1). These basins are bounded on their sides by faults trending ENE and WSW and are associated with the Central Cameroonian Shear Zone (CCSZ).
Many geological and geophysical studies have been carried out in the Adamawa plateau, in order to determine the origin, the extension and the age of this uplift. Geophysical studies include gravimetric, seismic and magnetic methods. These studies, which have been carried within a regional framework, are extended on several hundred kilometers and bring out structures located beyond the crust. Concerning the crust, the gravity method is mainly used. This single method presents some insufficiencies for the local studies and the case of the Mbere trough. In order to improve those previous results by bringing more details on the structure of the Mbere trough, we used the AMT method in our study.
2. Geological and Tectonic Setting
The Mbere trough is located on the south of the Adamawa plateau in Cameroon between latitudes 6˚30' and 7˚30'N and between longitudes 14˚ and 15˚E. The trough which is about 100 km long and 10 to 20 km wide is bounded by faults. It disappears under the basaltic outflows of Adamawa (Figure 2). The volcanic rocks are related to those of the Cameroon Volcanic Line (CVL) and are made up of extensive basaltic outflows in the Adamawa plateau and Mbere trough overlying the sediments and granitic basement [3,4]. The outflows are post-Cretaceous and have followed the tectonic setting of that period. The deepest basaltic rocks are located along
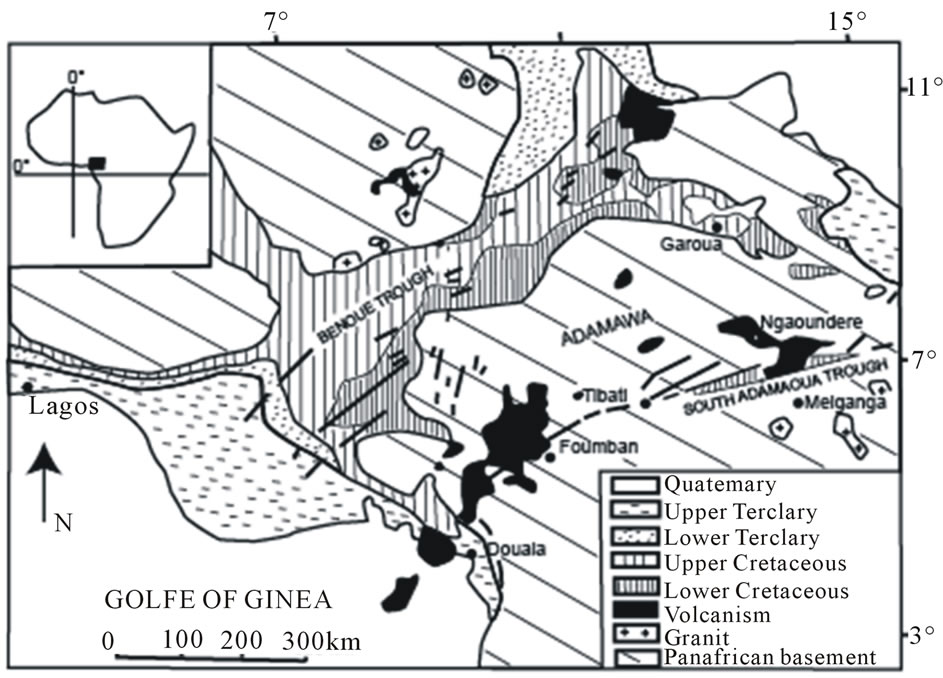
Figure 1. Geological setting of Adamawa and the neighboring troughs, modified from [1].
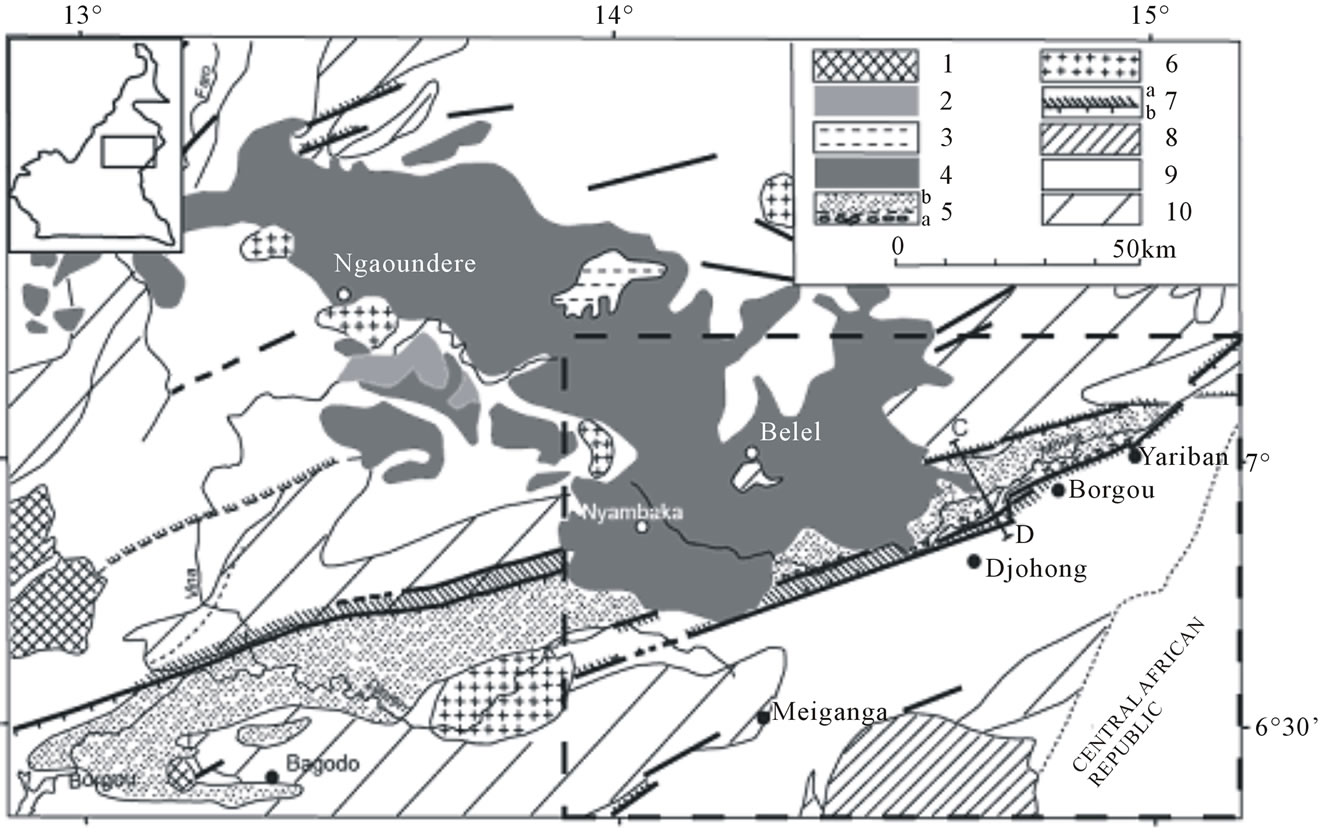
Figure 2. Geological setting of Adamawa Plateau, from Lassere (1961) and Le Marechal and Vincent (1971). 1. Lateric crust; 2. Basalt of upper units; 3. Trachytes trachy-andesites and rhyolites of middle unit; 4. Basalts of the lower units; 5. Sedimentary formations of the South Adamawa trough: (a) metamorphic conglomerates, (b) conglomerates and arkoses; 6. Late Panafrican granites; 7 Faults: (a) with considerable morphologic epaulment, (b) with mylonites; 8. Epimetamorphic schists (Lom unit); 9. Sysntectonics (Panafrican) granite; 10. Migmatites and gneiss (the study zone is framed).
the trough. Their mean depth in the Tibati region in the SW of the Adamawa is 5.5 km [5]. The sediments are made up of polygenic conglomerates and arkosic sandstones [6] (Figure 3). The thickness of the sediments is estimated to lie between 1500 and 2500 m at Djohong [7] and between 1600 and 2000 m using geophysical data [8]. The basement is made up of plutonic and metamorphic Precambrian rocks. They are mainly gneiss, amphiboles, migmatites and granite which outcrop on the edge of the plateau.
The tectonic evolution of the region is characterised by a transformation through metamorphism, at the end of the upper Proterozoic, of plutonic and metamorphic basement rocks into granite and migmatite [6]. The postPanafrican evolution is characterised by a mylonitisation of rocks of a few kilometres wide and extending from the
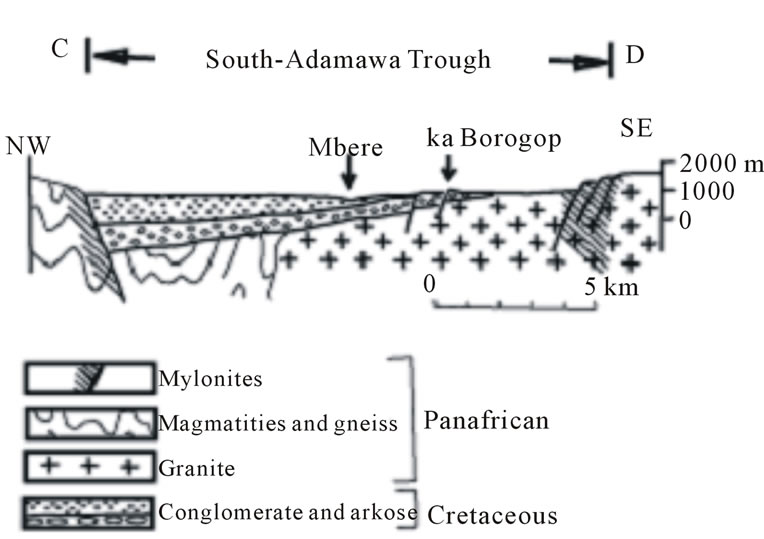
Figure 3. Schematic geological section of the South-Admawa trough as located on Figure 1 from [2,3].
Atlantic coast to the south west to beyond the Adamawa in the north east. The phenomenon is related to a compressive episode in the E-W direction and by a dextral fracture in the N70˚E direction, which coincides with the orientation of the Mbere trough. The fault zone is part of Central African Shear Zone (CASZ) that extends some 2000 km from Cameroon to Sudan [9].
3. Geophysical Setting
Many geophysical studies have been carried out in the whole of the Adamawa.
Seismic refraction studies by [10] and [11] situated the upper and lower crustal limit between 10 and 14 km under the Adamawa region. The seismicity study of the Cameroon volcanic provinces [12] showed two zones of evident seismicity in the region. One of them is related to the Foumban fault, which cuts through the Adamawa province and the other to the northern border of the Congo Craton. Some low magnitude earthquakes were registered between 1983 and 1987, with the epicentres along the fault [13]. Some of the earthquakes occurred at depths greater than 30 km.
The study of profiles of total magnetic field in the Mbere trough by [8] showed magnetic contrasts, which he associated with the effect of the presence of basic rocks in the northern part. The magnetic anomaly map of Africa obtained from the satellite MAGSAT [14] showed that the Adamawa region is characterised by extended longitudinal anomalies trending ENE-WSW to E-W with a magnitude of 2 nT. The anomalies are greater at low altitudes, suggesting that they might have a deeper origin [11,15,16] suggested that these anomalies originated in the lithosphere.
Aeromagnetic data have been used to study the Foumban fault, which traverses the Adamawa region [17]. The principal directions registered by the aeromagnetic study showed that the region might be made of rocks with different magnetic susceptibilities. This study brought out the N30˚E direction which is same as the interpretation from satellite pictures [18].
The gravity studies by [19] revealed that the Adamawa region is characterized by a long wavelength negative Bouguer anomaly of about −120 mgals and about 200 km wide. [20] from the isostatic studies showed that the topographic loads under the Adamawa region are in compensation for wavelengths more than 100 km. The gravity study in the Adamawa region [21] showed that the long wavelengths are due to the lithospheric thinning related to the asthenospheric ascent. Recent studies [22] in the Adamawa region showed that the large fracture oriented N70˚E that affected the basement is located in the lithosphere. The basement is intruded with volcanic rocks located at 8 km mean depth with a minimum depth of 5.5 km under the Tibati region in the SW of Adamawa.
4. Data Acquisition and Processing
Data used in this study were collected in November 2005 during a survey by the Geophysics Laboratory of the University of Yaoundé I, using a scalar resistimeter ECA 542 O [23]. These data are resistivities values for frequencies 4.1 Hz; 7.3 Hz; 13 Hz; 23 Hz; 41 Hz; 73 Hz; 130 Hz; 230 Hz; 410 Hz; 730 Hz; 1300 Hz and 2300 Hz along two profiles A and B trends NNW-SSE (almost perpendicular to the direction of the trough). Each profile, consist of seven stations that were noted A1 to A7 for the profile A and of B1 to B7 for the B profile (Figure 4). Profiles have been chosen according to the major tectonic accident direction in the region (N70˚E) given by the residual gravity map, which is also the major direction of the Adamawa regional structure [24]. This direction was used as Transverse Electric (TE) mode direction. The Transverse Magnetic (TM) has been deducted (N160˚E). The mean distance between stations is 6 km for the profile A and 8 km for the B.
Apparent resistivity curves (Figure 5) were processed using the 1D inversion software SONDMT [25] and enable to obtain the thickness and resistivity of the 1D model with a precision of 3% at each station. Geoelectric sections of each profile were constructed using previous models.
5. Data Analysis
The data were analyzed through pseudo-section, which represent the variation of the resistivities versus the pseudo-depth and the distance from the stations along the profile. The pseudo-section enables to show zones of discontinuity or side anomaly, which appear with a strong gradient of resistivity.
5.1. Profile A
Pseudo-sections of this profile are represented on Figure 6
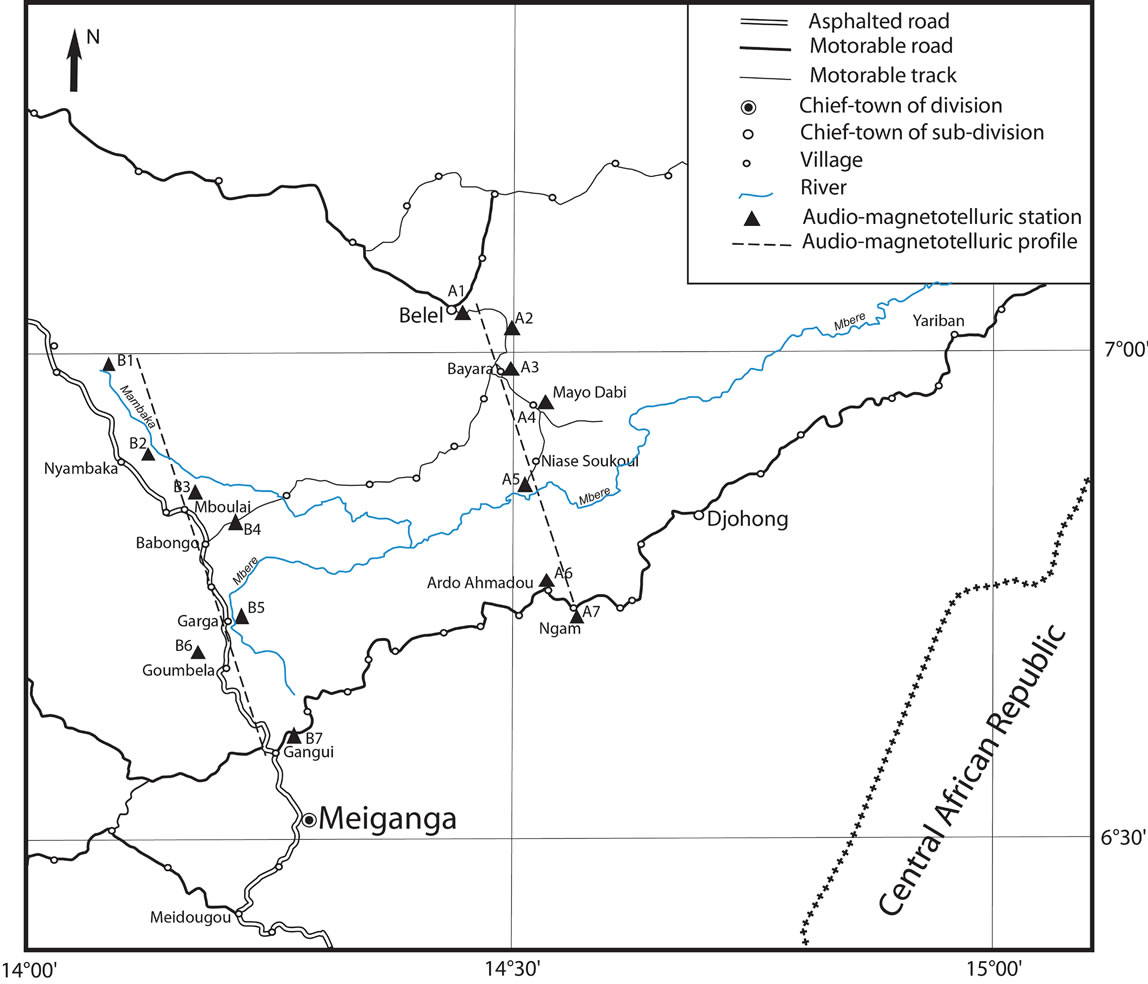
Figure 4. Map of audio-magnetotelluric stations and profiles.
• TE Mode
For the low depths, at the northern part of the profile, there is a zone of discontinuity (D) at the station A3. At the average depths (35 - 40 km), between the stations A4 and A5 there is a resistant block in the form of intrusion (I) in a less resistant structure, which seems to overcome the great depths. This intrusion would be closely related to the zones of discontinuities.
• TM Mode
The discontinuity of North at the station A3 remains always visible. However, there is a second discontinuity, which is less important at the South. The gradient of the resistivities falls gradually from North towards the South at the station A5. This gradient shows that the structures of the South would be different from those of North for the low depths.
The presence of the resistant block in the form of intrusion is less visible than preceding mode.
5.2. Profile B
Pseudo-sections of this profile are represented on Figure 7.
• TE Mode
For the low depths, there are two zones of discontinuities, one at the station B5, and the other at the station B3, less important. The first station (B1) would be a zone of discontinuity. However, the fall of the values of the resistivity at this station would be rather a signature of the river to which it is close, instead of a geological discontinuity as fault or contact. This pseudo-section is also characterized for average pseudo-depths (20 - 45 km) as for profile A, by a resistant block in the form of intrusion between the stations B1 and B3, which seems to overcome the great depths. This intrusion would be a prolongation of those observed on profile A.
• TM Mode
The zones of discontinuity observed on the preceding mode at the stations B3 and B5, do not coincide with those of this mode, because of the strong anisotropies of these zones. At the South, there is an important difference in orientation of the gradient of the iso-resistivities compared to the preceding mode. This orientation materializes a significant difference of the electric properties of the structures on the two modes between the North and the South.
6. Interpretation of Results
The data were interpreted in geoelectric section starting from the model of the layers obtained by 1D inversion during the data processing. The zone of study is characterized by a decreasing of conductivity with the depth for the two modes, except for the deepest. The zones of
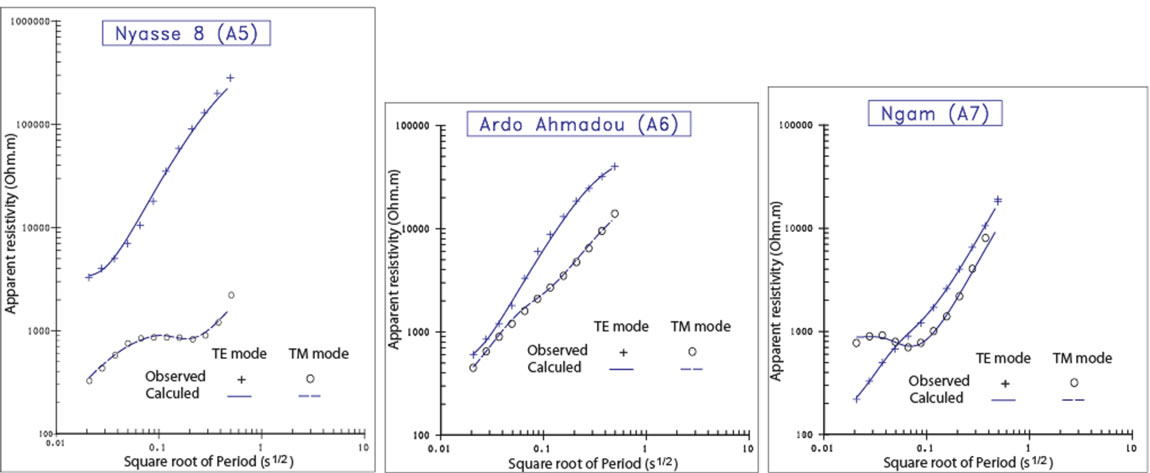 (a)
(a)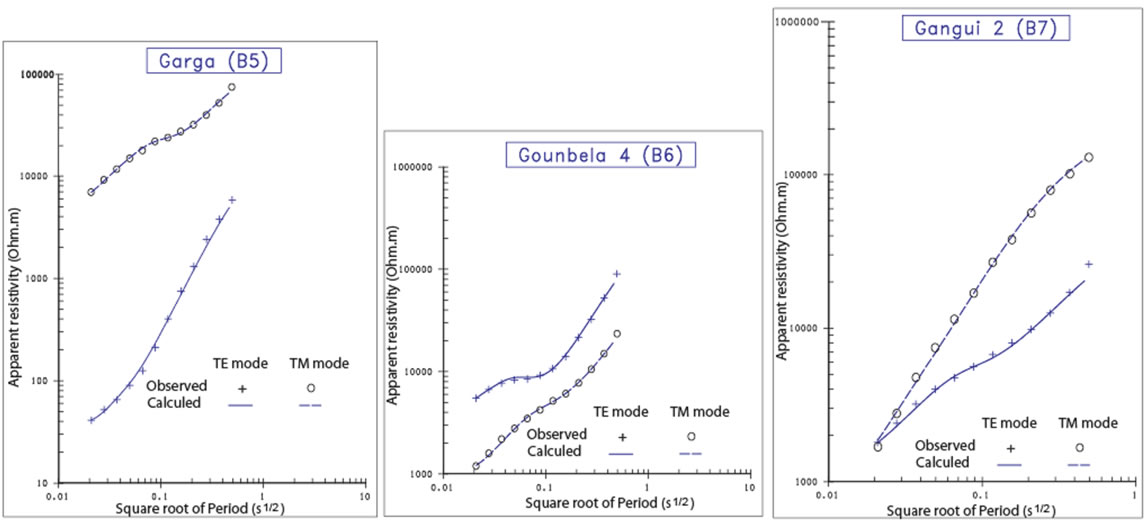 (b)
(b)
Figure 5. (a) Resistivity curves of the stations and their 1D interpretation for profile A; (b) Resistivity curves of the stations and their 1D interpretation for profile B.
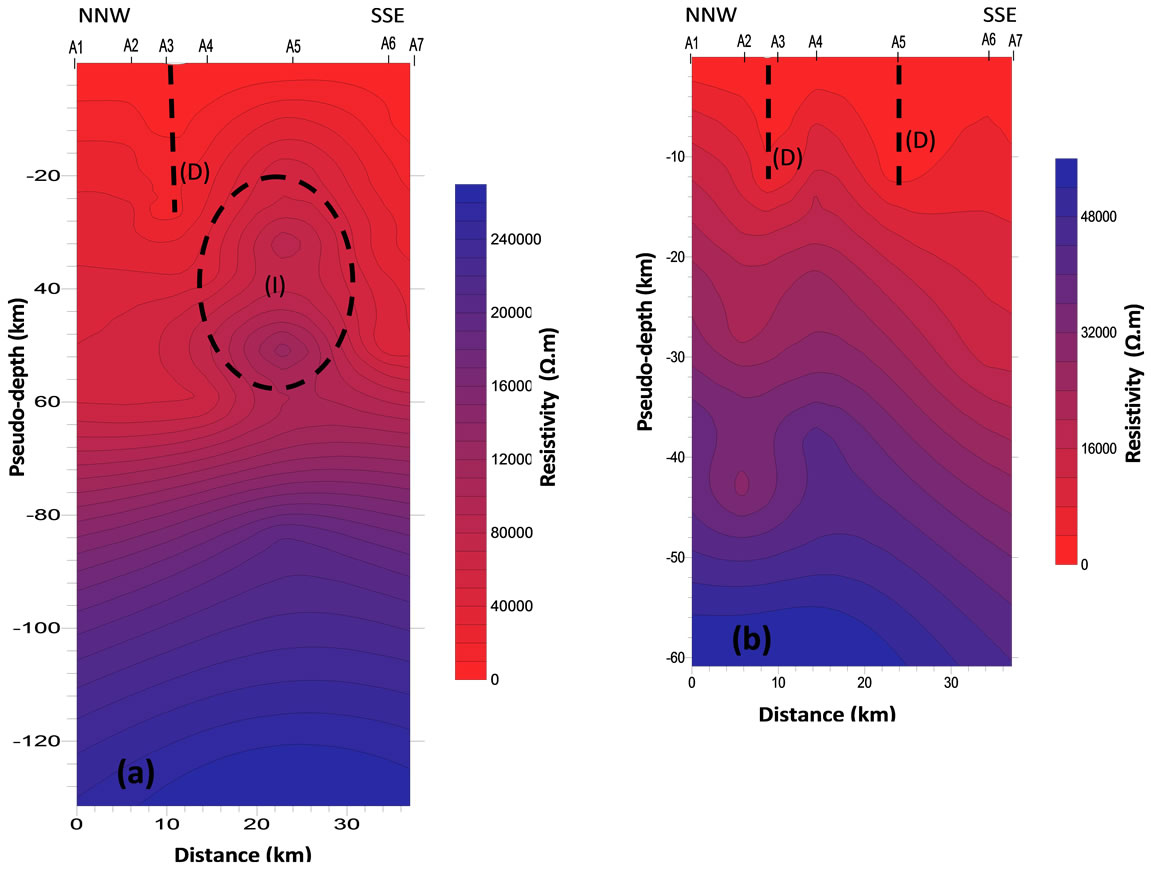
Figure 6. Pseudo-sections of profile A: (a) TE mode; (b) TM mode. (D) Zone of discontinuity, (I) Zone of Intrusion.
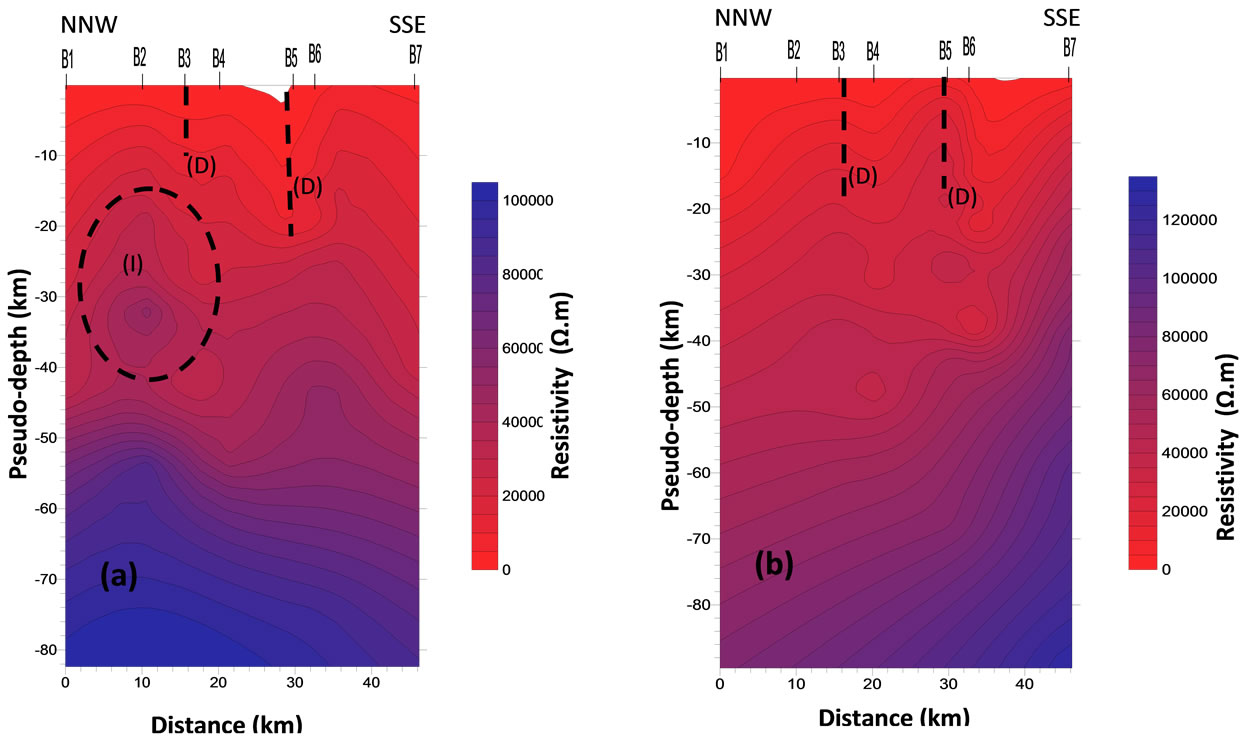
Figure 7. Pseudo-sections of profile B: (a) TE mode; (b) TM mode. (D) Zone of discontinuity, (I) Zone of intrusion.
discontinuity are very conducting and limit the depths of investigation to the stations concerned (skin effect).
6.1. Geoelectric Sections of Profile A
Along this profile, the resistivities increase generally with the depths up to about 30 km depth, except at the station A7. The zones of discontinuity are characterized by low values of resistivity compared to those of the close stations.
• TE Mode
On this mode, there are four main structures (Figure 8). The first structure consists of layers having a resistivity lower than 1000 Ω.m and a thickness lower than 360 m. The second structure consist of layers having a resistivity ranging between 1000 and 10,000 Ω.m and a thickness lower than 1700 m. The layers with the resistivity higher than 10,000 Ω.m and thickness lower than 32 km constitute the third structure. The fourth structure is
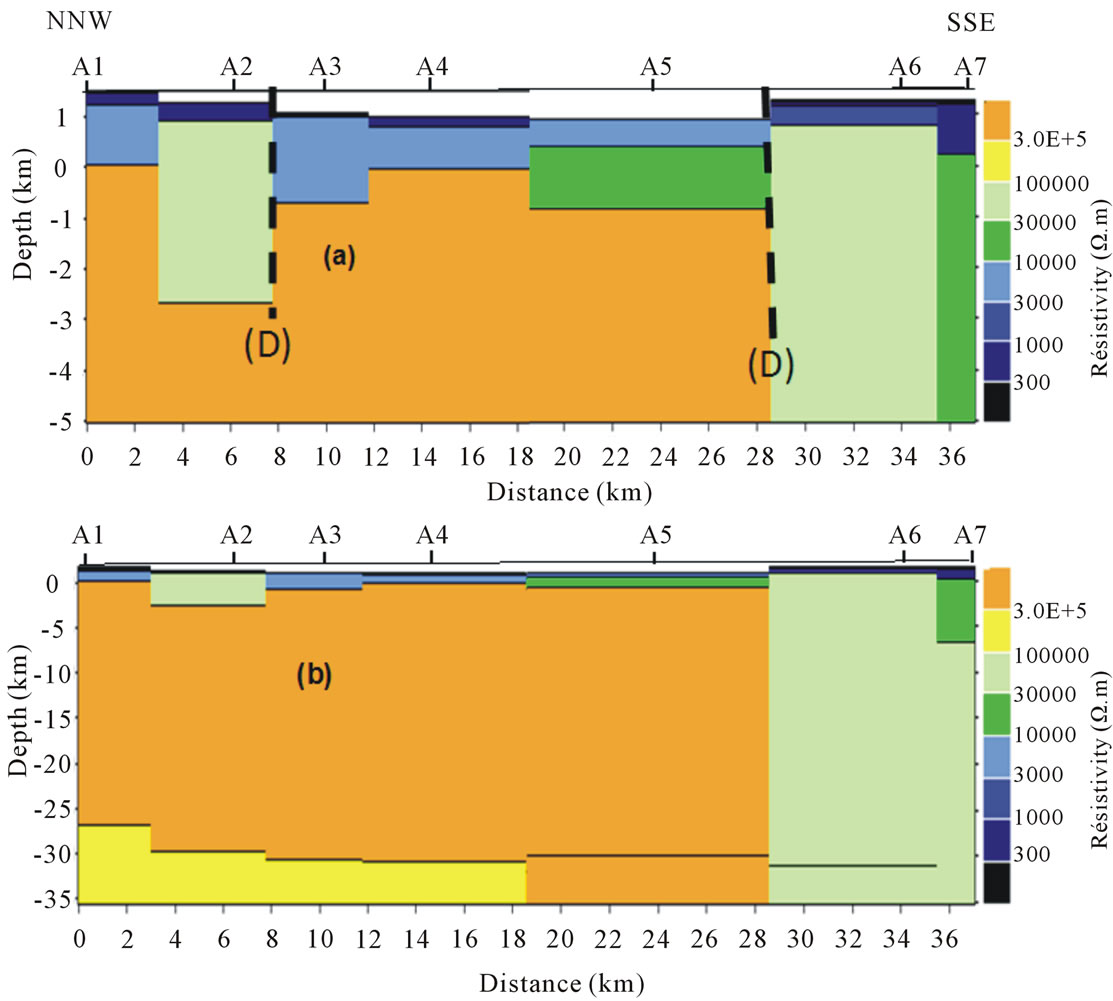
Figure 8. Geoelectric section of du profile A, TE mode: (a) Low depths; (b) High depths.
in-depth below the preceding and with a resistivity ranging between 100,000 and 300,000 Ω.m. This last structure is not reached at the stations A5, A6 and A7 because the conducting layers are located at low depths.
• TM Mode
This mode brings more information on the zones of discontinuities than on the contact between layers (Figure 9), with the exception of the zones of discontinuity and station A6, where we have the same structure as those of the preceding mode, with different thicknesses. Stations A3 and A5, correspond to the zones of discontinuities and are characterized by very conducting structure. The layers of the station A3 is in a very resistant zone (resistivity higher than 100,000 Ω.m), while the layers at the station A5 seems to correspond to a zone of transition between the less resistant structure to the South and the resistant structure at the North. The station A5 is not very far from the Mbere River whose bed follows the southern bordering fault of the trough (Figure 4).
6.2. Geoelectric Sections of the Profile B
On this profile, the resistivities also increase with the depth up to about 30 km depth except at the station B1. The stations B3 and B5, corresponding to the zones of discontinuity are conducting for the low depths. These zones are more visible on the mode TM.
• TE Mode
On this mode, there are five main structures except at the station B5 for which the layers at low depths are very conducting (Figure 10). The first structure consists of layers having a resistivity lower than 1000 Ω.m and a maximum thickness of 300. The second structure consists of layers having a resistivity ranging between 1000 and 10,000 Ω.m with a maximum thickness of 1500 m. The third structure consist of the second layers of the stations B6 and B7 with a resistivity ranging between 10,000 and 30,000 Ω.m and a maximum thickness of 6400 m. The fourth structure consist of most resistant layers (higher than 300,000 Ω.m) having a maximum thickness of 31 km. This structure is deeply bounded by a contact with the fifth structure, less resistant with resistivity lower than 300,000 Ω.m.
• TM Mode
The structures are almost the same as on the previous mode with a difference on the layers’ thicknesses (Figure 11). This difference is more important at the stations B1 and B5. The low depth layers of the station B1 are very conducting and the deepest layers are not reached. This important conductivity would be related to the proximity of this station to the Mambaka River. The conductivity of the layers from low depths in B5 show the transition between the third structure less resistant at the South and the fourth resistant structure at the North, for
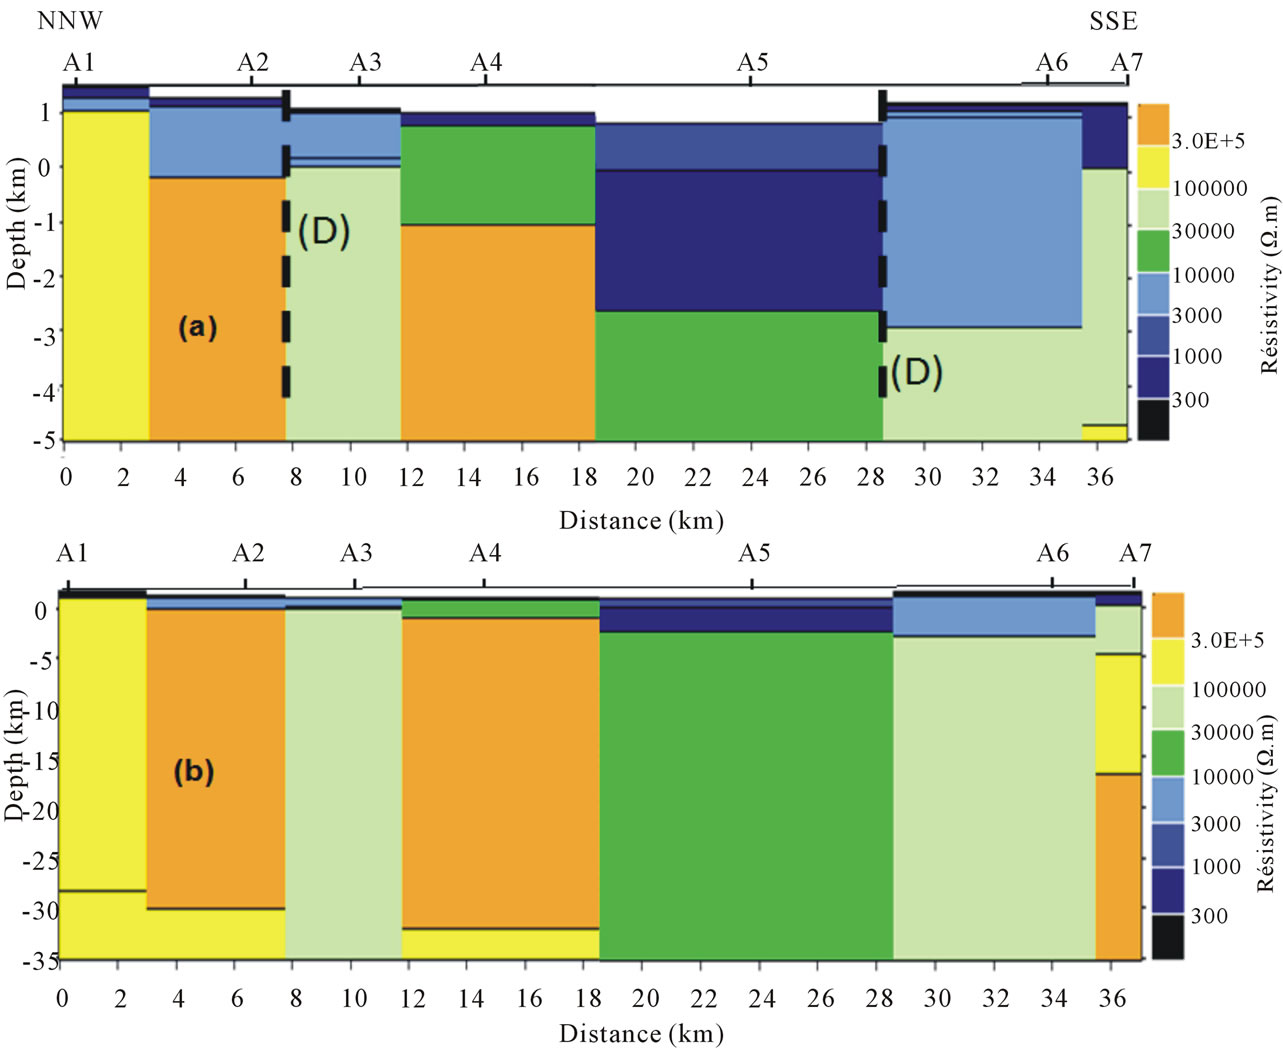
Figure 9. Geoelectric section of du profile A, TM mode: (a) Low depths; (b) High depths.
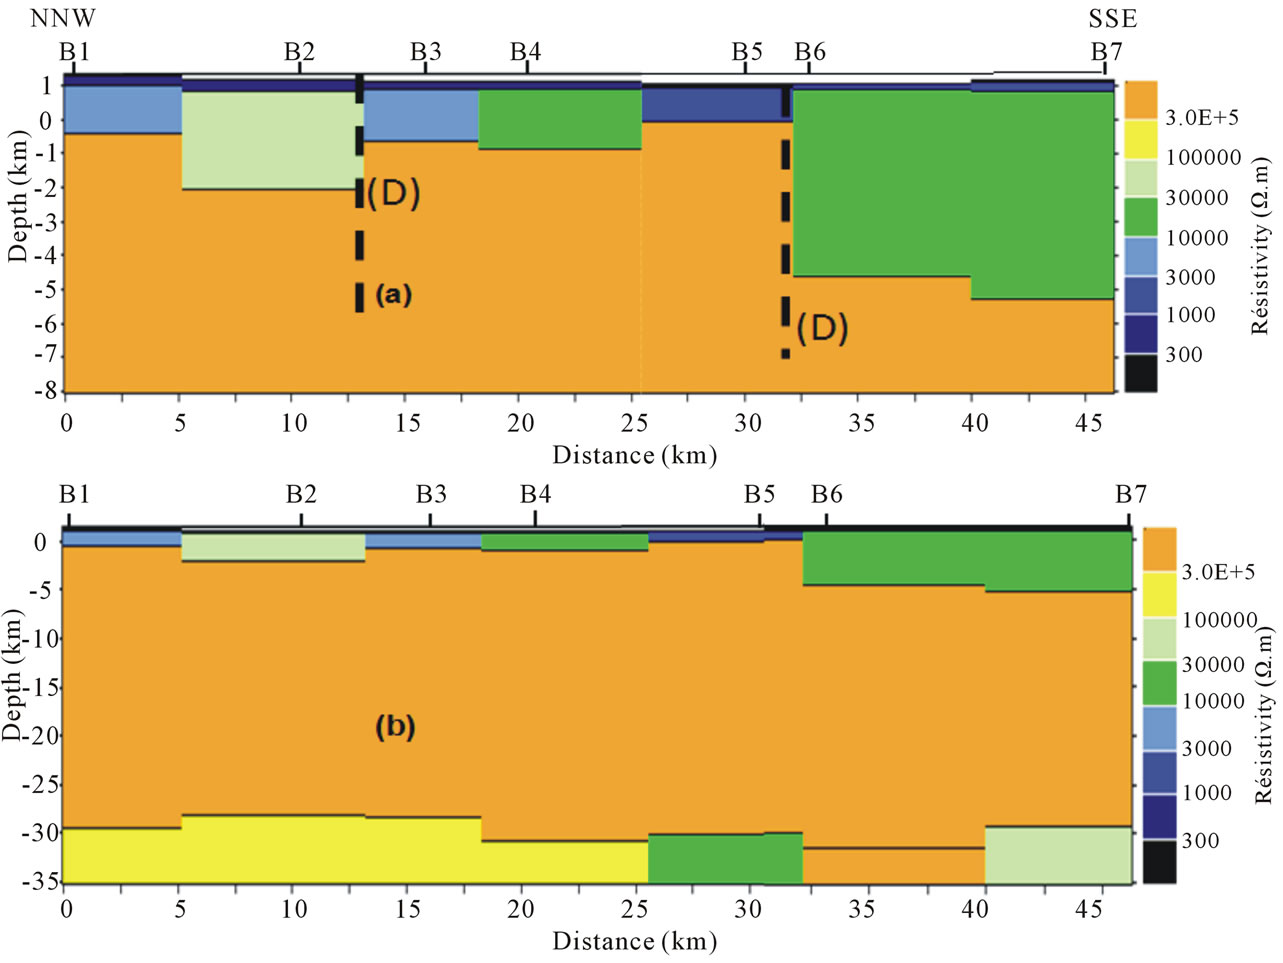
Figure 10. Geoelectric section of du profile B, TE mode: (a) Low depths; (b) High depths.
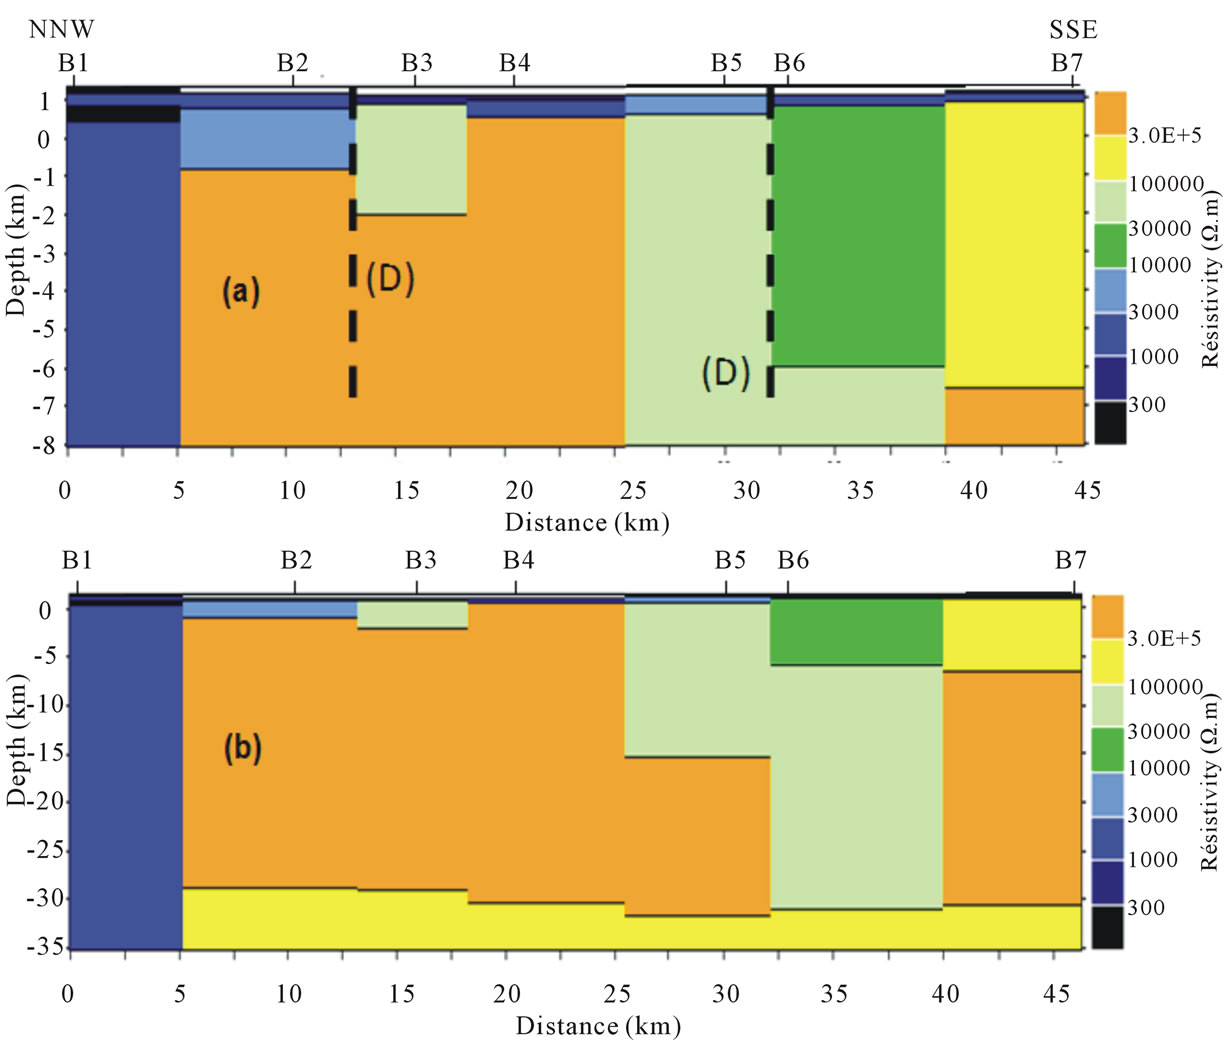
Figure 11. Geoelectric section of du profile B, TM mode: (a) Low depths; (b) High depths.
depths lower than 7 km. This third structure is more resistant to B7 compared to the previous mode. The station B3 is a zone of discontinuity less important than the one of station B5 according to the difference in layers thickness for resistivity ranging between 30,000 and 100,000 Ω.m of these zones.
In summary, the geoelectric sections of profile A show a model with four crustal structure characterized by resistivities that increase with the depth up to the third structure. The fourth structure is less resistant than the third and contact between those structures seems to correspond to a zone of discontinuity of the Lithosphere. The layers of the discontinuity zones at stations A3 and A5 are more conducting than the layers closer to those stations. The first discontinuity zone is internal to the structure and the second materializes a contact between the structure resistant to North and another least resistant to the South.
The geoelectric sections of profile B show a model with five crustal structure generally characterized by the increase of the resistivity with the depth up to the fourth. The fifth structure has almost the same characteristics on this geoelectric section as those of the fourth of profile A. For low depths (lower than 7 km), the layers of structures at discontinuity zones of the stations B3 and B5 are more conducting than the layers of structures of the close stations. The zone of major discontinuity of the station B5 materializes a zone of transition between a structure less resistant at the South and resistant at the North, for depths lower than 7 km. The zone of discontinuity of the station B3 is internal to a resistant structure. This discontinuity is less important as was observed on pseudo-section.
The zones of discontinuity are located near the fault that bounded the Mbere trough. These faults are materializing by zones of conductivities on the geoelectric sections. The first two structures of these geoelectric sections (respectively of lower resistivities 1000 Ω.m and ranging between 1000 and 10,000 Ω.m, for a total thickness lower than 2060 m), located between the two zones of discontinuities of each profile, might represent the sedimentary rocks of the trough (Table 1). The structure located at mean and low depths, of resistivity higher than 10,000 Ω.m might represent basement rocks, consisted of granites and gneiss, which outcrops are observed in the zone of study. The structure located at a great depth, of resistivity higher than 300,000 Ω.m, presents an important difference compared to the overlying ground. According to the geothermic data of the structure of the Earth, and the study of the resistivity of minerals of the Mantle, the resistivity of the Mantle is higher than the resistivity of crust. Consequently, this contact, located
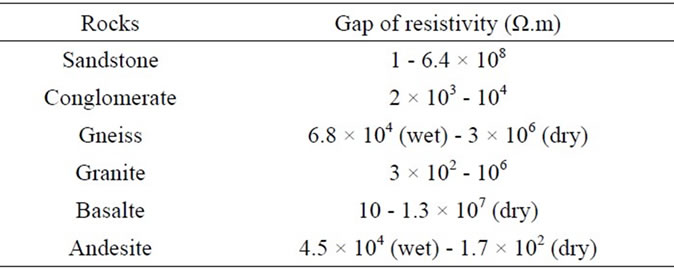
Table 1. Resistivity of rocks of the study area [26].
between 25 and 35 km depth, might correspond to the Moho in the study area.
6.3. Geologic Model of the Crust along the Mbere Trough
To illustrate the structural synthesis made previously according the results of our study and some geological data, we proposed two models for structure of the crust for lower depths (lower than 10 km) through the Mbere trough (Figures 12 and 13).
7. Discussion
From data analysis and the interpretation of the results, we have the following structural synthesis for profile A and B respectively:
At Belel, the Mbere trough has a dissymmetrical form of about 15 km large and the sediment thickness of about 2010 m (Figure 12). The sedimentary filling of the trough consist of arkosic sandstone with a thickness of about 360 m, and of conglomerates with a thickness of about 1700 m. The basement is made of granite and gneiss located mainly at the south and the north of the trough respectively. The trough is bounded on the north by an intra-gneissic normal fault and in the south by two faults; One is a faulted contact between gneiss and granite, and the other is an intra-granitic suspected fault located at 3 km in the south of the previous fault according to the geological data.
At Nyambaka, the Mbere trough also has a dissymmetrical form, approximately 18 km large and the sediment thickness of about 1800 m (Figure 13). The sedimentary filling of the trough consist of arkosic sandstone with a thickness of about 300 m, and conglomerate with a thickness of about 1500 m. The basement is made of granites and gneiss, and the trough is bounded by faults as on the profile A. The fault in the northern part of the trough at Belel is not prolonged at Nyambaka with the same geoelectric properties. This fault is less important as compared to Nyambaka. The southern border of the trough is characterized by two faulted contacts, one of which is founded between the gneisses and the granites, and the other between those granites and gneisses of Meiganga in the South.
The dissymmetry of the trough has been shown by many authors [3,8,9] using gravity method. However, these results did not show precise detail on the sedimentary filling and did not clearly characterize the border faults of the trough. Our study show more detail on these aspects. The Mbere trough and its border faults are some of the major tectonic structures associated with the Adamawa plateau. The major fault of the northern edge of the trough compared to those of the southern edge, shows that the northern edge would have constituted a zone of weakness having undergone intensely tectonic activities in the era between the Precambrian and the Cretaceous. These tectonic activities is a compressive post-Panafrican period trend E-W, which results in the mylonitisation of the zones of weaknesses and which extends from the Atlantic coast to beyond Adamawa [6]. This period is marked by setback N70˚E, corresponding to the direction of the trough. During the Cretaceous period, the zones of weaknesses (mylonitic) reactivated and there was a setback and overlapping movement follows by a compression in the E-W and an extension in the NW-SE directions. This last stage would have given the dissymmetrical form to the trough after a depression of the basement. The Mbere fault zones remain high oceanic break that could be their prolongation on the continent in connection with the opening of the South Atlantic [6]. [27] propose that these faults zones constitute one of the intra-continental triple point segment, with dextral movement, located at Sudan, the two others being the rift of Abou Gabra and the dome of Darfour.
The basement of the trough consists of gneiss in the north and the southeast (Meiganga), and the granite in the South, characterized by very high value of the resistivities (resistivity higher than 10,000 Ω.m) that mainly consist the Adamawa uplift.
The pseudo-sections show the presence of a resistant block as intrusion to average depths, which seems to come from great depths. The materials of this intrusion might have come from the Mantle liquid. They rise towards the surface through the fractures of the basement, probably at the time of the faults reactivation of the CCSZ in Tertiary sector, might have been partial.
Moho is located between 25 and 35 km depth. This depth, obtained by the AMT method comes to confirm those already obtained by other methods (gravimetric and seismic). According to these results [10,21,28-30], the lower boundary of the crust is located at 23 km depth in the north of Adamawa; this depth is about 33 km in the south of Adamawa.
8. Conclusions
AMT method enables to determine a geoelectric model along the Mbere trough for two profiles. It brought much information on the bordering faults of the trough and its
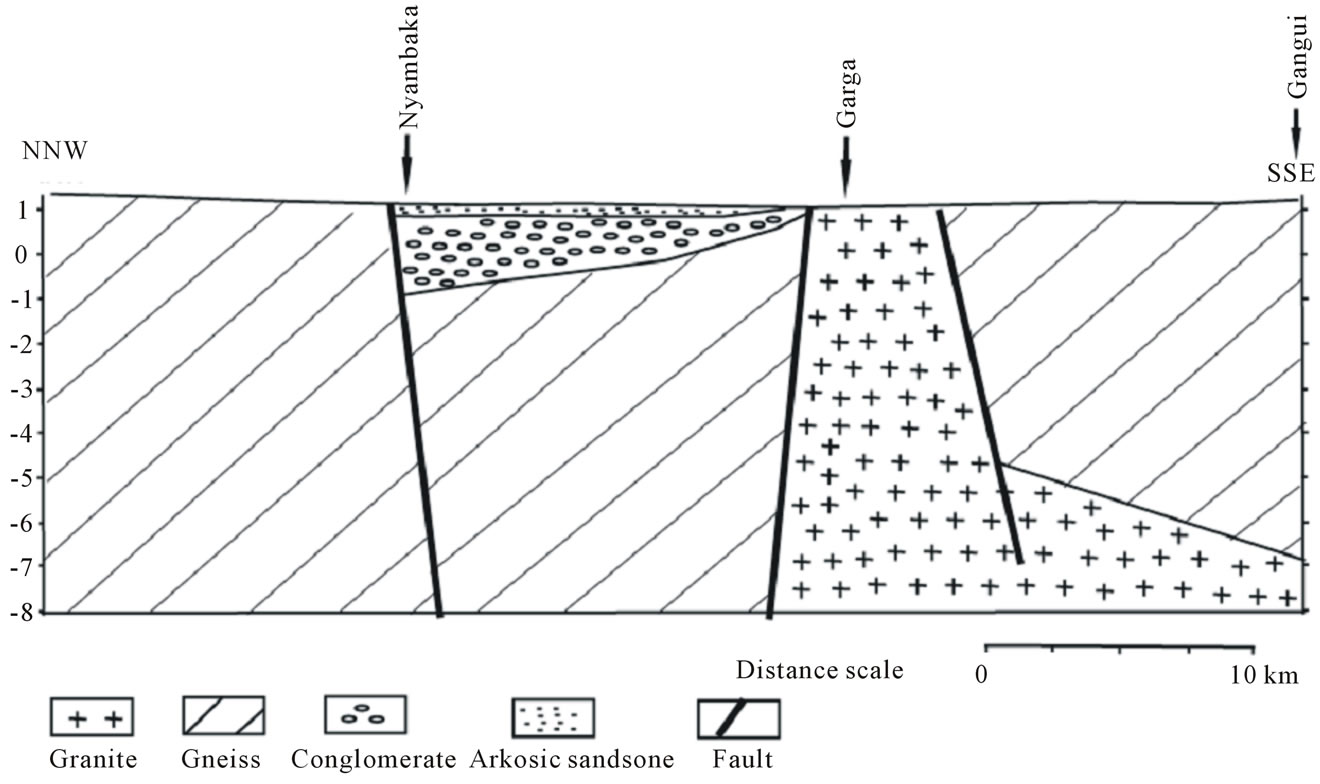
Figure 12. Geologic model of the Mbere trough at Belel.
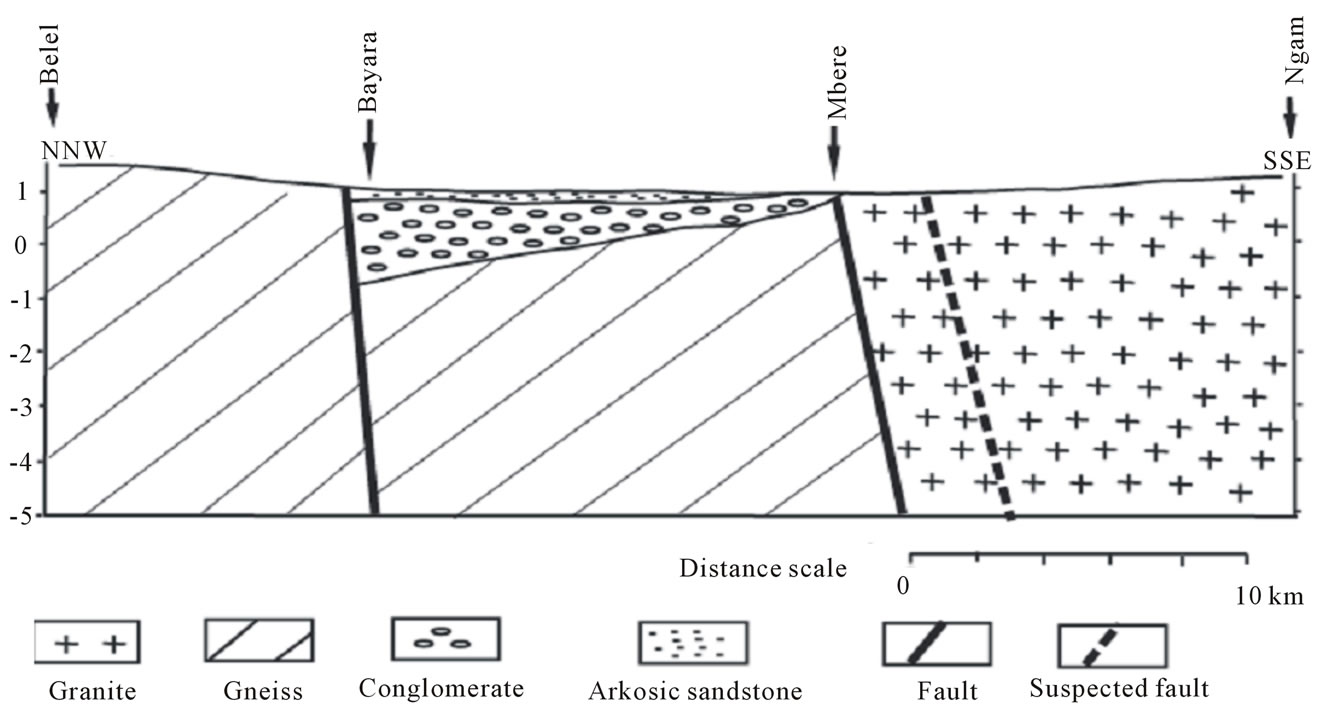
Figure 13. Geologic model of the Mbere trough at Nyambaka.
sedimentary filling.
AMT data analysis through pseudo-section shows the zones of discontinuity located on the northern and southern part of the Mbere trough. The pseudo-sections show the presence of a resistant block in the form of intrusion, located at the average depths under the trough, which seems to be related to the presence of the basaltic rocks that outflow in the region.
The interpretation of results enables to determine a geoelectric model through the trough on two profiles.
At Belel (profile A), the trough has a dissymmetrical form (or half-graben) with a sedimentary filling of about 2060 m and resistivity lower than 10,000 Ω.m, made up mainly of conglomerates under sandstone layer. The zones of discontinuity observed on the northern and southern part of the trough characterize its borders and materialize an intra-gneissic fault on the Northern part and a contact faulted between the granites and the gneisses on the southern edge. The basement consists of metamorphic and plutonic rocks (gneiss and granites respectively), very resistant, with resistivity higher than 10,000 Ω.m. The geoelectric sections show that the basement is more resistant at north than at the south of the trough, but clearly do not show the difference between these structures, because of their relatively close ranges of resistivity.
At Nyambaka (profile B), the trough has almost the same structure as at Belel, but with an average sediment thickness of 1800 m and the presence of gneiss in the South, which are not the same formation so to those in the north.
Moho is located between 25 and 35 km according to geoelectric sections. It characterized by a zone of transition between a very resistant crust with resistivities higher than 300,000 Ω.m and a conductive upper mantle with resistivities lower than 300,000 Ω.m.
REFERENCES
- J. F. Dumont, “Etude Structurale des Bordures Nord et Sud du Plateau de l’Adamaoua: Influence du Contexte Atlantique,” Géodynamique, Vol. 2, No. 1, 1987, pp 55- 68.
- M. Lasserre, “Etude Géochimique de la Partie Orientale de l’Adamaoua (Cameroun Central) et les Principales Sources Minéralisées de l’Adamaoua,” Bulletin de la Direction des Mines et Géologie du Cameroun, Vol. 4, 1961, p. 130.
- A. Le Maréchal and P. M. Vincent, “Le Fossé Crétacé du Sud-Adamaoua (Cameroun),” Cahier ORSTOM, Série Géologie, Vol. 3, No. 1, 1971, pp. 67-83.
- J. G. Fitton and H. Dunlop, “The Cameroon Line, West Africa, and Its Bearing on the Origin of Oceanic and Continental Alkaline Basalt,” Earth Planetary Sciences Letters, Vol. 72, 1985, pp. 23-38. http://dx.doi.org/10.1016/0012-821X(85)90114-1
- V. Ngako, P. Jegouzo and J. P. Nzenti, “Le Cisaillement Centre Camerounais. Rôle structural et Géodynamique dans l’Orogenèse Panafricaine,” Comptes Rendus de l’Académie des Sciences Paris, Vol. 313, No. 2, 1991, pp. 457- 463.
- E. Ngangom, “Etude Tectonique du Fossé de la Mbéré et du Djerem, Sud-Adamaoua, Cameroun,” Bulletin des Centres de Recherches Exploration-Production Elf-Aquitaine, Vol. 7, No. 1, 1983, pp. 339-347.
- A. M. Chevassus-Agnès, “Aspects Géomorphologiques du Fossé Tectonique de la Rivière Mbéré et de sa Bordure Méridionale, Région de Djohong,” Revue de Géomorphologie Dynamique, Vol. 4, 1971, pp. 145-160.
- F. Collignon, “Rapport sur Quelques Profils Gravimé- triques et Magnétiques dans la Vallée de la Mbéré,” Rapport Centre ORSTOM de Bangui, Multgr., 1970, p. 25.
- M. Cornacchia and R. Dars, “Un trait Structural Majeur du Continent Africain: Les Linéaments Centrafricains du Cameroun au Golfe d’Aden,” Bulletin de la Societe Geologique de France, Vol. 25, 1983, pp. 101-109.
- G. W. Stuart, J. D. Fairhead, L. Dorbath and C. Dorbath, “A Seismic Refraction Study of the Crustal Structure Associated with the Adamawa Plateau and Garoua rift, Cameroon, West Africa,” Geophysical Journal of the Royal Astronomical Society, Vol. 81, 1985, pp. 1-12. http://dx.doi.org/10.1111/j.1365-246X.1985.tb01346.x
- L. Dorbath, C. Dorbath, J. D. Fairhead and G. W. Stuart, “A Teleseismic Delay Time Study across the Central African Shear Zone in the Adamawa Region of Cameroon,” Geophysical Journal of the Royal Astronomical Society, Vol. 86, No. 3, 1986, pp. 751-766. http://dx.doi.org/10.1111/j.1365-246X.1986.tb00658.x
- C. T. Tabod, J. D. Fairhead, G. W. Stuart, B. Ateba and N. Ntepe, “Seismicity of the Cameroon Volcanic Line, 1982- 1990,” Tectonophysics, Vol. 212, No. 3-4, 1992, pp. 303- 320. http://dx.doi.org/10.1016/0040-1951(92)90297-J
- J. M. Nnange, D. Soba, J. D. Fairhead and G. W. Stuart, “Earthquake Activity in Cameroon during 1983,” Revue Scientifique et Technique, 1985, pp. 45-53.
- R. A. Langel, J. D. Phillips and R. J. Horner, “Initial Scalar Magnetic Anomaly Map from MAGSAT,” Geophysical Research Letters, Vol. 9, No. 4, 1982, pp. 269-272. http://dx.doi.org/10.1029/GL009i004p00269
- R. D. Regan, J. C. Cain and W. M. Davis, “A Global Magnetic Map,” Journal of Geophysical Research, Vol. 80, No. 5, 1975, pp. 784-802. http://dx.doi.org/10.1029/JB080i005p00794
- R. D. Regan and B. D. Marsh, “The Bangui Magnetic Anomaly: Its Geological Origin,” Journal of Geophysical Research, Vol. 87, No. B2, 1982, pp. 1107-1120. http://dx.doi.org/10.1029/JB087iB02p01107
- J. M. Nnange, “The Crustal Structure of the Cameroon Volcanic Line and the Foumban Shear Zone Based on Gravity and Aeromagnetic Data,” Ph.D. Thesis, University of Leeds, Leeds, 1991, p. 242.
- C. Moreau, J. M. Regnoult, B. Déruelle and B. Robineau, “A New Tectonic Model for the Cameroon Line, Central Africa,” Tectonophysics, Vol. 141, No. 1, 1987, pp. 317- 334. http://dx.doi.org/10.1016/0040-1951(87)90206-X
- F. Collignon, “Gravimétrie de Reconnaissance de la Ré- publique Fédérale du Cameroun,” ORSTOM, Paris, 1968, p. 35.
- C. S. Okereke, “A Gravity Study of the Lithospheric Structure beneath the West Africa Rift System in Nigeria and Cameroon,” Ph.D. Thesis, University of Leeds, Leeds, 1984.
- Y. H. Poudjom-Djomani, “Apport de la Gravimétrie à l’Etude de la Lithosphère Continentale et Implications Géodynamiques. Etude d’un Bombement Interplaque: Le massif de l’Adamaoua (Cameroun),” Thèse de Doctorat, Université de Paris XI, Orsay, 1993, p. 229.
- T. C. Noutchogwé, “Apport de la Gravimétrie à l’Etude de la Bordure Méridionale du Plateau de l’Adamaoua (Cameroun),” Thèse de Doctorat, Université de Yaoundé I, Cameroun, 2004.
- Y. Benderitter, “Interprétation des Mesures Obtenues avec un Résistivimètre Eca,” Notice d’Utilisation du Résistivimètre Eca, CNRS, CRG, Garchy, 1982.
- H. L. Kandé, “Etude Géophysique de la Structure de la Croute le Long du Fossé Tectonique de la Mbéré (Sud Adamaoua-Cameroun),” Thèse de Doctorat Ph.D., Université de Yaoundé I, Cameroun, 2008, p. 120.
- I. G. A. Société, “SONDMT: Interprétation des Sondages Magnétotelluriques,”1991.
- W. M. Telford, L. P. Geldart and D. A. Keys, “Applied Geophysics,” Cambridge University Press, Cambridge, 1976, p. 860.
- S. E. Browne and J. D. Fairhead, “Gravity Study of Central African Rift System: A Model of Continental Disruption. The Ngaoundere and Abu Gabra Rifts,” Tectonophysics, Vol. 94, No. 1-4, 1983, pp 187-203. http://dx.doi.org/10.1016/0040-1951(83)90016-1
- L. Dorbath and C. Dorbath, “Approche Sismologique de la Lithosphère en Afrique de l’Ouest,” Thèse de Doctorat, Université Pierre et Marie Curie, Paris, 1984, p. 307.
- L. Dorbath, C. Dorbath, G. W. Stuart and J. D. Fairhead, “Structure de la Croûte sous le Plateau de l’Adamaoua (Cameroun),” Comptes Rendus de l’Académie des Sciences, Vol. 298, No. 2, 1984, pp. 539-542.
- Y. H. Poudjom-Djomani, J. M. Nnange, M. Diament, C. J. Ebinger and J. D. Fairhead, “Effective Elastic Thickness and Crustal Thickness Variation in West Central Africa Inferred from Gravity Data,” Journal of Geophysical Research, Vol. 100, No. B11, 1995, pp. 47-70.
NOTES
*Corresponding author.