International Journal of Geosciences
Vol.4 No.7(2013), Article ID:36963,6 pages DOI:10.4236/ijg.2013.47103
Modeling of Land Subsidence in the South Pars Gas Field (Iran)
1Department of Geology, Faculty of Sciences, Kharazmi University, Tehran, Iran
2Department of Geology, Faculty of Sciences, University of Isfahan, Isfahan, Iran
Email: *MH.Taherynia@gmail.com
Copyright © 2013 Mohammad Hossein Taherynia et al. This is an open access article distributed under the Creative Commons Attribution License, which permits unrestricted use, distribution, and reproduction in any medium, provided the original work is properly cited.
Received July 8, 2013; revised August 5, 2013; accepted August 29, 2013
Keywords: Subsidence; South Pars; Compressibility; Reservoir Rock; Analytical Method; Semi-Analytical Method
ABSTRACT
The objective of this study is to predict the subsidence of the South Pars gas field at the end of production period. With respect to the notable reservoir thickness, significant pressure drop due to extraction and high areal extent of the South Pars gas field there is a high subsidence potential in this field. In order to determinate the maximum land subsidence and subsidence profile of the South Pars gas field, at first, the reservoir compaction was estimated based on the thickness of the reservoir, the pressure drop in the reservoir and the uniaxial compaction coefficient of the reservoir rock, and then the effect of the reservoir compaction on the field surface was modeled with the use of analytical and semi-numerical methods. The compaction of the reservoir at the end of production period was estimated to be about 0.48 m. Both of the subsidence modeling methods show similar results and predict that the maximum subsidence will reach about 0.6 m at the end of production period.
1. Introduction
Withdrawal of subsurface fluids such as groundwater, oil, and gas is a major cause for ground subsidence in the recent decades. The Ekofisk field is one of the wellknown examples of the subsided hydrocarbon fields. In 1984 the seabed under the operational platform had subsided over 3 m, and the remediation operation cost about one billion dollars [1]. At the end of 2000 subsidence of Ekofisk reached to 6.7 m and was continuously subsiding at a fairly constant rate [2] of about 0.4 m/year. The other well-known example of oil field subsidence is the Wilmington oil field in California, which has experienced 9 meters of subsidence [3]. The annual rate of surface subsidence in the Wilmington field was up to 70 cm [4].
Reservoir compaction and resultant subsidence have negative effects on the field exploitation such as reduction of reservoir porosity and permeability, flooding operational platform and wells casing collapse. Also reservoir compaction and field surface subsidence can cause formation and expansion of fractures in the caprock. This may impair the caprock’s reliability and provide some paths for the leakage of gas [4].
Physically, the surface subsidence of hydrocarbon field which is caused by compaction of reservoir rocks is due to the reduction of fluid pore pressure and increase of effective stress. In order to predict the subsidence above a hydrocarbon field, at the first, the reservoir compaction should be estimated. If the amount of the compaction is notable (larger than 10 cm), then, the effect of reservoir compaction should be modeled on the field surface [5].
The amount of reservoir compaction is dependent on the thickness of the reservoir, the pressure drop in the reservoir, and the unaxial compaction coefficient of the reservoir rock. The unaxial compaction coefficient can be calculated based on Hooke’s law and poroelastic theory. The unaxial compaction coefficient can also be estimated by the properties of reservoir, such as: lithology, depth of buried, porosity and degree of consolidation or cementation [5].
Presently, various methods have been presented for prediction of subsidence at ground surface. The analytical solutions that are described by Geertsma [5] can be introduced as the first method for subsidence prediction in the hydrocarbon fields. Fokker and Orlic [6] presented so-called semi-analytical method for prediction of subsidence caused by extraction of hydrocarbons. This method used combinations of analytical solutions for solving the visco-elastic equations in such a way that the boundary conditions at layer interfaces and the ground surface are approximated. The semi-analytic method is applicable for modeling of multilayer subsurface, with visco-elastic parameters changing per layer [6,7].
Both the analytical and semi-analytical methods have been applied to predict subsidence due to hydrocarbon production in the South Pars Gas field.
2. Geological Setting
The South Pars/North Dome gas field in the Persian Gulf is the largest offshore field in the world and is located at 105 Km southwest of Asalouyeh port of Iran at 52˚E to 52.5˚E and 26.5˚N to 27˚N. The area of this field is 9700 Km2, and the South Pars, which is part of Iran territory, is 3700 Km2 and the rest, North Dome, belongs to Qatar (Figure 1).
The South Pars/North Dome gas field is part of the huge NNE-SSW trend of Qatar Arch structural feature. The Kangan Formation and the Upper Dalan Member collectively formed South Pars Reservoir. The Kangan and Dalan Formations together are equivalent to the Khuff Formation in Arabian nomenclature. Kangan and Dalan Formations are separated by an impermeable layer. Each formation is divided and separated into two different reservoir layers, by impermeable barriers. Therefore, the field consists of four independent reservoir layers: K1, K2, K3, and K4 [8]. The rocks of the reservoir are mostly carbonates like dolomite, limestone, recrystallized limestone and replacive dolomite. The carbonate rocks of the reservoir, based on Dunham [9] classification, can be
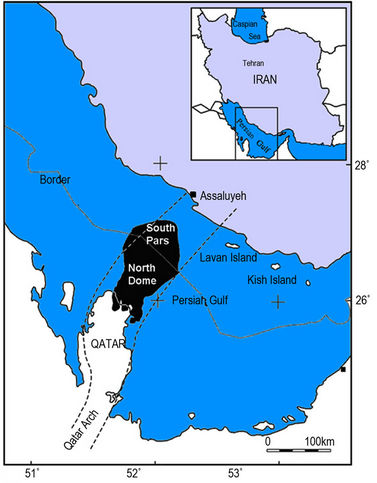
Figure 1. Geographical location of the South Pars/North Dome gas field.
classified as mudstone, grainstone and packstone.
3. Reservoir Compaction
In studies related to reservoir compaction, usually the media are assumed linear poroelastic, and composed of isotropic rocks in which the deformation can be expressed by Hooke’s law [10]. Because of the decreases of reservoir pore pressure due to gas and oil extraction and constant overburden pressure, the effective stress on the rock structure of the reservoir gradually increases [11]. Vertical deformation of reservoir rock by using Hooke’s law in terms of changes of major stress to original state of stress (before extraction) can be expressed as:
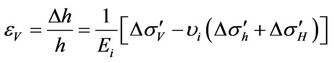 (1)
(1)
where ∆h is change of reservoir thickness, h is initial reservoir thickness, Ei is Young’s modulus of frame reservoir rock, υi is the Poisson’s ratio of reservoir rock, ∆σ′V, ∆σ′H and, ∆σ′h are changes in three effective major vertical and horizontal stresses, respectively.
For simplification, Geertsma [5] assumed that the stress arching does not occur and therefore all of overburden load is imposed over reservoir rock during extraction and the vertical stress stays constant. Since the overburden load is constant, any change in effective vertical stress will be due to reduction of reservoir pressure. This gives:
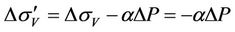 (2)
(2)
Change in effective horizontal stress, assuming they are equal, due to increasing effective vertical stress by using horizontal stress path of reservoir (K) can be calculated as:
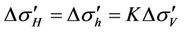 (3)
(3)
By inserting the change in three major stresses into Equation (1), the following equation can be obtained:
 (4)
(4)
where Cm is the uniaxial compressive coefficient of reservoir rock.
According to the above equation, compressibility of reservoir has a reverse relation with K. The coefficient of horizontal stress path can be calculated with used of Equation presented by Terzaghi and Richart [12] for sound reservoir rock as below:
 (5)
(5)
Also, the coefficient of horizontal stress path of fractured reservoir rock can be calculated by Addis [13] Equation:
 (6)
(6)
where φ is the angle of internal friction of reservoir rock.
South Pars reservoir can not be considered as either jointed or sound reservoir, because the present joints in this reservoir are usually classified as micro fracture and the dominate porosity of the reservoir is vuggy type porosity. Thus, it is difficult to define the reservoir’s stress path. In order to determine the stress path, the calculated results from Equations (5) and (6) compared with the results of breakout analysis performed in the field. The comparison indicated that, it can be expected that the South Pars reservoir will experience the stress path calculated by Equation (6) during field extraction.
Six main reservoir rock types with different elastic properties were identified in the South Pars reservoir. Some mechanical properties of these rock layers such as the uniaxial compaction coefficient (Cm) and predicted changes of thickness of each layer at the end of extraction period are presented in Table 1.
To compare, the uniaxial compaction coefficient of the Groningen reservoir varies between 0.45 and 0.75 × 10⁻⁴/ MPa. The initial pressure in the Groningen reservoir was 34.7 MPa, which has dropped to 12.5 MPa in 2005. The average thickness of the reservoir is 170 m. Therefore, total reservoir compaction between 17 and 28 cm [11]. The maximum subsidence in the Groningen gas field was reached over 25 cm in 2005.
4. Field Surface Subsidence
4.1. Analytical Method
There are many methods for determining the effect of the reservoir compaction on the field surface. One of the most common methods for subsidence evaluation is the analytical nucleus strain method presented by Geertsma [5]. The main idea of this method is to calculate the amount of subsidence caused by compaction of a small sphere and then to calculate the total subsidence by adding the influence of many of such spheres (nucleus of strain model). Use of this method is limited to well define reservoir shape which makes integration possible. Another limitation of this method is the assumption of homogeneous reservoir and confining rock. Based on the analytical method surface subsidence above a compacted disc-shaped reservoir can be calculated by the following Equation [5]:
 (7)
(7)
where ∆S(r) is the induced subsidence at a surface point which is located a radial distance r to the central axis of the disc-shaped reservoir of radius R, A is the geometrical factor which depends on the reservoir diameter compared to depth and ν is the Poisson’s ratio of surrounding rock of reservoir.
In order to use this method, the South Pars reservoir is divided into two disc-shaped reservoirs 1 and 2 of radius of 47 and 26 km respectively (Figure 2).
The geometrical factors of the Disk 1 and 2 are presented in Figure 3.
The profile of the subsidence bowl due to the compaction for each disk shapes and the whole reservoir along A-A' line and along B-B' line are presented in Figures 4(a) and (b).
As is shown in Figure 4, the maximum predicted subsidence at the end of production period may reach about 0.58 meter.
4.2. Semi-Analytical Method
After determining the high probability of subsidence in the South Pars gas field by using the Geertsma [5] analytical method, the semi-analytical method presented by Fokker and Orlic [6], which was implemented in the AEsubs software, was used for modeling of subsidence in the South Pars gas field. The main advantage of this method, compared with the analytical methods, is its
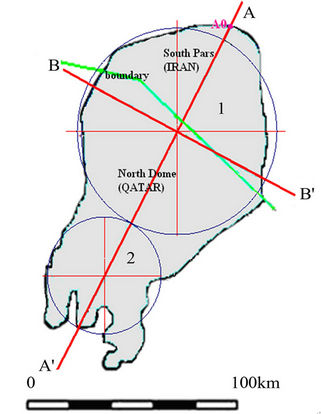
Figure 2. Division of the South Pars field into two disk shape field.
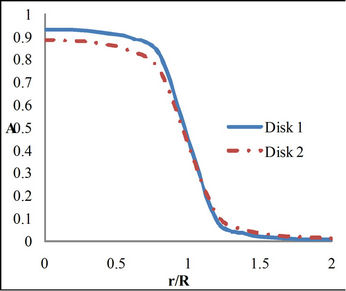
Figure 3. Geometrical coefficient (A) as a function of r/R.
 (a)
(a)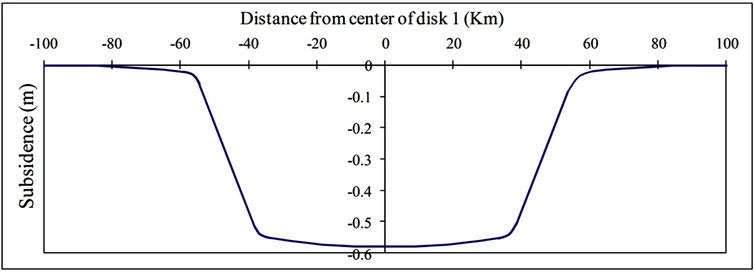 (b)
(b)
Figure 4. Modeled the subsidence bowl of the South Pars field, A; along A-A' line, B; along B-B' line.
higher accuracy and flexibility for complex conditions of reservoir and overburden. As was mentioned before, the analytical method is only applicable for homogeneous reservoir and surrounding rock, but the semi-analytical method, can model several layer media with different characteristics. This method is much simpler and needs less time than numerical method. The plan of subsidence bowl modeled by AEsubs software is presented in Figure 5. Also subsidence profile along A-A' line modeled by using of AEsubs software is presented in Figure 6.
4.3. Comparison of Modeling Methods
As shown in Figures 4 and 6, these two models show similar results. The important point about these models is that, the amount of subsidence of reservoir surface is larger than the reservoir compaction. The total compaction in the reservoir was estimated about 0.48 m (Table 1), while the maximum predicted subsidence is about 0.6 m. As is mentioned by Geertsma [5] this difference can be due to downward displacement of the reservoir bottom. By using Geertsma methods (nucleus of strain model), the vertical displacements along central axis in disk 1 and 2 were calculated and presented in Figure 7.
Also using the AEsubs software, vertical displacements of the reservoir bottom was modeled and presented in Figure 8.
According to two used modeling methods the reservoir bottom will be displaced downward.
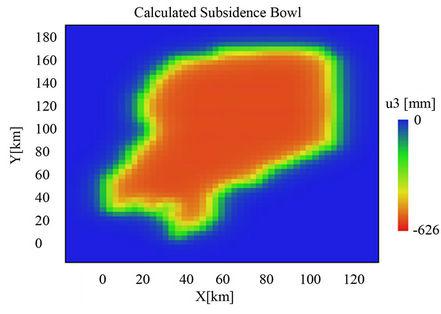
Figure 5. Plan of the subsidence bowl modeled by using of AEsubs software.
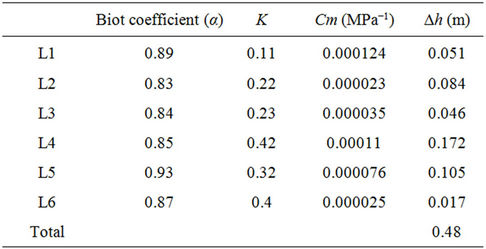
Table 1. Characteristics of the reservoir rock mass and predicted changes of thicknesses at the end of extraction.
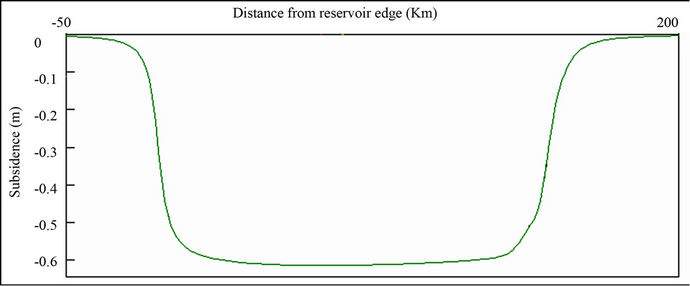
Figure 6. Profile of the Subsidence bowl along A-A' line modeled by using of AEsubs software.
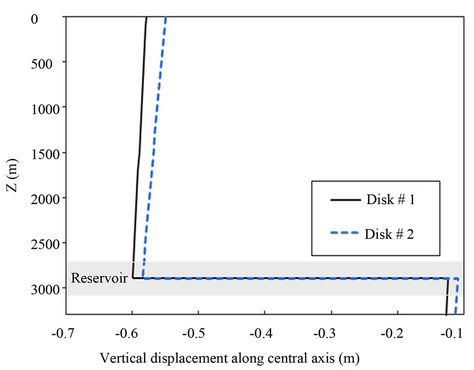
Figure 7. Vertical displacement along central axis calculated by the Geertsma method.
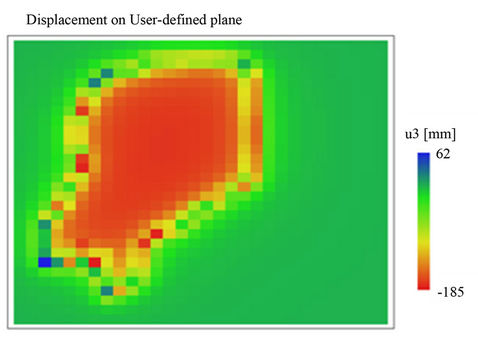
Figure 8. Vertical displacement of the reservoir bottom modeled by AEsubs software.
5. Conclusions
The initial pressure in the South Pars gas reservoir was 36.5 MPa, which will dropped to 6.2 MPa at the end of production period. As a result of this pressure decrease, the reservoir will be compacted about 0.48 m. We used the analytical and semi-analytical methods for determination of effect of reservoir compaction on the field surface. The maximum surface subsidence of the South Pars gas filed at the end of production period based on the analytical and semi-analytical modeling results will reach to 0.58 and 0.62 meters, respectively.
The results of subsidence modeling indicated that, due to downward displacement of the reservoir bottom, the predicted amount of subsidence in this field is higher than the amount of the reservoir compaction. Modeling by AEsubs software shows that the bottom of reservoir will displace about 0.18 m, while by using Geertsma [5] method, the calculations show that the downward displacement will be about 0.13 m.
For further determination of reservoir compaction, it is suggested that, in addition to performing laboratory tests on core samples, the compaction be measured with use of radioactive bullets that can be shot in the formation at observation wells. It is also suggested that, in order to obtain a complete insight of the Subsidence/ Compaction behavior of the South Pars gas field, surface deformation be monitored periodically. It should be noted that, the compaction and/or the subsidence occurs with some delay with respect to change in the reservoir pore pressure [2]. Therefore the field surface subsidence may be started several years, ranging from 1.6 to 13 years [14], after the gas production began and will continue several years after the end of production.
6. Acknowledgements
The authors wish to thank the office of graduate studies of the University of Isfahan and Kharazmi University for their support. The authors appreciate the support of National Iranian Oil Company for data preparation and permission to publish this paper. The authors wish to thank Dr. Mazda Kompani Zare and Mr. Abasali Porteghali for their useful advices. The authors would also acknowledge Dr. Peter Fokker for his great advices and recommendations and thank the TNO Company for supplying AEsubs software.
REFERENCES
- R. M. Sulak, “Ekofisk Field: The First 20 Years,” Journal of Petroleum Technology, Vol. 43, No. 10, 1991, pp. 1265-1271. doi:10.2118/20773-PA
- H. Hermansen, G. H. Landa, J. E. Sylte and L. K. Thomas, “Experiences after 10 Years of Waterflooding the Ekofisk Field, Norway,” Journal of Petroleum Science and Engineering, Vol. 26, No. 1-4, 2000, pp. 11-18. doi:10.1016/S0920-4105(00)00016-4
- M. N. Mayuga and D. R. Allen, “Subsidence in the Wilmington Oil Field, Long Beach, Californai, USA,” Proceedings of the Tokyo Symposium on Land Subsidence, International Association of Scientific Hydrology, Gentbrugge, IASH-UNESCO, Paris, Vol. 1, No. 88, 1969, pp. 66-79.
- A. E. Gurevich and G. V. Chilingarian, “Chapter 4: Possible Impact of Subsidence on Gas Leakage to the Surface from Subsurface Oil and Gas Reservoirs,” In: G. V. Chilingarian and T. F. Yen, Eds., Developments in Petroleum Science, Elsevier, Amsterdam, 1995, pp. 193-213.
- J. Geertsma, “Land Subsidence above Compacting Oil and Gas Reservoirs,” Journal of Petroleum Technology, Vol. 59, No. 6, 1973, pp. 734-744.
- P. Fokker and B. Orlic, “Semi-Analytic Modeling of Subsidence,” Mathematical Geology, Vol. 38, No. 5, 2006, pp. 565-589. doi:10.1007/s11004-006-9034-z
- P. A. Fokker, “Subsidence Prediction and Inversion of Subsidence Data,” SPE/ISRM Rock Mechanics Conference, Irving, 20-23 October 2002, p. 10. doi:10.2118/78227-MS
- H. Rahimpour-Bonab, “A Procedure for Appraisal of a Hydrocarbon Reservoir Continuity and Quantification of its Heterogeneity,” Journal of Petroleum Science and Engineering, Vol. 58, No. 1-2, 2007, pp. 1-12. doi:10.1016/j.petrol.2006.11.004
- R. J. Dunham, “Classification of Carbonate Rocks according to Depositional Texture,” In: W. E. Ham, Ed., Classification of Carbonate Rocks: American Association of Petroleum Geologists Memoir, American Association of Petroleum Geologists, Tulsa, 1962, pp. 108-121.
- E. Fjær, R. Holt, P. Horsrud, A. Raaen and R. Risnes, “Petroleum Related Rock Mechanics,” Development in Petroleum Science, Vol. 33, Elsevier Science Publishers B.V., Amsterdam, 2008, 491p.
- V. B. H. Ketelaar, “Subsidence Due to Hydrocarbon Production in the Netherlands,” In: Satellite Radar Interferometry: Subsidence Monitoring Techniques, Springer, London, 2009, pp. 7-27. doi:10.1007/978-1-4020-9428-6_2
- K. Terzaghi and F. E. Richart, “Stresses in Rock about Cavities,” Institution of Civil Engineers, London, 1952, 34p.
- M. A. Addis, “The Stress-Depletion Response of Reservoirs,” SPE Annual Technical Conference and Exhibition, San Antonio, 5-8 October 1997, pp. 55-65.
- M. Hettema, E. Papamichos and P. Schutjens, “Subsidence Delay: Field Observations and Analysis,” Oil & Gas Science and Technology—Rev. IFP, Vol. 57, No. 5, 2002, pp. 443-458.
NOTES
*Corresponding author.