International Journal of Geosciences
Vol.4 No.2(2013), Article ID:29363,7 pages DOI:10.4236/ijg.2013.42036
The Correlations between the Lightning Density Distribution of Sichuan Province and the Seismic Area
1Lightning Protection Center, Sichuan Meteorological Administration, Chengdu, China
2Guizhou Meteorological Administration, Guiyang, China
3CMA Meteorological Observation Center, China Meteorological Administration, Beijing, China
4Sichuan Meteorological Administration, Chengdu, China
Email: xiaobingjin@sina.com
Received November 30, 2012; revised January 6, 2013; accepted February 2, 2013
Keywords: Seismic Area; Lightning Density; Correlations; Distribution
ABSTRACT
We here report our observations of the intense lightning events during ~15:00, 23 September to ~12:00, 24 September 2008 along the fault of Wenchuan-Beichuan counties in Sichuan Province, China where a 8.0 magnitude earthquake strike on 12 May, 2008. This intense lightning period had the highest density in all available the lightning monitoring data of Sichuan. The altered lightning pattern is unlikely to be a coincidence. We also found that the spatial-temporal characteristic of lightning in Sichuan has changed after the earthquake. We studied the correlations and analyze the data between lightning and earthquake in order to understand the seemingly unrelated events.
1. Introduction
Although earthquake is one of major natural disasters, the immediate near-term prediction of earthquake largely remains elusive despite intense investigation, enormous effort and resources worldwide [1-5]. In order to better understand earthquakes and find correlations that are seemingly totally unrelated events, an open-minded and broad search is necessary.
After the 8.0 magnitude earthquake on May 12th, 2008 along the fault of Wenchuan-Beichuan counties in Sichuan Province, which has been showed in Figure 1, another 6.1 magnitude earthquake occurred on August 30th, 2008 in the boundary of Renhe area of Panzhihua and Huili county of Liangshan Yi Autonomous Prefecture that also located in the same seismic area, Sichuan Province.
These events stimulated us to search for a wide range of natural phenomena that may aid us to better understand the onset of earthquakes.
The major seismic area was located in the central segment of “Helan-ChuanDian Tectonic Belt”, which also called “China’s North-South Tectonic Belt” and “The Longmen mountain fault zone”.
2. The Lightning Density Distribution of Sichuan Province
We ask if there is a correlation between the intense and dense lightning and seismic activities. Previous studies have reported that the ionosphere activities at 0.1 - 10 km height and electrically active clouds were produced in an atmosphere sometimes in the eve of earthquake [6-8]. A possible influence of electromagnetic fields of seismic origin in the ionosphere-magnetosphere transition region has also been reported [9-11]. Our studies focus on lightning. It has been observed that there is frequent lightning in the period during the earthquakes. In the past observations before the Wenchuan earthquake, the highest period of lightning in that area is usually between May and August.
Prior 2005, there were sparse lightning monitoring systems in Sichuan, thus there were little available data. But these systems were significantly improved in 2005, making it possible for data collection and analyses. Based on our lightning monitoring data for 2005-2012, some interesting correlations were found between the lightning density distribution of Sichuan province and the seismic belt. In order to understand the correlations between lightning and earthquake, we carried out systematic analyses of available data. Figure 2 shows the lightning density distribution of Sichuan. Although there are only 8-year available data, it may nevertheless shed some light on the seemingly unrelated events.
We recorded some very unusual lightning event from ~15:00, September 23rd to ~12:00, September 24th, which was an intense and dense lightning period, accompanied heavy precipitation. And it had the highest density and intensity in all the available lightning monitoring data in
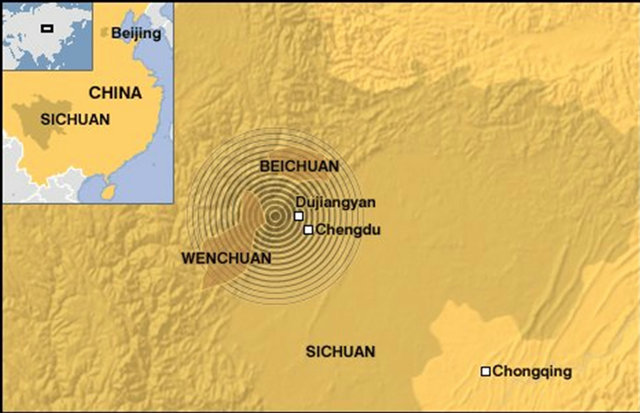
Figure 1. The map of earthquake area in Wenchuan, China. The Wenchuan 8.0 magnitude earthquake on May 12th, 2008 mainly occurred here. The Longmen mountain seismic belt is just between the Sichuan basin and the west plateau. Many cities, such as Chengdu, Mianyang, Deyang, Guangyuan and Ganzi lie in this seismic area.
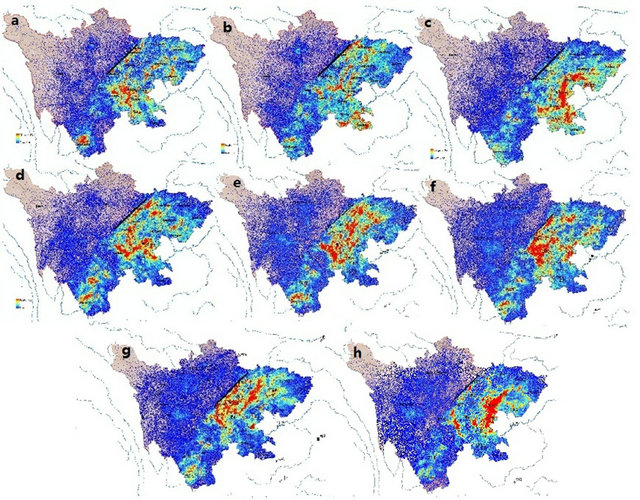
Figure 2. The lightning density distribution of Sichuan province. The black line indicates the Longmen mountain seismic belt. (a) The density in 2005; (b) The density in 2006; (c) The density in 2007, the lightning activities distribute mainly in the heavy precipitation in east Sichuan. The other areas are less; (d) The density in 2008, the lightning activities distribute almost covers the whole Sichuan basin and the Panxi plateau; (e) The density in 2009; (f) The density in 2010; (g) The density in 2011; (h) The density in 2012.
Sichuan. In the past, September usually does not have the high incidence period of lightning in Sichuan’s weather history. It seems that the weather pattern has been disturbed by the seismic activities.
Our lightning forecasting system predicted that lightning would occur at ~20:00, September 22nd. We predicted that the highest probability during following 12 hours was 80% in Sichuan including in greater Chengdu area. The forecasting placed a special warning ~20:00 on September 23rd. We also predicted that the highest probability in next 12 hours in the earthquake area was up to 90%. The intense and lightning indeed not only came as predicted but also was the first record that the highest dense lightning occurred at the end of flood season.
Figure 3 shows that the lightning distribution and the “Longmen mountain fault zone” and the Panxi seismic area are nearly overlapped. This seems unlikely a coincidence alone. It seems plausible there existed some correlation between the September 22nd heavy lightning and the May 12th earthquake. Whether the seismic activities influenced the lightning still need to be further analyzed and demonstrated.
3. The Correlation between Earthquake and the Change of Electric Charge of Ground
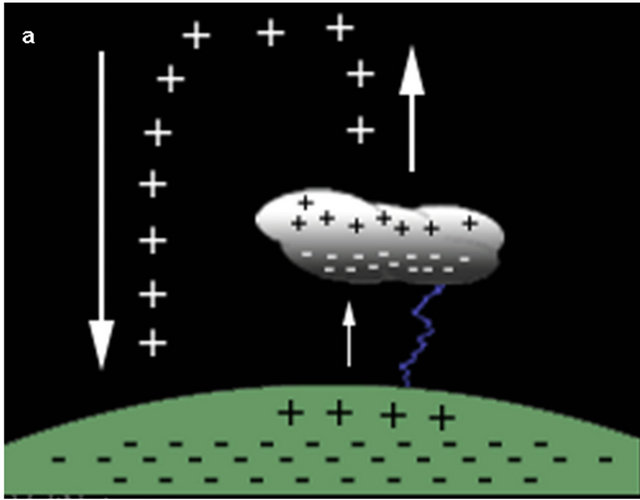
Our observations suggest that there seems to be a correlation between the lightning origination and the ground electric intensity. Under normal condition, the electric intensity is hecto-volts per meter, but rises up to kilovolts per meter pre-lightning. Even 14 mega-volts of ground is the characteristic parameter of the accumulation of the thundercloud. And the electric filed meter is used to measure the electric intensity, which has been directly installed on the ground. The Figure 4" target="_self"> Figure 4 showed the electric charge, which opposites to polarity of the cloud base, could be measured in the meter scale. In the range of sensitivity of the meter, the intensity of induced charge is proportional to the charge, which near the cloud base. So the electric field meter is very helpful for the real-time detection of the change of the nearby ground electric intensity.
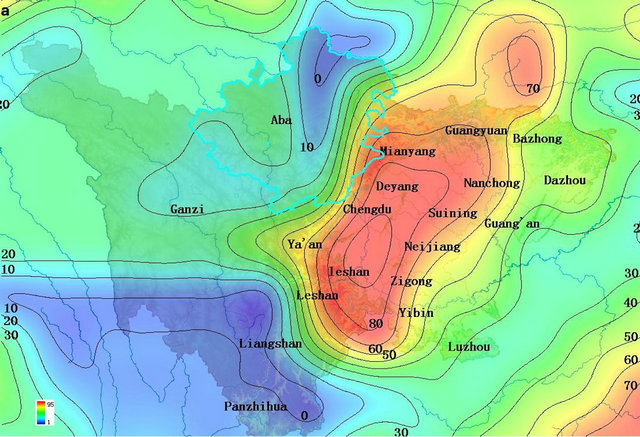
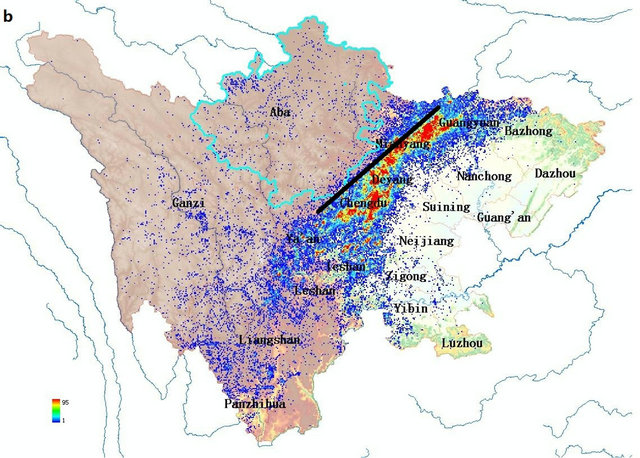
Figure 3. The forecasting and monitoring of lightning on the September 2008 in Sichuan. The black line in the figure indicates the Longmen mountain seismic belt. The lightning of Sichuan from 20:00 hours, Sept. 23rd to 08:00 hour on Sept. 24th. The detected lightning density and distribution along the “Longmen mountain fault zone” and the Panxi seismic area appear nearly overlapped.
 (a)
(a)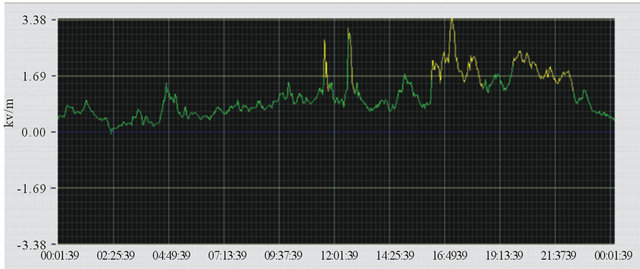 (b)
(b)
Figure 4. The form of the electric charge of ground, and its change before the earthquake. (a) The change of the charge near the cloud. The electric charge, which opposites to polarity of the cloud base, can be measured by the meter. In the range of sensitivity of the meter, the intensity of induced charge is proportional to the charge which near the cloud base; (b) The change of the electric field meter on May 12th, 2008, Chengdu. It can be see that, the change of the electric intensity of ground was very large when the earthquake happened.
Figure 5 showed that the lightning activities distribute mainly in the southeast of Sichuan basin and the Panxi plateau, but less in the west plateau. There are three high incidence areas in Sichuan; first, the heavy precipitation in east Sichuan, including Dazhou, Guang’an, Suining, Neijiang, Zigong; second, the Longmen mountain fault zone, including Mianyang, Deyang, Wenchuan; third, the seismic belt of Panxi plateau, including Panzhihua, Xichang, Huili. Two of three high incidence areas in Sichuan are on the seismic belt.
The lightning monitoring data of Sichuan province showed that the number of cloud-to-ground lightning was 72,092 times in that period and concentrated in Chengdu, Mianyang, Guangyuan, Meishan and Leshan areas. The May 12 quake area was not only completely covered by the dense and intense lightning but also the distribution of this lightning correlated with the seismic belt.
The earthquake activity is a large scale of crustal tectonic movement. In the pre-earthquake event, various geophysical parameters of the earthquake area not only have continuity in time, but also have different distribution of the geological structure in space. This constitutes the earthquake precursor field. In the pre-earthquake event, the ground resistivity in the epicenter and nearby region undergoes changes under the tectonic stress field, not only in the epicenter region stress field, but also appear different degrees of electromagnetic radiation phenomenon. This earthquake precursor phenomenon has been intensively studied from the observations worldwide [12-14].
In the stress accumulation process of the earthquake epicenter, the porosity of the rock decreases and the pore pressure increases under the compression process [15-18]. There is an enormous energy release, which drives the fluid flow. As long as the fluid carries hydronium which forms current while flowing, it adds to the original electric field, and can ignite a large extent change to the field. It also means that, only the electro-kinetic effect can initiated such a greatly change. Thus the area of atmospheric electric field anomaly is positively correlated with the magnitude [19-21]. The location of the epicenter is based on the frequency of appearance, duration, amplitude and spectrum characteristics of the anomaly. Therefore, the electric intensity of ground, which controlled by the earth’s external current system and earth’s internal media electric properties, contains abundant electricity current. The correlation of earthquake and lightning have now attracted increasing attention worldwide.
Our analyses show, the atmospheric electric field method, which used for the earthquake prediction has statistical characteristics. Thus, the method has special advantage in the observation research of the earthquake electric field, and may become to the critical point of the shortimpending earthquake prediction. Presently, the surface and satellite observation are the primary two methods of the earthquake electric field observation research. The surface observation mainly includes general geomagnetic and electric intensity observation is very similar to the observation that used for the lightning forecasting. Therefore, the earthquake and lightning both have some contact with the change of atmospheric and ground electric field, and there may be some correlations between them.
Based on our observations, we have propose 4 general correlations: 1) The lightning monitoring data showed that 60% higher lightning incidence areas in Sichuan are on the seismic belt, especially the region of “September 22nd dense lightning area”, is nearly superimposed to the “The Longmen mountain fault zone”. Thus there may be some correlation between the highest lightning incidence area and the seismic belt; 2) The time and distribution of highest lightning incidence have significantly changed
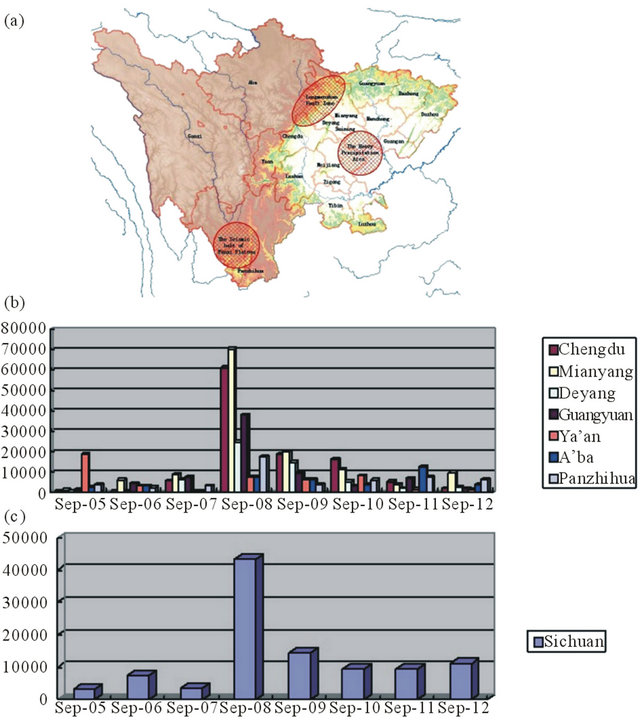
Figure 5. The spatial-temporal relationship between the earthquake and the lightning. (a) Three high incidence areas in Sichuan. First, the heavy precipitation in east Sichuan. Second, the Longmen mountain fault zone. Third, the seismic belt of Panxi plateau. Two of three high incidences of lightning areas in Sichuan are on the seismic belt; (b) The history data’s distribution of September in the quake-hit area of Sichuan; (c) The history data’s distribution of Sep in Sichuan Province. It can be see from this figure that, the data of September 2008 was very abnormal in the history of Sichuan.
after earthquake. The September always belongs to the lower lightning period in Sichuan’s history. However 4 months after the earthquake, there was frequently heavy precipitation and lightning in the Longmen mountain fault zone. Thus the May 12 earthquake may have significantly altered the time and distribution of lightning activity; 3) Forecasting earthquake through the change of seismic electric intensity of ground is one of the most common forecasting methods. When the May 12th earthquake occurred, the atmospheric electric field meter in Chengdu recorded strong change of the atmospheric electric field. (The meter is usually used to detect the lightning activities). It may imply that the earthquake could contribute to the activity of atmospheric and ground electric field. If these observations can be verified, lightning may perhaps be used as an indicator of the earthquake; 4) The atmospheric activities may be influenced by the earthquake.
The highest probability of lightning forecasting from the system was ~20:00, September 23rd that was completely covered the quake area. The lightning forecasting system was built with the decision tree method. It uses 8 atmospheric factors, such as CAPE, vertical wind shear, 850 hpa/sec, the vertical velocity and vortices of the 500 hpa, the divergence of the 200 hpa, the 12-hour precipitation forecasting under the T213 mode, the result of the numerical weather forecast, to calculate the probability. Such high probability in history proved that, the factors must be influenced by the electromagnetic, which created by the earthquake, absorbed energy, became more and more activity, and finally made the probability abnormally high.
4. Materials and Methods
Lightning location system of Sichuan Province is formed by one central station and 20 detecting stations. The detection stations were made by China Meteorological Administration, Weather Detection Center in 2005. The effective detection range of detection station is 300 kM; the distance of each station is ~150 kM. And 20 detection stations cover entire area of Sichuan Province, and make most area to be in at least 3 station’s coverage. Once the stations detect the lightning, they will send data to the central station with the appropriate network.
The central station has a high-speed server, it collects all data from detection stations and accurate the data through the way of azimuth intersection and time difference. It can obtain the detailed parameters of lightning, including the occurred time (precision to the nanosecond), location, intensity gradient, error and position mode.
And there is a statistical system to obtain the detailed parameters of the lightning storm, including the start and end time, extreme data, location area, and the function of query. The Geographic Information System is used to display the distribution of the lightning storm, and also the platform of the forecasting and monitoring of lightning.
The electric filed meter is used to measure the electric intensity, which has been directly installed on the ground for the real-time lightning detection. The effective detection range of the meter is 20 kM. When the electric intensity goes beyond the threshold, the lightning storm will come in less than 30 mins.
REFERENCES
- L. R. Sykes, B. E. Shaw and C. H. Scholz, “Rethinking Earthquake Prediction,” Journal of Pure and Applied Geophysics, Vol. 155, No. 2-4, 1999, pp. 2-4. doi:10.1007/s000240050263
- G. M. Molchan, “Earthquake Prediction as a DecisionMaking Problem,” Journal of Pure and Applied Geophysics, Vol. 149, No. 1, 1997, pp. 233-247.
- L. L. Romachkova, V. G. Kossobokov, G. F. Panza and G. Costa, “Intermediate-Term Predictions of Earthquakes in Italy: Algorithm M8,” Journal of Pure and Applied Geophysics, Vol. 152, No. 1, 1998, pp. 37-55.
- W. D. Mooney and A. Ginzburg, “Seismic Measurements of the Internal Properties of Fault Zones,” Journal of Pure and Applied Geophysics, Vol. 124, 1986, pp. 1-2.
- V. I. Larkina, A. V. Nalivayko and N. I. Gershenzon, “Some Statistical Results on Very Low Frequency Radio Wave Emissions in the Upper Ionosphere over Earthquake Zones,” Physics of the Earth and Planetary Interiors, Vol. 57, No. 1-2, 1989, pp. 100-109.
- M. Parrot, “Statistical Study of ELF/VLF Emission Recorded by a Low-Altitude Satellite during Seismic Events,” Journal of Geophysical Research, Vol. 99, No. A12, 1994, pp. 23339-23347. doi:10.1029/94JA02072
- M. A. Fenoglio, A. C. Fraser-Smith, G. C. Beroza and M. J. S. Johnston, “Comparison of Ultra-Low Frequency Electromagnetic Signals with Aftershock Activity during the 1989 Loma Prieta Earthquake Sequence,” Bulletin of the Seismological Society of America, Vol. 83, No. 2, 1993, pp. 347-357.
- M. W. Haartsen and S. R. Pride, “Electroseismic Waves from Point Sources in Layered Media,” Journal of Geophysical Research, Vol. 102, No. B11, 1997, pp. 24745- 24769.
- P. Varotsos, S. Uyeda and K. Alexopoulos, “Prediction of Recent Destructive Seismic Activities in Greece Based on Seismic Electric Signals,” In: M. Hayakawa and Y. Fujianawa, Electro-Magnetic Phenomena Related to Earthquake Prediction, TERRAPUB, Tokyo, 1994, pp. 13-24.
- C. Y. Wang, P. N. Sundaram and R. E. Goodman, “Electrical Resistivity Changes in Rocks during Frictional Sliding and Fracture,” Journal of Pure and Applied Geophysics, Vol. 116, 1978, pp. 4-5.
- C. Morrow and W. F. Brace, “Electrical Resistivity Changes in Tuffs Due to Stress,” Journal of Geophysical Research, Vol. 86, No. B4, 1981, pp. 2929-2934. doi:10.1029/JB086iB04p02929
- C. Y. Wang, P. N. Sundaram and R. E. Goodman, “Electrical Resistivity Changes in Rocks during Frictional Sliding and Fracture,” Pure and Applied Geophysics, Vol. 116, No. 4-5, 1978, pp. 717-731. doi:10.1007/BF00876534
- W. F. Brace, J. B. Walsh and W. T. Frangos, “Permeability of Granite under High-Pressure,” Journal of Geophysical Research, Vol. 73, 1986, pp. 2225-2236. doi:10.1029/JB073i006p02225
- R. F. Corwin and H. F. Morrison, “Self-Potential Variations Preceding Earthquakes in Central California,” Geophysical Research Letters, Vol. 4, No. 4, 1995, pp. 171- 174. doi:10.1029/GL004i004p00171
- P. Varotsos and K. Alexopoulous, “Physical Properties of the Variations of the Electric Field of the Earth Preceding Earthquakes,” Tectophysics, Vol. 110, No. 1-2, 1984, pp. 73-98. doi:10.1016/0040-1951(84)90059-3
- F. T. Freund, “Rocks that Crackle and Sparkle and Glow: Strange Pre-Earthquake Phenomena,” Journal of Scientific Exploration, Vol. 17, 2003, pp. 37-71.
- S. K. Park, M. J. S. Johnston, T. R. Madden, F. D. Morgan and H. F. Morrison, “Electromagnetic Precursors to Earthquakes in the ULF Band: A Review of Observations and Mechanisms,” Reviews of Geophysics, Vol. 31, No. 2, 1993, pp. 117-132. doi:10.1029/93RG00820
- M. A. Fenoglio, M. J. S. Johnston and J. D. Byerlee, “Magnetic and Electric-Fields Associated with Changes in High Pore Pressure in Fault Zones—Application to the Loma-Prieta Ulf Emissions,” Journal of Geophysical Research: Solid Earth, Vol. 100, No. B7, 1995, pp. 12951- 12958.
- H. Mizutani, T. Ishido, T. Yokokura and S. Ohnishi, “Electrokinetic Phenomena Associated with Earthquakes,” Geophysical Research Letters, Vol. 3, No. 7, 1976, pp. 365-368. doi:10.1029/GL003i007p00365
- G. A. Sobolev, “Application of Electric Method to the Tentative Short-Term Forecast of Kamchatka Earthquakes,” Pure and Applied Geophysics, Vol. 113, No. 1, 1975.
- T. Bleier and F. Freund, “Impending Earthquake Have Been Sendingus Warning Signals and People Are Starting to Listen,” IEEE Spectrum International, Vol. 12, 2005, pp. 17-21.