International Journal of Geosciences
Vol. 3 No. 3 (2012) , Article ID: 21206 , 9 pages DOI:10.4236/ijg.2012.33057
Characterization and Classification of Rocks with Lamb Modes
1Metrology Laboratory and Information Treatment, Department of Physics, University Ibn Zohr, Agadir, Morocco
2Equip Petrology, Metallogeny and Materials, Department of Geology, University Ibn Zohr, Agadir, Morocco
Email: elabassi.dris@gmail.com
Received April 3, 2012; revised May 1, 2012; accepted May 30, 2012
Keywords: Ultrasound; Lamb waves; nondestructive investigation; magmatic rocks; metamorphic rocks; sedimentary rocks
ABSTRACT
The nondestructive investigation by ultrasound has become a fundamental tool for characterizing rocks. We applied this technique for characterizing samples of rocks. The later had been members of the following three big families of geological classification: magmatic rocks, metamorphic rocks, sedimentary rocks. The method usually used is based on the measurement of ultrasound parameters, i.e. the longitudinal and transversal propagation velocities. The measurement of these parameters allows to determine the mechanical properties of each rock. These studies do not allow to find the three big axes of the rocks. In this work we show for each rock his corresponding ultrasonic signature by the use of his experimentally determined Lamb dispersion curves. The obtained results put in evidence that the descending slope of the Lamb modes is a reliable and efficient criterion for classifying rocks by ultrasound. This is an adequate solution for a good classification of rocks. It gives a high precision, it is reliable and quick and last not least cheap.
1. Introduction
Nowadays the use of ultrasound techniques in the laboratory becomes very popular because of their nondestructive character, their high precision and their low cost. As for the mechanics of rocks, these techniques are regularly used to determine the physical and mechanical properties of the rocks [1-3]. Further on, these techniques are applied to evaluate the quality of the rock [4] and to identify fissures and defects in the rock matrix. The ultrasound measurements generally used consist in measuring the longitudinal and transversal velocities of ultrasound in the rock. With these values the mechanical properties of the rock can be determined.
Several researchers like M. Inoue and M. Ohomi, 1981 [5]; P. Gaviglio, 1989 [6]; F. K. Boadu, 2000 [7]; S. Kahraman, 2001 [8]; H. T. Ozkahraman et al., 2004 [9]; E. Yasar, and Y. Erdogan, 2004 [10]; M. Khandelwal et al., 2009 [11]; M. Khandelwal et al., 2010 [12], studied the relation between the properties of the rocks and their ultrasound parameters (velocity of P-waves). They derived two interesting conclusions: 1) the velocity of ultrasound is closely related with the dynamic properties of the rocks; 2) the existence of a number of factors which influence the velocity of ultrasound waves in the rocks. These factors are: grain size, mineralogy, granulometry, volume density, the elastic properties, porosity and anisotropy of the rock [8,12].
Today the classical ultrasound techniques used in this domain are based on volume waves in one single direction (longitudinal or transversal waves) [13], whereas the use of Lamb waves allows to study the material with an angular scan. These waves have the advantage to put into vibration the whole rock plate and have the particularity to be dispersive, multimodal and only slightly damped [14].
The objective of this work is to use the dispersion of Lamb modes as a novel alternative to characterize and classify rocks. Based on the dispersion curves we tried to evaluate the descending slopes (DS) of the Lamb modes as a significant and decisive criterion to classify rocks with an ultrasound investigation.
The principal objective of our work is to study the possibility to replace the ordinary destructive tests used by geologists (thin plates, electron micro probe analyzer, analyses of rock powder, etc.) with nondestructive ultrasound techniques to determine the physical and mechanical properties of the rocks. For this purpose we developed a method which works with the transmission of ultrasound waves through rock samples in an immersion bath.
2. Preparation and Presentation of the Studied Samples
The preparation of the rock samples to be characterized with ultrasound waves is very important, because it needs identical shaped samples to get decisive results. We followed a two step process: At first the rocks are cut with a saw, where it is tried to cut them into plates with parallel faces with the dimensions (10 cm × 5 cm × 4 mm). The second step is the polishing of the plates in order to get plates with smooth surfaces. For an excellent polishing a cast-iron disk had been disposable. The polishing on this disk is done with the help of silicon powder chosen according to the hardness of the material; different grain granulometries appropriate to each sample were applied. Table 1 gives the studied rock samples as their origin and their classes.
3. Experimental Setup
To measure the dispersion of the Lamb modes we used a transmission technique with varying incidence angles for the ultrasonic waves. The ultrasound signals were created with a generator of short intensive pulses (Sofranel 5052 PR) which excited a broad band ultrasound emitter (Panametrics V 309) with a central frequency of 5 MHz. We prepared the rock samples as highly polished thin rock plates. The selected frequency had been adopted at the thickness of the rock plates which equaled 4 mm. The sound emitter and receiver as the samples were placed into water. The sound emitter and the sound receiver were aligned on one axis on opposite sides of the rock plate (figure 1). The captured transmitted signals were digitized with the help of a digital oscilloscope (hp 54600B). These signals were at first averaged and then transferred to a computer.
The change of the incident angle of the ultrasound waves on the rock plate was done with a step motor (ITL09) which allowed to rotate the rock plate with a precision of 10−3 degrees.
For every incident angle a temporal signal is registered
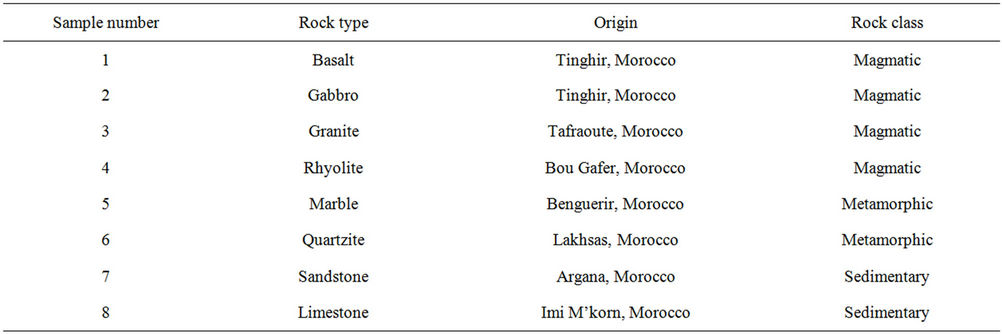
Table 1. Description of the studied rocks.
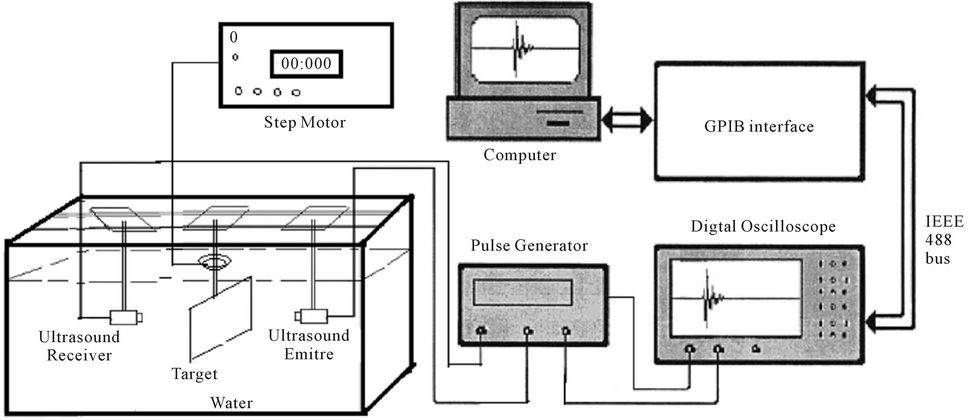
Figure 1. Scheme of our experimental apparatus.
and his spectral amplitude is calculated. The resonances of the rock plate are then determined from the spectral maximums. The same procedure is repeated for the other angels until the critical angle of the rock plate is reached. The critical angle is reached when the transmitted ultrasound signal disappears. The dispersion curves of the rock plate are obtained by superposition of these maxima.
The transmitted signals consist of several echoes due to multiple reflections at the interior of the rock plate. Figure 2 shows the transmitted echoes for a basaltic plate of 4 mm thickness at an angle of 0˚. Figure 3 shows the spectrum of the transmitted echoes obtained by a Fast Fourier Transform (FFT). One notes in particular the maximums which correspond to different modes propagating through the basaltic plate.
4. Results and Discussion
4.1. Ultrasonic and Mechanical Properties of the Investigated Samples
In the ultrasound method one measures the longitudinal
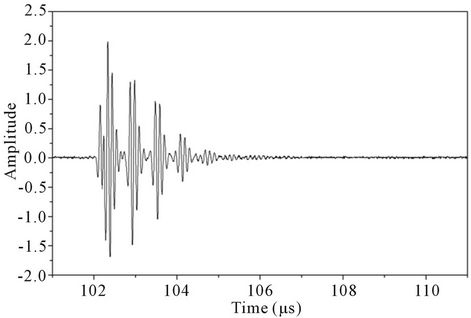
Figure 2. Transmitted signal of a basaltic rock plate of 4 mm thickness at an angle of 0˚.

Figure 3. Transmission spectrum of a basaltic rock plate of 4 mm thickness at an angle of 0˚.
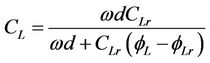
and transverse velocities as well as the attenuation from the arguments and modules of the Fast Fourier Transform of the transmitted signal, by the use of the following equations [15,16]:
 (1)
(1)
 (2)
(2)
 (3)
(3)
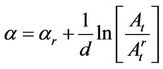
The transmission method needs the usage of a reference plate with known ultrasound parameters [16,17]. In the signal transmitted through the rock plate one isolates the first echo which is related to the longitudinal wave (L) and one isolates separately the second echo which is relative to the transverse wave (T).
Where,  and
and  are the attenuation of the rock and the reference material, d is the thickness of the rock plate,
  and
and  are the longitudinal and transverse sound propagation velocities (m/s) of the rock plates,
  and
and  are the amplitude of the transmitted signal of the rock plate and the reference material,
  and
and  are the phase of the transmitted signal of the rock and the reference material,
  is the travel time and
  is the angle of incidence.
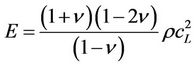
Table 2 illustrates the experimental results of our ultrasound measurements. In this table we indicate the measurements of the longitudinal and transverse velocities as well as the attenuation of the different rock plates. The elastic constants of the material (Young modulus E and Poisson ratio ν) depend on the velocities of the propagation of ultrasonic waves ( and
and ) and the density ρ [18]. That is why our velocity measurements allowed us to determine the mechanical properties of the samples via the equations:
 (4)
(4)
 (5)
(5)
where, ρ is volume density (kg/m3), CL and CT are longitudinal and transverse velocities (m/s), E is Young modulus (GPa) and ν is Poisson ratio.
In the case of rocks these physical parameters are closely related with the petrographical, mineralogical nature and the porosity of the rocks [19]. Numerous works published in the last years dealt with the determination of the physiomechanical properties of the rocks via ultrasound measurements [1,20]. The values of the
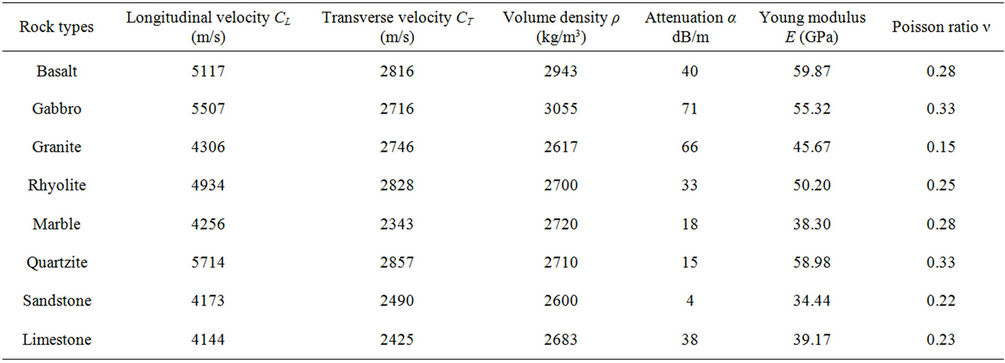
Table 2. The mechanical and ultrasonic properties of the investigated samples.

Figure 4. Longitudinal velocity in function of the rock type.

Figure 5. Transverse velocity in function of the rock type.
ultrasound parameters of the experimentally measured rocks (table 2) are compatible with the ones given generally in the literature for the majority of the rocks [13, 21]. The ultrasonic parameters (figures 4-6) as well as the mechanical parameters (figures 7 and 8) do not allow to classify the rocks in the three categories of table 1. These parameters vary in a random manner.
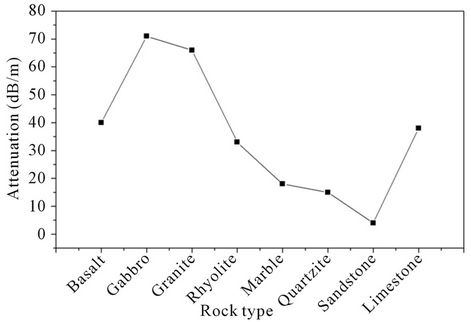
Figure 6. The attenuation in function of the rock type.
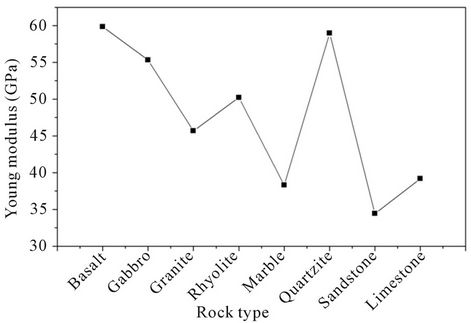
Figure 7. The young modulus in function of the rock type.
4.2. The Dispersion of Lamb Modes in Rock Plates
The principle objective of the experimental study developed in this work is to get the dispersion curves corresponding to each rock plate (acoustic signature). In order to plot the dispersion curves, one has at first to generate
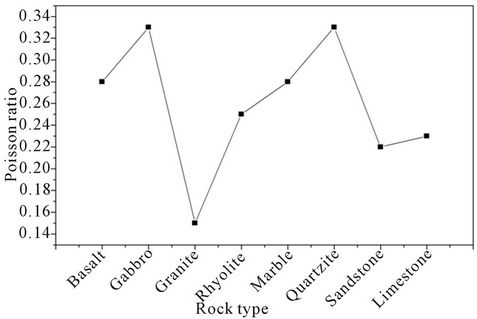
Figure 8. Poisson ratio in function of the rock type.
the Lamb waves inside the rock plate. We have chosen a thickness of 4 mm for each plate. This thickness had been chosen after a preliminary theoretical study based on the central frequency of 5 MHz of our ultrasound generator. This compromise between thickness and frequency allowed us to follow the propagation of Lamb modes, which are generated depending on the incident angle of the ultrasonic waves.
4.2.1. Lamb Modes in a Homogenous Isotropic Plate
In an infinitely extended solid an elastic longitudinal and transverse volume wave can propagate. If the solid is only finitely extended and has a free surface, the wave will interact with this boundary and the volume wave will be reflected, where longitudinal modes might be converted into transverse modes and vice versa. If the solid has two parallel plane surfaces, the reflections on the two surfaces create guided waves. The later are named Lamb waves, after Sir Horace Lamb, which discovered them in 1917 [22].
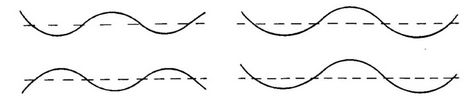
In order to study the different modes, which propagate in a homogenous and isotropic plate, one has to resolve the problem of the propagation of elastic waves in a plate placed in the vacuum [23] (figure 9). The solutions of the propagation equation have to satisfy the boundary conditions, and this leads to the dispersion equations of the symmetric (S) and antisymmetric (A) Lamb modes (figure 10).
4.2.2. Modeling of the Dispersion Curves of Lamb Modes
Figure 11 illustrates the example of the simulated dispersion curves for a sand stone rock plate. A 3D software had been used to represent the results in three dimensions (incident angle, frequency and the transmitted amplitude in gray scale).
The parameters of the sand stone rock plate chosen in the modeling had been: CL = 4173 m/s, CT = 2490 m/s and ρ = 2600 kg/m3.
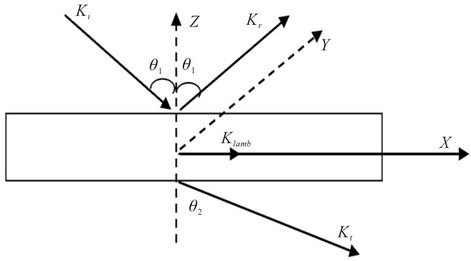
Figure 9. Geometry of the problem.
 (a) (b)
Figure 10. Symmetric (a) and antisymmetric (b) Lamb modes.
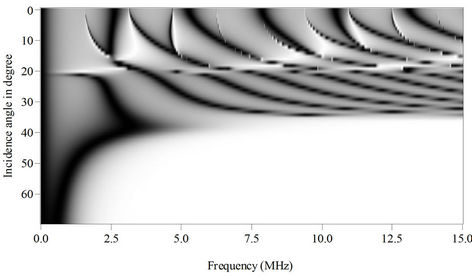
Figure 11. Theoretical dispersion curve of sandstone.
Every mode above the zero order mode does not exist below a certain frequency, the so called cut-off frequency fc. These cut-off frequencies are proportional to the velocity CT of the transverse waves [23]:
 for the modes S2n and A2n+1(6)
or proportional to the velocity CL of the longitudinal waves:
 for the modes A2n and S2n+1,(7)
where, d is the thickness of the plate and p = 2n or 2n + 1 is the order (even or odd) of the Lamb mode.
4.3. Experimentally Obtained Dispersion Curves of Lamb Modes
The figures 12-19 below illustrate the dispersion curves of the Lamb modes of the studied rocks. For each rock the corresponding dispersion curve is shown, where the amplitude of the signal is depicted in gray scales. We
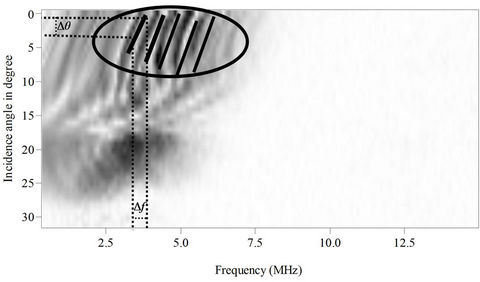
Figure 12. Dispersion curves for Rhyolite.
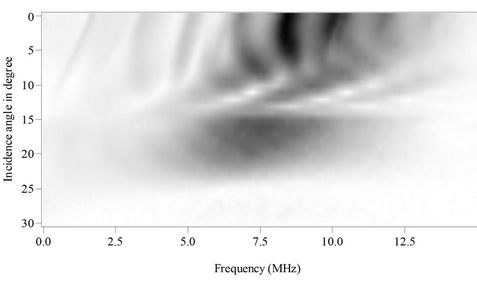
Figure 13. Dispersion curves for Basalt.
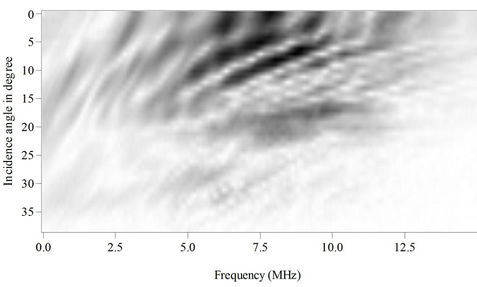
Figure 14. Dispersion curves for Granite.
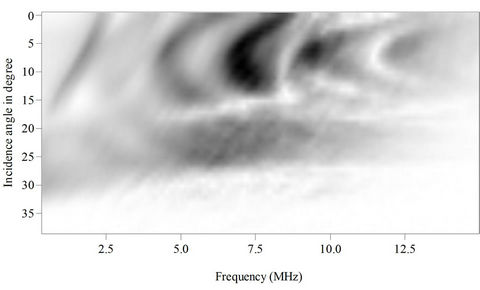
Figure 15. Dispersion curves for Gabbro.
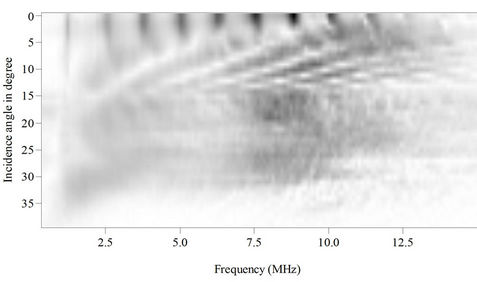
Figure 16. Dispersion curves for Marble.

Figure 17. Dispersion curves for Quartzite.

Figure 18. Dispersion curves for Sandstone.
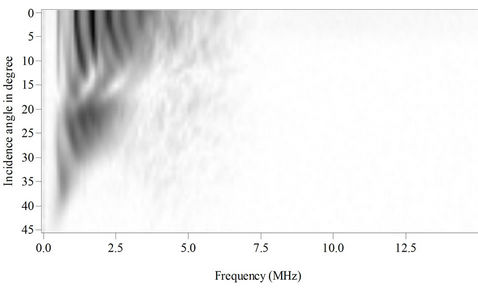
Figure 19. Dispersion curves for Limestone.
remark that the dispersion curves differ from one sample to the other as per the number, the position and the shape of the modes. For the samples of the same class we observe that the shape of the modes is identical but that they differ in number and position. For the four samples of magmatic class, we note that each sample has its own ultrasound image to him, the difference between the four samples is clear on the level of the number and the position of the modes: the number of modes in the Rhyolite is larger compared to the Basalt, as we see the same observation between Granite and Gabbro. Concerning the two metamorphic samples, we can easily notice that the shape of the modes is the same but the difference is in the number and position of modes: the number of Lamb modes in the Marble is larger compared to quartzite, thus for the position we find that the modes are clear and spaced apart in Marble by cons are condensed in the case of Quartzite. In the end the two sediment samples, we note that the mode shapes is almost the same but the difference is in the number and position of modes: the number of Lamb modes in the Sandstone is larger compared to the Limestone and the level of the position we note that the modes are condensed in the case of limestone by cons are clear and spaced apart in the sandstone.
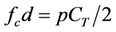
The characterization of the rocks is done from their corresponding dispersion curves. We have chosen to study the shape of these modes by calculating the descending slope for each mode in the frequency band from 2.5 MHz to 5 MHz and the range of rotation angles from 0˚ to 5˚ as a significant criterion. The frequency band had been chosen for the reason, that it is the central band of the two transducers used in the study and that for rock plates of 4 mm thickness most of the Lamb modes are present around this band for all studied rocks. As to the range of the selected rotation angles, we studied this range because the shape of the modes and consequently their slopes change for angles over 5˚ (figures 12-19).
To explain the results mentioned on the top we must take into consideration the fact that the propagation of ultrasonic waves is very sensitive to the grains size, the pores size and the types of minerals in the rock [8,12]. It will be very reasonable that the ultrasound image will be different from one rock to another because it reflects precisely the effect of all these parameters on the propagation of ultrasonic waves from a rock to another. Although, the results of the ultrasonic signature shown on top confirm this aspect explicitly. That shows the aptitude of ultrasonic technology to characterize the rock plates in a reliable way and to give a specific identity card to each rock by exploiting the curves of dispersion composing its ultrasonic image. We can deduce the longitudinal velocity of the ultrasonic waves in the rock plate from the dispersion curves then we deduce the transverse velocity and then we use these two results to deduce the mechanicals properties of rock. In this work, we have not tried to exploit the dispersion curves for this aim but we have introduced a new criterion (DS) to explore the possibility of classifying the rocks in terms of ultrasound.
4.4. Ultrasound Classification of Rocks
The descending slope (DS) is calculated by the following formula:
 (8)
(8)
where,  is the variation of incidence angle and
  is the frequency variation (Figure 12).
Table 3 shows the calculated values of the descending slopes for each Lamb mode within the frequency range from 2.5 MHz to 5 MHz and the range of rotation angles from 0˚ to 5˚, where each Lamb mode is identified by his product of frequency times plate thickness (see Formulae (6) and (7)). We realize that the descending slope can be negative, positive or infinite. Based on these calculated values of the slopes, we had been able to classify the samples of the studied rocks into three classes: The first class has negative slopes for the magmatic rocks granite, rhyolite, basalt, gabbro. The second class has infinite slopes for the metamorphic rocks marble and quartzite. The third class has positive slopes for the sedimentary rocks limestone and sandstone.
Comparing this classification with the one of geologists, one observes that the ultrasound classification is identical to the geologic classification. Whereas the geologic classification is based principally on the petrology of the rocks, our ultrasound classification is based on the calculation of the descending slope of the modes.
5. Conclusions
We demonstrated with the present work the validity of our ultrasound technique for measuring the ultrasound parameters of rocks as well as their mechanical properies. We found values of the longitudinal and transverse velocities, which are in the range of the values given in the literature. The originality of our study consists in the use of the dispersion curves of the Lamb modes as a new alternative to characterize rocks and to simplify their classification compared with the methods based on the measuring of the viscoelastic and mechanical parameters.
The samples selected for this work are of a varying petrographic nature and distinguish from each other by their color, structure, texture, density and chemical composition. In our work we have shown up the link between the petrography of the rock and the descending slope of the different Lamb modes in his diagram of dispersion curves. We showed that the descending slope is a
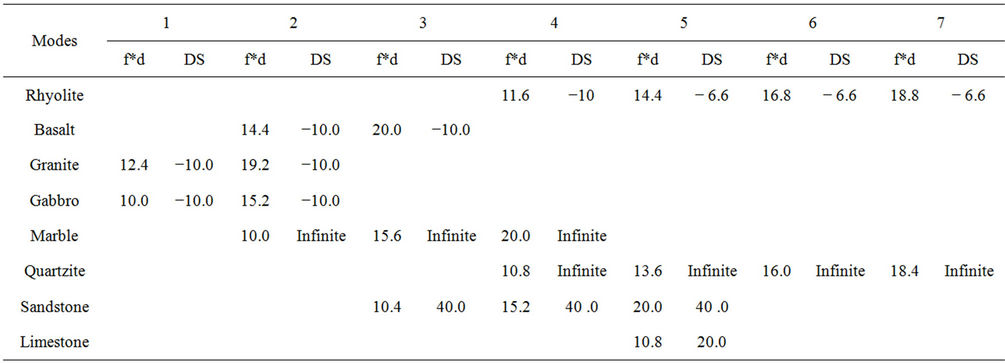
Table 3. The descending slopes (DS) of the lamb modes of the investigated rocks in [degrees/MHz].
significant and decisive criterion for classifying rocks with an ultrasound investigation and additionally our work showed that this slope is positive for sedimentary rocks, negative for magnetic rocks and infinite for metamorphic rocks. This study also revealed that the developed ultrasound technique can be adapted to characterize rocks in a nondestructive and nonexpensive way, as well that each rock has unique acoustic signature.
A good exploitation of this method in engineering in order to find the mechanical and physical properties of rocks in a reliable and fast way consists in respecting the compromise between the frequency and the thickness of the rock plate, if this last is large we must work in this case with low frequencies; for example in the case of the rock masses we use generally the low frequencies (50 KHz); in the case of a small thickness (4 mm in our case) we work at high frequencies as we have developed during this work (5 MHz).
Based on our method of an analysis of the dispersion curves of the Lamb modes, a continuation of our research for other types of rocks, like for instance meteorites, appears self-evident.
REFERENCES
- G. Vasconcelos, “Ultrasonic Evaluation of the Physical and Mechanical Properties of Granites,” Ultrasonics, Vol. 48, No. 10, 2008, pp. 453-466. doi:10.1016/j.ultras.2008.03.008
- Y. Youash, “Dynamic Physical Properties of Rocks: Part 2, Experimental Result,” Proceedings of the 2nd Congress of the International Society for Rock Mechanics, Beograd, 21-26 September 1970, pp. 185-195.
- S. Kahraman and T. Yeken, “Determination of Physical Properties of Carbonate Rocks from P Wave Velocity,” Bulletin of Engineering Geology and the Environment, Vol. 67, No. 2, 2008, pp. 277-281. doi:10.1007/s10064-008-0139-0
- S. Kahraman, U. Ulker and S. Delibalta, “A Quality Classification of Building Stones from P-Wave Velocity and Its Application to Stone Cutting with Gang Saws,” Journal of the Southern African Institute of Mining and Metallurgy, Vol. 107, 2007, pp. 427-430.
- M. Inoue and M. Ohomi, “Relation between Uniaxial Compressive Strength and Elastic Wave Velocity of Soft Rock,” Proceedings of the International Symposium on Weak Rock, Tokyo, 21-24 September 1981, pp. 9-13.
- P. Gaviglio, “Longitudinal Waves Propagation in a Limestone: The Relationship between Velocity and Density,” Rock Mechanics and Rock Engineering, Vol. 22, No. 4, 1989, pp. 299-306. doi:10.1007/BF01262285
- F. K. Boadu, “Predicting the Transport Properties of Fractured Rocks from Seismic Information: Numerical Experiments,” Journal of Applied Geophysics, Vol. 44, No. 3, 2000, pp. 103-113. doi:10.1016/S0926-9851(99)00020-8,
- S. Kahraman, “A Correlation between P-Wave Velocity, Number of Joints and Schmidt Hammer Rebound Number,” International Journal of Rock Mechanics and Mining Sciences, Vol. 38, No. 5, 2001, pp. 729-733. doi:10.1016/S1365-1609(01)00034-X
- H. T. Ozkahraman, R. Selver and E. C Isık, “Determination of the Thermal Conductivity of Rock from P-Wave Velocity,” International Journal of Rock Mechanics and Mining Sciences, Vol. 41, No. 4, 2004, pp. 703-708. doi:10.1016/j.ijrmms.2004.01.002
- E. Yasar and Y. Erdogan, “Correlating Sound Velocity with the Density, Compressive Strength and Young’s Modulus of Carbonate Rocks,” International Journal of Rock Mechanics and Mining Sciences, Vol. 41, No. 5, 2004, pp. 871-875. doi:10.1016/j.ijrmms.2004.01.012
- M. Khandelwal and P. G. Ranjith, “Correlating Index Properties of Rocks with P-Wave Measurements,” Journal of Applied Geophysics, Vol. 71, No. 2, 2010, pp. 1-5. doi:10.1016/j.jappgeo.2010.01.007
- M. Khandelwal and T. N. Singh, “Correlating Static Properties of Coal Measures Rocks with P-Wave Velocity,” International Journal of Coal Geology, Vol. 79, No. 1-2, 2009, pp. 55-60. doi.org/10.1016/j.coal.2009.01.004
- S. Kahraman, “The Correlations between the Saturated and Dry P-Wave Velocity of Rocks,” Ultrasonics, Vol. 46, No. 4, 2007, pp. 341-348. doi:10.1016/j.ultras.2007.05.003
- G. Neau, “Lamb Waves in Anisotropic Viscoelastic Plates: Study of the Wave Fronts and Attenuation,” Ph.D. Thesis, Mechanical Engineering Department, University Bordeausx, Bordeausx, 2003.
- R. A. Kline, “Measurement of Atténuation and Dispersion Using an Ultrasonic Spectroscopy Technique,” Journal of the Acoustical Society of America, Vol. 76, No. 4, 1984, pp. 498-504. doi:10.1121/1.391591
- B. Faiz, G. Maze, D. Decultot, A. Moudden, E. Aassif and M. Ezzaidi, “Ultrasonic Chacarcterization of the Quality of an Epoxy Resin Polymerization,” IEEE Transactions on Ultrasonics, Ferroelectrics, and Frequency Control, Vol. 46, No. 1, 1999, pp. 188-196. doi:10.1109/58.741532
- B. Faiz, “Contrôle Ultrasonore de la Prise en Masse d’un Yaourt et d’une Résine Epoxy,” Ph.D. Thesis, Ibn Zohr University, Agadir, 1995, pp. 89-99.
- I. N. Prassianakis, “Moduli of Elasticity Evaluation Using Ultrasound,” Insight, Vol. 39, No. 6, 1977, pp. 425-429.
- Y. Guéguen and V. Palciauskas, “Introduction à la Physique des Roches,” Editeurs des Sciences et des Arts, Herman, Paris, 1992, p. 299.
- C. Karpuz and A. G. Paşamehmetoğlu, “Field Characterization of Weathered Ankara Andesites,” Engineering Geology, Vol. 46, No. 1, 1997, pp. 1-17. doi:10.1016/S0013-7952(96)00002-6
- B. Bourbie, O. Coussy and B. Zinszner, “Acoustics of Porous Media,” Technip Editions, Paris, 1986, pp. 242-243.
- D. Royer and E. Dieulesaint, “Ondes Elastique dans les Solides, Tome 1: Propagation Libre et Guidée,” Masson, Paris, 1996, p. 308.
- P. Guy, “Contribution to the Study of Lamb Waves Propagation in Plates and Multilayered Media,” Paris University, Paris, 1992.