International Journal of Geosciences
Vol. 3 No. 4 (2012) , Article ID: 22456 , 9 pages DOI:10.4236/ijg.2012.34076
The Temporal Variability of the Freshwater Discharge and Water Levels at the Patos Lagoon, Brazil
Instituto de Matemática, Estatística e Física, Universidade Federal do Rio Grande, Rio Grande do Sul, Brazil
Email: wilianmarques@furg.br
Received March 2, 2012; revised April 6, 2012; accepted April 15, 2012
Keywords: freshwater discharge; El Niño; La Niña; wavelet analyzes
ABSTRACT
The direct influence of freshwater discharge along the coastal regions is observed in several processes following a wide spectrum on spatial and temporal variability. The knowledge of relative importance of this physical forcing is fundamental by the correct management of the coastal sites and the understanding of consequences associated with processes of climatic order is one point deserves some investigation. The major part of the studies in the Patos Lagoon, located in the southernmost part of Brazil, is limited to investigate the effects in synoptic time scales. In this way, the objective of this study is to investigate the long term variability pattern of the Patos Lagoon discharge and water levels indentifying long term trends through wavelet analysis. The results indicated that El Niño (La Niña) events promote the intensification (decrease) of the freshwater intensity in the principal river tributaries of the Patos Lagoon following scales from 16 to 120 months (from 1.3 to 10 years). The most energetic cycle is centered in periods of 64 months (5.3 years). The longer events reflect the long term response of the non linear dynamics in Equatorial Pacific changing the precipitation pattern, principally during winter and at the end of spring and early autumn. The non-linear long term trend indicates a pattern with values of discharge normally above (below) the mean after (before) 1970’s. An increasing trend starting after 1970 possibly indicates a longer term cycle influencing the interannual variability of the Patos Lagoon discharge. The seasonality is maintained in climatic monthly means obtained after and before 1970’s, but, with mean increase around 364 m3∙s−1 in freshwater discharge with reduced amplitude of the seasonal cycle.
1. Introduction
The direct influence of freshwater discharge along the coastal regions is observed in physical, chemical and geological processes [1-5, among others]. This affects the primary production stimulating the benthic re-mineralization and creating spatial patterns of production associated with the high availability of suspended matter and intense turbidity of continental waters. The intensity and temporal variability of the freshwater discharge control the water quality changing quantities and the composition of organic and inorganic properties changing the residence time of materials [6-8].
This influence is still observed controlling the residual circulation inducing spatial and temporal patterns of circulation reflected in transportation processes and stratification of the water column [9,10]. However, the study of long term influence of freshwater discharge in coastal regions is not easily carried out because time series of freshwater discharge and other properties sometimes are not available. On the other hand, the knowledge of relative importance of this physical forcing is fundamental by the correct management of the coastal sites.
The major part of the studies in the Patos Lagoon, located in the southernmost part of Brazil (Figure 1), is limited to investigate the effects of winds and freshwater discharge in synoptic time scales [11-15]. The Patos Lagoon and the adjacent continental shelf are freshwater influenced regions and some numerical modeling studies considering dynamic aspects with high resolution in space and time are presented by: [15-18]. [16] studied the physical forcing controlling the formation and behavior of the Patos Lagoon plume based on a three-dimensional hydrodynamic numerical model. [17] investigated the importance of straining and advection for the stratification evolution inside the Patos Lagoon coastal plume for each of its known physical modes using potential energy anomaly budgets. [18] investigated the contribution of the Patos Lagoon coastal plume to the deposition pattern along the inner continental shelf providing estimates of estuarine-shelf suspended sediment exchange. [15] investigated the importance of straining and advection for the stratification evolution associated with the wind driven circulation along the Patos Lagoon estuarine region
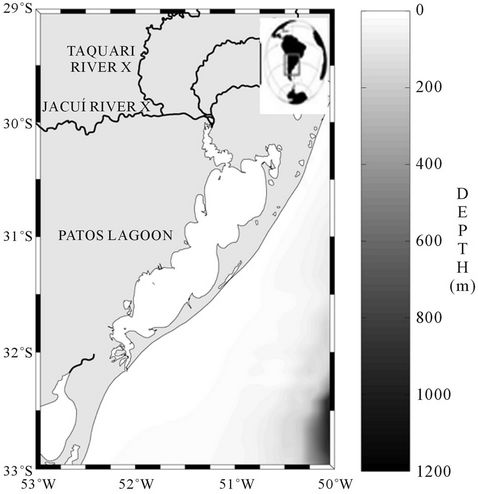
Figure 1. Patos Lagoon and its principal rivers. The measurement stations of freshwater discharge (Taquari and Jacui River) and water levels (Itapoã, Arambaré, São Lourenço e Rio Grande stations) are presented using black crosses.
using potential energy anomaly budgets.
On the other hand, studies of the long term dynamics based on the observed data are difficult to be carried out at this site because of the absence of time series for several physical parameters. However, the understanding of the consequences associated with processes of climatic order in the Patos Lagoon freshwater discharge is one point deserves some investigation because of this importance for the ecology of this area. In this way, the objective of this paper is to investigate the variability pattern of the Patos Lagoon freshwater discharge and water levels indentifying seasonal and long term trends.
The Patos Lagoon is a chocked coastal lagoon located in the south of Brazil. This lagoon has a superficial area of 10.360 km² and drains a hydrographic basin around 201.626 km². The Jacuí and Taquari are the principal rivers of this region [19] performing the principal freshwater source of the Patos Lagoon (Figure 1). The freshwater provided by these rivers performs a pattern associated with regions of temperate climate, presenting variations in inter-annual timescales [19]. Extreme events of discharge of 25.000 e 16.000 m3∙s−1 were observed by [19,20] respectively.
2. Methodology
This study is carried out using time series of freshwater discharge and water levels along the Patos Lagoon and the Southern Oscillation Index (SOI). The SOI is used in order to investigate the relationship between the occurrence of the natural phenomenon El Niño Southern Oscillation (ENSO) and the non stationary anomalies observed in the freshwater discharge of the Patos Lagoon. The SOI indicates the strength and the phase of ENSO and positive (negative) values of this index are associated with the occurrence of La Niña (El Niño) events.
Monthly mean time series of freshwater discharge and SOI covered from January 1940 to December 2006, and monthly mean time series of water levels were obtained from January 1984 to December 2002. Freshwater discharge of the Jacuí and Taquari Rivers and water level time series were obtained from the Brazilian National Water Agency (ANA: www.ana.gov.br). The Figure 1 presents the position where the observed time series were obtained and the total freshwater discharge was presented by the sum of the two tributaries cited above. The monthly mean time series of the SOI were obtained from the Australian Bureau of Meteorology (http://www.bom.gov.au). The time series obtained were used to identify the principal variability cycles, seasonal and long term trends, as well as, the changes in the seasonal pattern of discharge using wavelet analyses.
Wavelet analysis is a useful tool for analyzing time series with many different timescales or changes in variance. Therefore, the spectral content of the time series were analyzed using an adaptation of the Morlet and Mexican Hat method detailed described by [21]. According with [22] the wavelet transform can be used to analyze time series that contain nonstationary power at many different frequencies. Wavelet analysis is useful in revealing signal trends, in this way this tool was applied in order to reveal a signal hidden in noise of freshwater discharge time series. Considering that the trend is the slowest part of the signal and the signal itself includes sharp changes, then successive approximations provide a good way to visualize and quantify the long term trend associated to the original signal.
3. Results
3.1. Time Series
The monthly mean time series of freshwater discharge and SOI are presented in Figure 2. The discharge time series indicates highly variable signal composed by seasonal cycles occurring concomitantly with the annual variability and longer cycles. During the first half of these series lower peaks of freshwater discharge and less negative events of SOI are occurring suggesting a non stationary behavior along the 67 years of measurements. These time series are inversely related with some phase lag where: negative values of SOI (El Niño years) are associated with the higher discharge values. In this sense, the positive values SOI (La Niña years) are related with
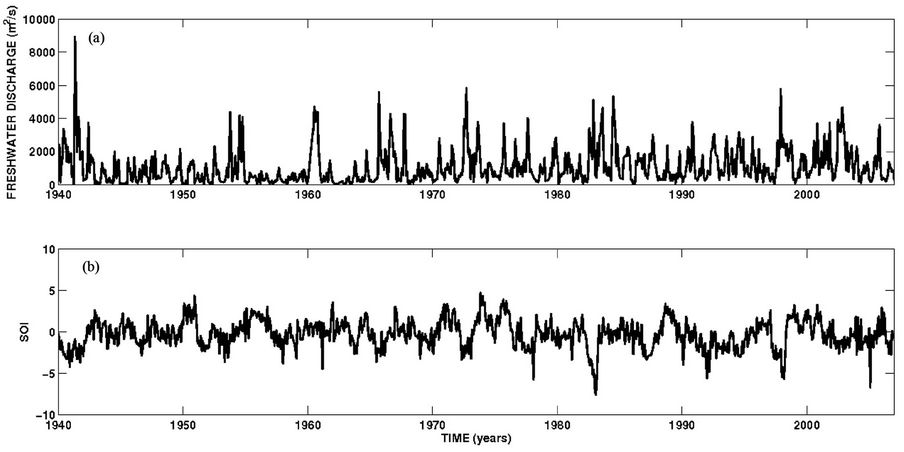
Figure 2. Freshwater discharge (Jacuí and Taquari rivers) (a) and SOI (b) time series from January 1940 to December 2006.
the lower values of the Patos Lagoon discharge. The monthly mean time series of water level along the Patos Lagoon (Figure 3) present a similar variability pattern composed by the combination of shorter (seasonal) and longer cycles. This direct relation is caused by the influence of the freshwater discharge controlling the water balance of the Patos Lagoon from few months to some years.
Minimum, maximum and mean values for freshwater discharge and the water levels along the Patos Lagoon are presented on table 1. The extreme peak of discharge occurred during spring of the 1940 year with very low discharge periods occurring during driest years. The mean value for freshwater discharge of 1.080 m3∙s−1 is obtained as long term estimate for this region. The water levels along the Patos Lagoon present a pattern with higher values occurring through the north of the lagoon. Maximum and mean values decrease from 1.65 m and 0.70 m (at Itapoã station) to 1.01 m and 0.56 m (at Rio Grande Station), respectively.
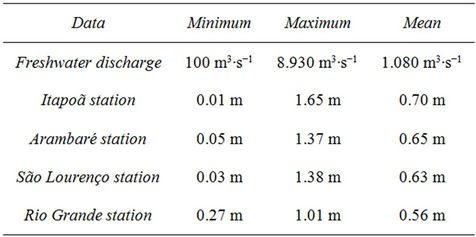
Table 1. Minimum, maximum and mean values for freshwater discharge (from January 1940 to December 2006) and water levels (from January 1985 to December 2002).
3.2. Seasonal Variability
The seasonal variability of the freshwater discharge for the principal river tributaries and the water levels along the Patos Lagoon are obtained removing the mean values from the monthly time series. The fluctuations around the mean values are summed and averaged for respective months (from January to December) that are presented using histograms and their respective standard deviations.
Monthly deviation time series for freshwater discharge (Figure 4) indicates a seasonal pattern of variability with: lower values (below the mean) occurring from the November to June (from Austral Summer to Autumn) and higher values (above the mean) occurring from July to October (from Austral Winter to Spring). Maximum (minimum) value above (below) the mean is observed for during July (January). The most intense fluctuations of freshwater discharge are observed from July to September when the maximum values are greater than the standard deviation.
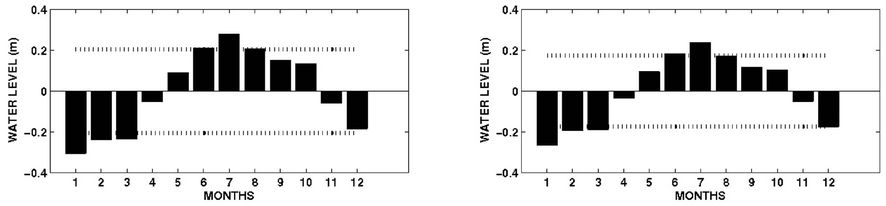
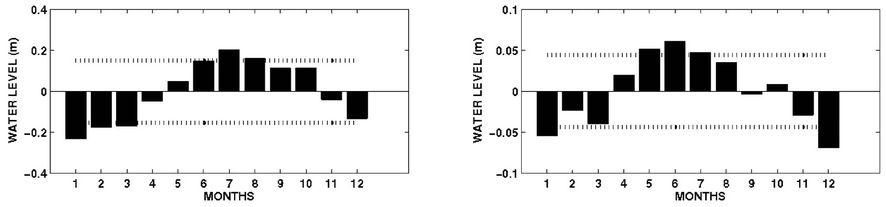
Monthly deviation time series for water levels along the Patos Lagoon (Figure 5) indicate a similar seasonal pattern of variability with: lower values (below the mean) occurring from the November to May (from Austral Summer to Autumn) and higher values (above the mean) occurring from June to October (from Austral Winter to Spring). This result suggests the importance of freshwater discharge contributing for: the circulation, the properties transportation and exchange processes of the Patos Lagoon at seasonal time scales. Maximum (minimum) values above (below) the mean are observed during July (January) along the upper part of the Lagoon (Itapoã, Arambaré and São Lourenço stations) occurring concomitantly to the freshwater fluctuations. The most intense
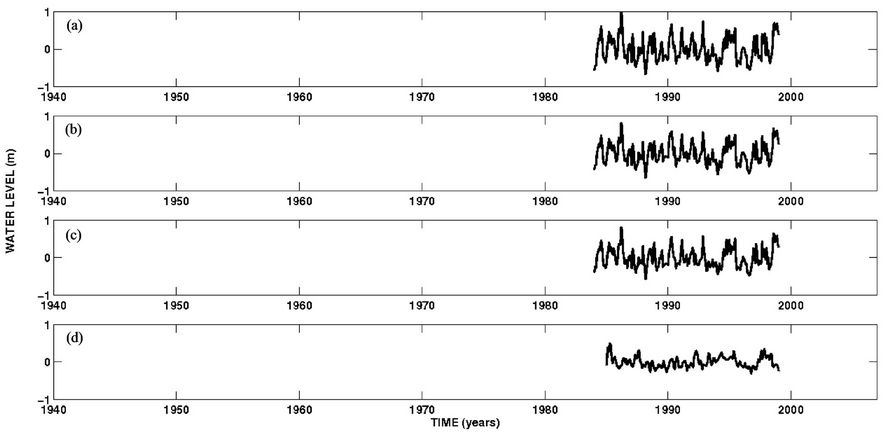
Figure 3. Water level time series along the Patos Lagoon. Itaopã station (a); Arambaré station (b); São Lourenço station (c) and Rio Grande station (d) from January 1985 to December 2002.
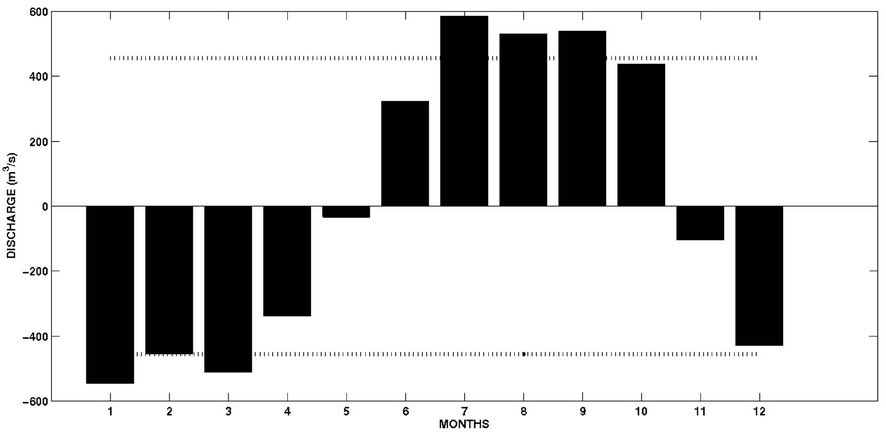
Figure 4. Monthly deviations time series of freshwater discharge for the Jacui and Taquari rivers from January 1940 to December 2006. The horizontal dashed lines indicate the standard deviation of the monthly deviation time series.
fluctuations of water levels are also observed from July to September when the maximum values of freshwater are observed. Estuarine region represented by the Rio Grande station presents a strong contribution of freshwater discharge controlling the water levels at seasonal time scales, besides the influence of the exchange processes controlled by the wind driven circulation of this region.
3.3. Long Term Variability
Time series of Patos Lagoon discharge indicates a physical system governed by a range of time scales. However, freshwater discharge signal is highly influenced by the long term variability associated with the ENSO events. In order to investigate the most important cycles influencing the Patos Lagoon discharge the wavelet analysis was carried out using Mexican Hat wavelets.
The spectral content and the correlation between the freshwater discharge and SOI time series were carried out using cross-wavelet analysis. This method locates power variations within the discrete time series over a range of scales and provides the local and the global power spectrum. The analysis of the local power spectrum (Figure 6(a)) indicated in general way two main groups of time scales controlling the freshwater discharge of the
(a) (b) (c) (d)
Figure 5. Monthly deviations time series of water levels from January 1985 to December 2002 at Itapoã (a); Arambaré (b); São Lourenço (c) and Rio Grande (d) stations. The horizontal dashed lines indicate the standard deviation of the monthly deviation time series.
(a) (c) (b)
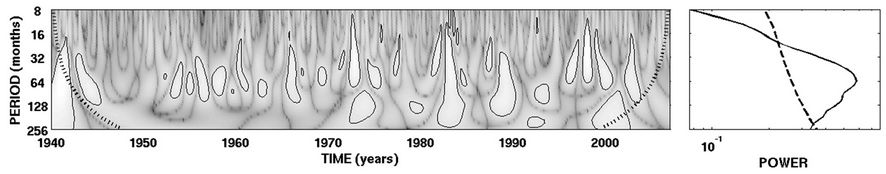
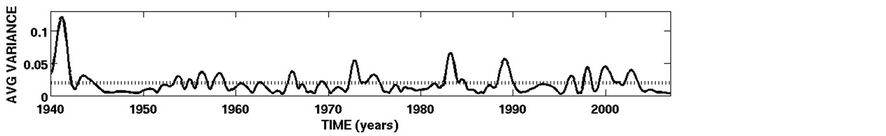
Figure 6. The local wavelet power spectrum of the freshwater discharge and SOI time series using Mexican Hat wavelet (a). Thick contour lines enclose regions of greater than 95% confidence for a red-noise process with a lag-1 coefficient of 0.25. Cross-hatched regions indicate the cone of influence where edge effects become important. Mean variance time series (b) for periods greater than 16 months and lower than lower than 120 months with the dotted line indicating the 95% confidence level. The global wavelet power spectrum (c) of the time series and the dotted line indicate the 95% confidence level.
Patos Lagoon associated with ENSO. In the first group, the events of high discharge are related to ENSO in periods between 16 and 32 months (1.3 and 2.6 years). On the other hand, in the second group (Figure 6(a)) the influence of ENSO occurs in longer inter-annual time scales between 32 and 128 months (2.6 and 10.6 years). In both group of time scales, El Niño (La Niña) events are responsible controlling the increase (decrease) of precipitation rates on the drainage basin of the Patos Lagoon.
Analysis of the local power spectrums indicated occurrence of stronger events of El Niño/high discharge in the second part of the time series (after 1970’s). The results of local power spectrum (Figure 6(a)) indicate that, normally, the ENSO events influence the precipitation rates and, consequently, the freshwater discharge as a multi-frequency process. Short scale processes combined with longer scale ones are performing a complex modulation pattern in the freshwater of this region varying from one up to few years.
The mean variance time series for periods between 16 and 128 months (Figure 6(b)) confirm the simultaneous influence of ENOS in the freshwater discharge occurring in those cycles during the whole studied period. The global power spectrum of the discharge and SOI time series (Figure 6(c)) corroborate these findings and indicate the importance of these processes combining in the different time scales to perform the complex influence of ENSO in the study region. Processes with periods between 16 and 128 months reflect the long term response of the Equatorial Pacific region dynamics presenting a most important cycle occurring around 64 months (5.3 years).
3.4. Long Term Trends of Freshwater Discharge
The ENSO events in the study region induce important long term influence in the freshwater discharge. In this way, the discrete wavelet analyzes was carried out in order to detect the overall trend of this signal. There is so much noise in the original signal therefore, its overall shape is not apparent upon visual inspection. In this level-6 analysis, we note the long term trend becomes clearer comparing with the original discharge time series (Figure 7). The mean value of 1080 m3∙s−1 was calculated for the Patos Lagoon discharge (from 1940 to 2006 year) and the non-linear long term trend indicates a pattern, with values of discharge normally below the mean value before 1970 year, and above the mean value after 1970 year (Figure 7). This result indicates an increasing trend starting after 1970 year and this can suggests the long term cycles (between 16 and 128 months) embedded into a longer cycle taking several years.
Climatic means of freshwater discharge were performed for the first half (from 1940 to 1973) and second half (from 1973 to 2006) of the study period in order to verify the non linear trend observed between 1940 and 2006 years (Figure 8). The climatic monthly means confirm the non-linear trend of increase in discharge (Figure 7), with values higher than the observed in the first half (from 1940 to 1970) for all the months. The mean difference from the first to the second period is 364 m3∙s−1 and the major differences are observed in Austral winter (from June (6) to August (8)), and from the end of spring to early of summer (November (11) and December (12)). The lower difference is observed in September, the month when normally is observed the higher values of discharge in the Patos Lagoon.
4. Discussion and Conclusions
Previous studies showed that coastal lagoons are dynamically driven by winds [23], especially when their principal axes are oriented in its dominant direction [24]. According with: [11-14], the Patos lagoon circulation pattern itself, the mixing and exchange process during low and mean discharge conditions are controlled by the wind effect at synoptic time scales coincident with the passage of meteorological systems every 3 to 17 days. In some regions around the world the influence of winds and freshwater discharge is well separated in different time scales [25].
In the Patos Lagoon, the freshwater discharge contributes considerably to the circulation pattern, mixing and exchange process, as well as, to the exportation of suspended matter and deposition pattern of suspended sediments along the adjacent coastal region in monthly, seasonal and longer time scales [15-18,26]. In longer time scales, the South America is strongly influenced by ENSO [27-30]. The most significant events of ENSO
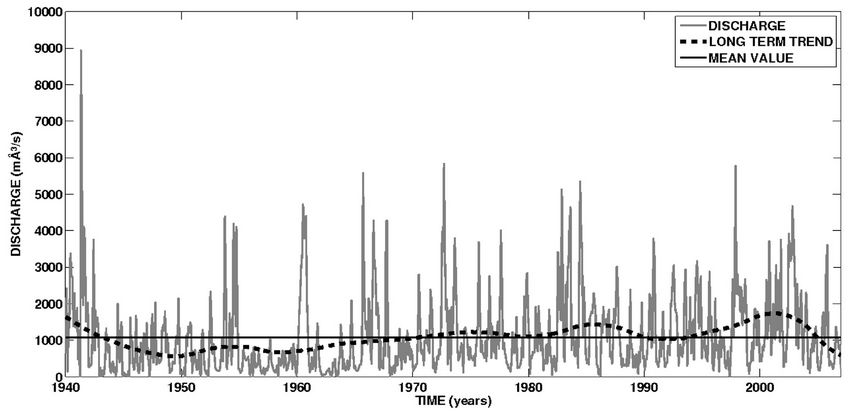
Figure 7. Freshwater discharge time series, its mean value and long term trend. The long term trend is calculated through the discrete wavelet analyzes using level-6 decomposition.
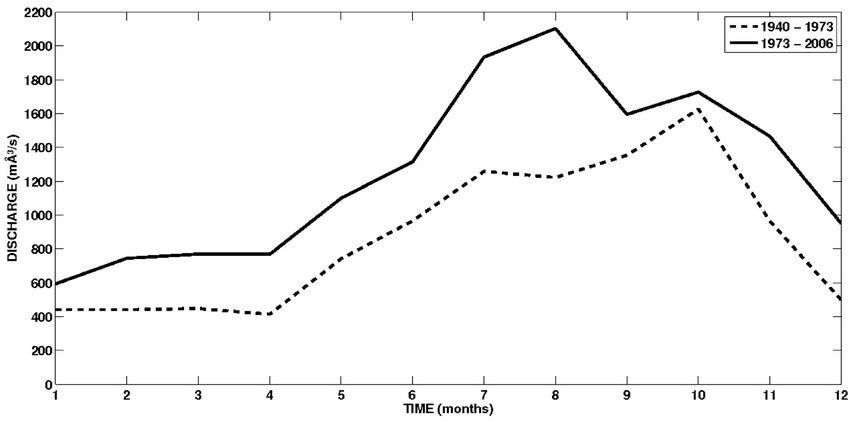
Figure 8. Climatic monthly means of freshwater discharge from 1940 to 1973 (dashed line) and from 1973 to 2006 (solid line).
present high temporal variability occurring in quasi-biennial time scales (18 - 35 months) or in lower frequentcies (32 - 88 months) [31]. [32] analyzed global fields of sea surface temperature and separated the occurrence of ENSO in inter-annual time scales and another residual with inter-decadal variability.
El Niño is the Southern Oscillation phase where the trade winds are weak, the pressure is lower over the east Tropical Pacific Ocean and higher over the west side. The south of Brasil presents anomalies of precipitation associated with the occurrence of ENSO [28,29,33]. The results presented indicated that El Niño (La Niña) events promote the intensification (decrease) of the freshwater intensity in the principal river tributaries of the Patos Lagoon following scales from 16 to 128 months (from 1.3 to 10.6 years). The most energetic cycle is centered in periods of 64 months (5.3 years). This results presents strong consistency with analyzes of SOI and corroborate other results found previously by several authors in south of South America. [34] verified that El Niño events intensified the discharge of the Negro and Paraná Rivers in inter-annual time scales (cycles between 3.5 and 6 years). [35] associated the peaks of freshwater discharge of the Uruguay River in time scales from 3.5 to 6 years to the ENSO influence.
[34] found a cycle around 9 years as component of variability of time series in Paraguay and Paraná rivers. This authors associated the high discharge in this time scales with low temperatures in the North Atlantic Ocean observing that this component is strong during summer. Negative anomalies of sea surface temperature in the tropical North Atlantic Ocean during summer are associated with the intensification of northeasterly winds and some displacement to the south of the Inter-tropical Convergence Zone in ENSO time scales [36,37]. This is still associated with the linear tendencies observed between 1951-1990 years [38]. [39] suggested that a possible way of influence of the tropical North Atlantic circulation in south of South America is through the decadal cycle of the summer monsoon system, and by the southward flux associated with the low level jet along the east part of Andes.
The influence of ENSO increasing (decreasing) the intensity of freshwater discharge in the Patos Lagoon reflects the complex processes combining different time scales simultaneously, in period varying from few months to several years. The longer events reflect the long term response of the non linear dynamics in Equatorial Pacific region that changes the precipitation pattern of the hydrographic basin, principally during winter and from the end of spring to early autumn. [28] verified that all regions of south of South America have consistent wet anomalies during austral spring of the warm event year (El Niño year), with pronounced peak in November. [28] verified that southeastern part of South America also shows a consistent tendency to higher than average rainfall during the Austral winter of the following year.
The mean value of 1080 m3∙s−1 was obtained for the Patos Lagoon discharge from 1940 to 2006 year, and the non-linear long term trend indicates curious pattern with values of discharge normally above (below) the mean after (before) 1970’s. This result indicates an increasing trend starting after 1970, however, this indicates the influence of a longer term cycle influencing the interannual variability of the Patos Lagoon discharge. The seasonality is maintained in climatic means obtained after and before 1970’s. The mean increase is around 364 m3∙s−1 from the first to the second period and the amplitude of the seasonal cycle is reduced. Normal periods of high discharge as Austral winter and the end of spring present major increase of precipitation/discharge associated with the most intense El Niño events occurring after 1970. The major difference is during the Austral summer in the region that was become wetter in the second part of the study period. Recent increasing trends in streamflow of rivers in southeastern South America were verified by [40]. These authors verified a similar pattern of increasing trends for the Paraná, Paraguay and Uruguay rivers after 1970 year with decrease in the amplitude of the seasonal cycle of that region.
5. Acknowledgements
The author is grateful to the Fundação de Amparo à Pesquisa do Estado do Rio Grande do Sul (FAPERGS) for sponsoring this research under contract: 1018144. Further acknowledgments go to Brazilian National Water Agency (ANA) for supplying the fluvial discharge and for the Australian Bureau of Meteorology for supplying the SOI data set to accomplish this work.
REFERENCES
- J. R. Schubel and D. W. Pritchard, “Responses of Upper Chesapeake Bay to Variations in Discharge of the Susquehanna River,” Estuaries, Vol. 9, No. 4, 1986, pp. 236- 249. doi:10.2307/1352096
- T. A. Denes and J. M. Caffrey, “Changes in Seasonal Water Transport in a Louisina estuary, Forleague Bay, Louisiana,” Estuaries, Vol. 11, No. 3, 1988, pp. 184-191. doi:10.2307/1351971
- T. Yanagy, “Currents and Sediment Transport in the Seto Inland Sea, Japan,” In: R. T. Cheng, Ed., Residual Currents and Long-Term Transport (Coastal and Estuarine Studies), Springer Verlag, New York, 1990, pp. 348-355.
- R. J. Uncles and J. A. Stephens, “Buoyancy Phenomena in the Tweed Estuary,” Buoyancy Effects on Coastal and Estuarine Dynamics (Coastal and Estuarine Studies), 1996, pp. 175-193.
- J. Dronkers, “The Influence of Buoyancy on Transverse Circulation and on Estuarine Dynamics,” Buoyancy Effects on Coastal and Estuarine Dynamics (Coastal and Estuarine Studies), 1996, pp. 341-356.
- L. A. Cifuentes, L. E. Schemel and J. H. Sharp, “Qualitative and Numerical Analyses on the Effects of River Inflow Variations on Mixing Diagrams in Estuaries,” Estuarine, Coastal and Shelf Science, Vol. 30, No. 4, 1990, pp. 411-427. doi:10.1016/0272-7714(90)90006-D
- I. Grabemann, H. Kühle, B. Kunze and A. Müller, “Studies on Transport Times and Water Quality in the Weser Estuary (Germany),” Mixing in Estuaries and Coastal Seas, (Coastal and Estuarine Studies), American Geophysical Union, Washington, 1996, pp. 291-302.
- P. H. Doering and R. H. Chamberlain, “Water Quality and Source of Freshwater Discharge to the Caloosahatchee Estuary, Florida,” Journal of the American Water Resources Association, Vol. 35, No. 4, 1999, pp. 793-805. doi:10.1111/j.1752-1688.1999.tb04175.x
- D. A. Jay, “Residual Circulation in Shallow Estuary: Shear, Stratification and Transport Processes,” In: R. T. Cheng, Ed., Residual Currents and Long-Term Transport. Coastal and Estuarine Studies, Springer Verlag, New York, 1990, pp. 49-78.
- A. Y. Kuo, J. M. Hamrick and G. M. Sisson, “Persistence of Residual Currents in the James River Estuary and Its Implication to Mass Transport,” In: R. T. Cheng, Ed., Residual Currents and Long-Term Transport. Coastal and Estuarine Studies, Springer Verlag, New York, 1990, pp. 389-402.
- O. O. Möller, J. A. Lorenzzetti, J. L. Stech and M. M. Mata, “The Patos Lagoon Summertime Circulation and Dynamics,” Coastal Shelf Research, Vol. 16, 1996, pp. 335-351.
- O. O. Möller, P. Castaing, J. C. Salomon and P. Lazure, “The Influence of Local and Non-Local Forcing Effects on the Sub Tidal Circulation of Patos Lagoon,” Estuaries, Vol. 24, No. 2, 2001, pp. 297-311. doi:10.2307/1352953
- E. H. L. Fernandes, K. R. Dyer, O. O. Möller and L. F. H. Niencheski, “The Patos Lagoon Hydrodynamics during an El Niño Event (1998),” Continental Shelf Research, Vol. 22, No. 11-13, 2002, pp. 1699-1713. doi:10.1016/S0278-4343(02)00033-X
- E. H. L. Fernandes, K. R. Dyer and O. O. Möller, “Spatial Gradients in the Flow of Southern Patos Lagoon,” Journal of Coastal Research, Vol. 21, No. 4, 2005, pp. 759-769.
- W. C. Marques, E. H. Fernandes and L. A. O. Rocha, “Straining and Advection Contributions to the Mixing Process of the Patos Lagoon Estuary Brazil,” Journal of Geophysical Research, Vol. 116, 2011, 11 p. doi:10.1029/2010JC006524,2011
- W. C. Marques, E. H. Fernandes, I. O. Monteiro and O. O. Möller, “Numerical Modeling of the Patos Lagoon Coastal Plume, Brazil,” Continental Shelf Research, Vol. 29, No. 3, 2009, pp. 556-571. doi:10.1016/j.csr.2008.09.022
- W. C. Marques, E. H. Fernandes and O. O. Möller, “Straining and Advection Contributions to the Mixing Process of the Patos Lagoon Coastal Plume, Brazil,” Journal of Geophysical Research, Vol. 115, 2010, 23 p. doi:10.1029/2009JC005653,2010
- W. C. Marques, E. H. Fernandes, B. C. Moraes, O. O. Möller and A. Malcherek, “The Dynamics of Patos Lagoon Suspendeds Sediment Plume and Its Contribution for the Deposition Pattern in the Southern Brazilian Inner Shelf,” Journal of Geophysical Research, Vol. 115, 2010, 22p. doi:10.1029/2010JC006190
- W. C. Marques and O. O. Möller, “Variabilidade Temporal Em Longo Período da Descarga Fluvial e Níveis de Água da Lagoa dos Patos, Rio Grande do Sul, Brasil,” Revista Brasileira de Recursos Hídricos, Vol. 13, 2009, pp. 155-163.
- M. Rocherfort, “Rapports Entre la Pluviosité et l’Écoulement dans le Brasil Subtropical et le Brasil Tropical Atlantique,” Travaux et Mémoires de l’Institu des Hautes Etudes de l’Amérique Latine, Paris, France, 1958.
- C. Torrence and G. P. Compo, “A Practical Guide to Wavelet Analysis,” Bulletin of the American Meteorological Society, Vol. 79, 1998, pp. 61-78.
- I. Daubechies, “The Wavelet Transform Time-Frequency Localization and Signal Analysis,” IEEE Transactions on Information Theory, Vol. 36, No. 5, 1990, pp. 961-1004. doi:10.1109/18.57199
- B. Kjerfve, “Coastal Lagoons,” In: B. Kjerfve, Ed., Coastal Lagoon Processes, Elsevier Oceanographic Series 60, Amsterdam, 1994, pp. 1-8.
- N. P. Smith, “Water, Salt and Heat Balance of Coastal Lagoons,” In: B. Kjerfve, Ed., Coastal Lagoon Processes, Elsevier Oceanography Studies, Amsterdam, 1994, pp. 69-101.
- W. W. Schroeder, S. P. Dinnel and W. J. Wiseman Jr., “Salinity Stratification in a River-Dominated Estuary,” Estuaries, Vol. 13, No. 2, 1990, pp. 145-154.
- W. C. Marques, “Estudo da Dinâmica da Pluma Costeira da Lagoa dos Patos,” Unpublished Ph.D. Thesis, Universidade Federal do Rio Grande, Rio Grande do Sul, 2009.
- R. Allan, J. Lindesay and D. Parker, “El Niño Southern Oscillation and Climate Variability,” National Library of Australia Cataloguing-in-Publication Entry, Canberra, 1996.
- A. M. Grimm, S. E. T. Ferraz and G. Julio, “Precipitation Anomalies in Southern Brazil Associated with El Niño and La Niña Events,” American Meteorological Society, Vol. 11, No. 11, 1998, pp. 2863-2879.
- A. M. Grimm, V. R. Barros and M. E. Doyle, “Climate Variability in Southern South America Associated with El Niño and La Niña Events,” American Meteorological Society, Vol. 13, No. 1, 2000, pp. 35-57.
- M. D. Dettinger, D. S. Battisti, G. J. Mccabe, C. M. Bitz and R. D. Gerreaud, “Interhemispheric Effects of InterAnnual and Decadal ENSO-Like Climate Variations on the Americas,” In: V. Markgref, Ed., Interhemispheric Linkages, Academic Press, London, 2001, pp. 1-16.
- E. M. Rasmusson, X. Wang and C. F. Ropelewski, “The Biennial Component of ENSO Variability,” Journal of Marine Systems, Vol. 1, No. 1-2, 1990, pp. 71-96. doi:10.1016/0924-7963(90)90153-2
- Y. Zhang, J. M. Wallace and D. S. Battisti, “ENSO-Like Interdecadal Variability: 1900-93,” Journal of Climate, Vol. 10, No. 5, 1997, pp. 1004-1020. doi:10.1175/1520-0442(1997)010<1004:ELIV>2.0.CO;2
- A. Montecinos, A. Diaz and P. Aceituno, “Seasonal Diagnostic and Predictability of Rainfall in Subtropical South America Base on Tropical Pacific SST,” Journal of Climate, Vol. 13, No. 4, 2000, pp. 746-758.
- A. W. Robertson and C. R. Mechoso, “Interannual and Decadal Cycles in River Flows of Southeastern South America,” Journal of Climate, Vol. 11, No. 10, 1997, pp. 2570-2581. doi:10.1175/1520-0442(1998)011<2570:IADCIR>2.0.CO;2
- C. M. Krepper, N. O. Garcia and P. D. Jones, “Interannual Variability in the Uruguay River Basin,” International Journal of Climatology, Vol. 23, No. 1, 2003, pp. 103-115. doi:10.1002/joc.853
- S. Hastenrath, L. C. De Castro and P. Aceituno, “The Southern Oscillation in the Tropical Atlantic Sector,” Contributions to Atmospheric Physics, Vol. 60, 1987, pp. 447-463.
- P. Aceituno, “On the Functioning of the Southern Oscillation in the South American Sector. Part I: Surface Climate,” Monthly Weather Review, Vol. 116, No. 3, 1988, pp. 505-524.
- R. G. Wagner, “Decadal-Scale Trends in Mechanisms Controlling Meridional Sea Surface Temperature Gradients in the Tropical Atlantic,” Journal of Geophysical Research, Vol. 101, No. C7, 1996, pp. 16683-16694. doi:10.1029/96JC01214
- J. Nogués-Paegle and K. C. Mo, “Alternating Wet and Dry Conditions over South America during Summer,” Monthly Weather Review, Vol. 125, No. 2, 1997, pp. 279- 291. doi:10.1175/1520-0493(1997)125<0279:AWADCO>2.0.CO;2
- J. L. Genta, G. Perez-Iribarren and C. R. Mechoso, “A Recent Increasing Trend in the Streamflow of Rivers in Southeastern South America,” Journal of Climate, Vol. 11, No. 11, 1997, pp. 2858-2862. doi:10.1175/1520-0442(1998)011<2858:ARITIT>2.0.CO;2