Journal of Minerals and Materials Characterization and Engineering
Vol.02 No.03(2014), Article ID:46367,10 pages
10.4236/jmmce.2014.23029
Effects of Pressure on the Mechanical Properties and Microstructure of Die Cast Aluminum A380 Alloy
Kenneth N. Obiekea*, Shekarau Y. Aku, Danjuma S. Yawas
Department of Mechanical Engineering, Ahmadu Bello University, Zaria, Nigeria
Email: *kenwood822002@yahoo.com
Copyright © 2014 by authors and Scientific Research Publishing Inc.
This work is licensed under the Creative Commons Attribution International License (CC BY).
http://creativecommons.org/licenses/by/4.0/


Received 2 January 2014; revised 17 February 2014; accepted 7 March 2014
ABSTRACT
In this paper, the mechanical properties and microstructure of die cast aluminium A380 alloy casts produced under varying pressure was investigated experimentally and compared. The results obtained show better mechanical properties i.e. hardness, tensile strengths and impact strengths in the die cast A380 alloy sample that solidified at high pressure when pressure was regulated across five samples of the castings. The hardness of the die cast A380 samples that solidified under different applied pressures varied from 76 to 85 HRN. Also tensile strength, yield strength and elongation of the samples showed an increase with increased pressure. Also the results of SEM and metallography show that at high pressure, structural changes occurred as a fine microstructure was obtained with increase of pressure.
Keywords:
A380 Alloy, Die Casting, Microstructure, Pressure

1. Introduction
Casting processes are among the oldest methods for manufacturing metal goods. In most early casting processes (many of which are still used today), the mold after use is commonly collapsed in order to remove the product after solidification. The need for a permanent mold, which can be used to produce components in large volume quantities which are of high quality, is the obvious alternative. In the middle ages, craftsmen perfected the use of iron in the manufacture of mould [1] . Moreover, the first information revolution occurred when Johannes Gutenberg developed a method to manufacture components in large quantities using a permanent metal mold. Over
the centuries, the permanent metal mold processes continued to evolve. In the late 18th century processes were developed in which metal was injected into metal dies under pressure to manufacture print type production. These developments culminated in the creation of the linotype machine for printing by Ottmar Mergenthaler in 1885, an automated type casting device which became the prominent type of equipment in the publishing industry which led to creation of a die cast machine. Researchers like Adler et al. [2] investigated porosity defects in aluminium cast materials, and used volumetric analysis to identify gas porosity defects. They studied the effect of backscatter in their work on the ultrasonic inspection of aluminium cast materials, similarly Dahle et al. [3] conducted experiments on the effects of pressure on density and porosity in an aluminum cast by applying pressure to the riser in a permanent mold (die) and found a flat distribution this time of density rather than porosity, was observed with the pressurized riser. Dargusch et al. [4] determined the effects of process variables on the quality of high pressure die cast components with the aid of in-cavity pressure sensors. In particular, the effects of set intensification pressure, delay time, and casting velocity were investigated and in turn the effect of variations in these parameters on the integrity of the final part, porosity was found to decrease with increasing intensification pressure and increase with increasing casting velocity, and then Zhu et al. [5] conducted experiments and simulations on the effect of pressure on porosity in cast A356. The alloy was melted under vacuum and pressure was applied in the ceramic mould and found that an increase in pressure reduces the amount of porosity and that the pore size distribution was shifted to smaller pores as pressure increased. Ming et al. [6] conducted experiments on the effect of pressure on the mechanical properties and microstructure of Al-Cu-based alloy prepared by squeeze casting and concluded that hardness, tensile strength and ductility of ZA27 squeezed casting are greatly affected by applied pressure and primary reaction is promoted in squeeze cast ZA27 alloy that solidified at high pressure and a fine microstructure is obtained with the increase of pressure and Wei et al. [7] investigated microstructures and properties of die casting components with various thicknesses made of AZ91D alloy by means of a scanning electron microscope (SEM), transmission electron microscope (TEM), high-reso- lution transmission electron microscope (HRTEM), etc. It was concluded that mechanical properties of the die casting components mainly depend on grain size of Mg phase. Chiang et al. [8] proposed mathematical models for the modelling and analysis of the effects of machining parameters on the performance characteristics in the HPDC process of Al-Si alloys which were developed using the response surface methodology (RSM) to explain the influences of three processing parameters (die temperature, injection pressure and cooling time) on the performance characteristics of the mean particle size (MPS) of primary silicon and material hardness (HBN) value. The experiment plan adopts the centered central composite design (CCD).
The separable influence of individual machining parameters and the interaction between these parameters were also investigated by using analysis of variance (ANOVA). With the experimental values up to a 95% confidence interval, it was fairly well for the experimental results to present the mathematical models of both the mean particle size of primary silicon and its hardness value. Two main significant factors involved in the mean particle size of primary silicon were the die temperature and the cooling time. The injection pressure and die temperature also have statistically significant effects on microstructure and hardness. Li et al. [9] conducted experiments on the effects of specific pressure on microstructure and mechanical properties of squeeze casting of ZA27 alloy and concluded that Hardness, tensile strength and ductility of ZA27 squeezed casting with high height-to-thickness ratio are greatly affected by applied pressure and that Al and Cu elements are homogeneously distributed in matrix of squeeze cast ZA27 alloy. Although many researchers have carried out other works on squeeze casting of Al alloys [8] [10] - [19] , however little work has been reported on die casting of A380 alloy with varying applied pressure.
2. Materials and Methods
2.1. Materials
The material used in this work was aluminum A380 alloy (mostly used in aeronautics).
The chemical composition of the alloy as revealed by X-ray fluorescence test is summarized in the Table 1.

Table 1. Chemical composition of aluminum A380 alloy.
2.2. Pouring and Melting
Aluminum A380 alloy was melted in an electric furnace of capacity 500 kg available at the scientific and equipment development institute, (SEDI) Enugu, Nigeria at a temperature of 720˚C.
2.3. Pressure Application
500 ton Cold chamber die casting machine available at the scientific and equipment development institute, (SEDI), Enugu, Nigeria was used to cast the samples. The pressure was increased five times by the pressure regulating valve on the die cast machine and five samples of the alloy were cast separately. The machine was operated at standard operating conditions except the pressure which was 0, 350, 700, 1050, and 1400 kg/cm2.
2.4. Dies for Experiment
Dies used for the casting of top cylinders of vulcanizing machine available at the Scientific and Equipment Development Institute (SEDI) Enugu were used to cast the samples and specimen were cut from them for mechanical tests and microstructure analysis.
Five series of castings were done under different applied pressure and only one sample for each pressure variation was cast for each series owing to the fact that die castings produces near perfect castings with little or no machining needed and parts that are durable and dimensionally stable, while maintaining close tolerances. The cast samples after casting are shown in Figure 1 below.
2.5. Modeling
Regression analysis is used to establish relationship between two variables. The response variable y is the independent variable or variable of interest, and the predictor variable x is the independent variable. An objective of regression analysis was to develop a regression model, relating y to x that can be used to predict values of the response variable. The single factor regression was carried out using the regression line equation
 (1)
(1)
The canstants a and b can be calculated from the expressions:
 (2)
(2)
 (3)
(3)

Figure 1. A380 castings with varying pressure.
And the multiple factor regression was carried out using the multiple regression equation
 (4)
(4)
where the equations for the constants are
 (5)
(5)
 (6)
(6)
 (7)
(7)
3. Results and Discussions
3.1. Hardness Test
The hardness values were measured using the Rockwell hardness testing machine (model AVERY 6402 England), available at the workshop of the Science and Technology Complex (SHEDA) Abuja, Nigeria. The indents formed were measured on B scale with a minor load of 10 kg, major load of 100 kg but before the hardness test, the surfaces of the samples were cleaned thoroughly by removing dirt, scratches and oil.
The results obtained from the hardness tests on the cast samples are represented in the chart below (Figure 2).
The results show that hardness increased from 77 to 86 HRN with increased applied pressure similar to work by Ming et al. [6] . The standard deviation was found to be S = 3.00666. The hardness will follow this regression equation model:
 (8)
(8)
where P is pressure.
3.2. Tensile Test
The specimen bars produced from the samples were subjected to tensile tests in accordance with the ASTM E8 standard test method for tension testing of metallic materials using a Hounsfield tensiometer with maximum load of 500 KN available at the workshop of the Science and Technology Complex (SHEDA) Abuja, Nigeria. The test specimen size was 100.4 mm length and gauge length of 45 mm was marked on the samples. The specimen were mounted by their ends into the holding grips of the testing machine and locked securely. The machine then elongated the specimen at constant rate and at the same time the instantaneous load applied was measured using an extensometer and recorded. The results obtained from the tensile tests on the cast samples are represented in the charts below (Figure 3).
The result shows increase in the tensile strength and elongation with increased applied pressure similar to work by Li et al. [9] . The standard deviation was found to be S = 13.18484. The tensile strength will follow this regression equation model:
 (9)
(9)
where P is pressure.

Figure 2. Variation of hardness with varying pressure for A380 alloy castings.
 (a)
(a) (b)
(b)
Figure 3. (a) Variation of Tensile strength with varying pressure for A380 alloy castings; (b) variation of Elongation with varying pressure for A380 alloy castings.
Yield Strength Result
The results of the yield strength obtained from the tensile tests on the cast samples are represented in the chart below (Figure 4).
The result also shows that pressure had a similar effect on the yield stress as it did to the tensile strength as chart shows that as pressure was increased from of 0 kg/cm2 to 1400 kg/cm2, yield strength increased from 161 to 176 MPa also similar to work by Li et al. [9] . The standard deviation was found to be S = 5.23832. The yield strength will follow this regression equation model:
 (10)
(10)
where P is pressure.
3.3. Impact Test Results
The impact tests of the samples were conducted using the Avery Denison test machine available at the workshop of the Science and Technology Complex (SHEDA) Abuja, Nigeria. Impact tests of the samples of both alloys were carried out using the charpy V notch test method. All specimen were notched at the centre to about 2 mm depth with a root radius of 0.25 mm at angle of 45˚ according to the standard of the machine used. Impact tests conducted for each sample were in accordance with ASTM E23 “standard method for notched bar impact testing of metallic materials”. The expended energy was measured and recorded for each specimen. The results obtained from the impact strength tests on the cast samples are represented in the chart below (Figure 5).
The result shows the impact strength improving with increased applied pressure across the five samples. The standard deviation was found to be S = 0.15448. The impact strength follows this regression equation model:
 (11)
(11)
where P is pressure.

Figure 4. Variation of yield strength with varying pressure for A380 alloy castings.

Figure 5. Variation of impact strength with varying pressure for A380 alloy castings.
4. Metallographic Examination
Microstructures of the samples were investigated by means of a scanning electron microscope available at the physics laboratory at Science and Technology Complex (SHEDA) Abuja and the metallurgical microscope available at metallurgy laboratory available at the Federal University of Technology Minna, Nigeria.
Preparation of the samples for micro examination involved mainly sampling, polishing and etching. Samples measuring 26 mm × 15 mm × 5 mm were cut from the castings with the help of a hacksaw. The samples were filed and ground. Grinding was done in succession on a bench grinder using silicon carbide abrasive papers of 220-, 320-, 400-, and 600-grit, the samples were polished in the usual manner with final polishing being carried out by hand, and they were etched in aqueous solution containing 2.5% HNO3, 1.5% HCL and 1% HF acid (etched with Keller’s reagent) for 20 to 60 seconds. Etching was done to make visible the grains of the samples under different pressures conditions.
4.1. Scanning Electron Microscope Analysis (SEM)
Microstructures of the samples were investigated by means of a scanning electron microscope (SEM) available at the physics laboratory at Science and Technology Complex (SHEDA) Abuja. Samples after preparation were placed to the multi-stub sample holder by the help of double sided conductive aluminum tape and mounted unto the sample chamber and an electron gun switched on which passed an accelerating voltage of 20 KV and probe current of 227 Pa through the samples at a working distance of 6.0 mm. SEM was done to make visible porosity pores across the microstructures of the samples under the different pressure conditions.
4.2. Number of Grains
The numbers of grains were determined using the fully automated metallurgical microscope available at the metallurgy laboratory of the Federal University of Technology, Minna which does digital image analysis and measures number of grains of the specimen area per square inch and the result were recorded for each sample.
The numbers of grains were determined and presented as seen above in Figure 6. The results show an in-
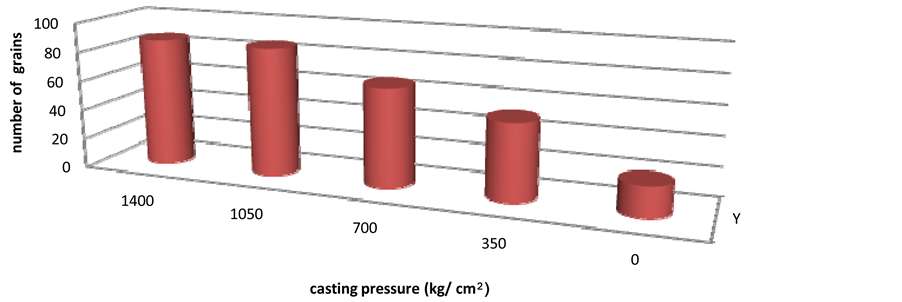
Figure 6. Variation of number of grains with varying pressure for A380 alloy castings.
crease in the number of grains with increased applied pressure as the most number of grains were obtained at 1400 kg/cm2 similar to work by Wei et al. [7] . The standard deviation was found to be S = 24.8. The number of grains will follow this regression equation model:
 (12)
(12)
4.3. Grain Size
The grain size of the samples as presented in Figure 7 shows a fine grain size with increased applied pressure and bigger grain sizes were obtained with the low pressure samples similar to work by Wei et al. [7] . The standard deviation was found to be S = 1.72047. The grain size follows this regression equation model:
 (13)
(13)
where P is pressure.
5. Porosity Measurement
From the results obtained for the number of grains and grain size in the samples of A380 alloy, an analogy was deduced and porosity levels were predicted in relation to the number of grains and grain size of the cast samples. The relation shows lower porosity levels at finer grain sizes and more number of grains. This result agrees with work carried out by Dargusch et al., [4] .
The regression was carried out using the multiple regression equation

where Y = porosity, X1 = grain size and X2 = number of grains. The porosity follows this regression equation model:
 (14)
(14)
6. Microstructure Analysis
The microstructures of the samples of A380 alloy at different pressures consisted of a primary α phase (Al), peritectic β phase (FeSiAl5) and ternary eutectic (β + η + ε) (Al2Cu) where α phases solidified as coarse grains (Figure 8). The primary α phases became finer in higher pressure (seen in Figure 9 and Figure 10) and with the increase of pressure, the microstructure became finer when the pressure reached 1400 kg/cm2 (see Figure 9).
In the lower pressure samples, scanty grains were seen and were not homogeneously distributed (Figure 8), also the eutectic structure (β + η + ε) was not found in the samples at 1400 kg/cm2, while the hypo-eutectic (η + ε) phases appeared between grains (Figure 9). In the solidification process, the primary phase α precipitates first from liquid phase and then the peritectic reaction follows. However, at high pressure, the degree of these two

Figure 7. Variation of grain size with varying pressure for A380 alloy castings.

Figure 8. SEM (scanning electron microscope) and DEM (digital electron microscope) of A380 alloy cast with absolute injection pressure.
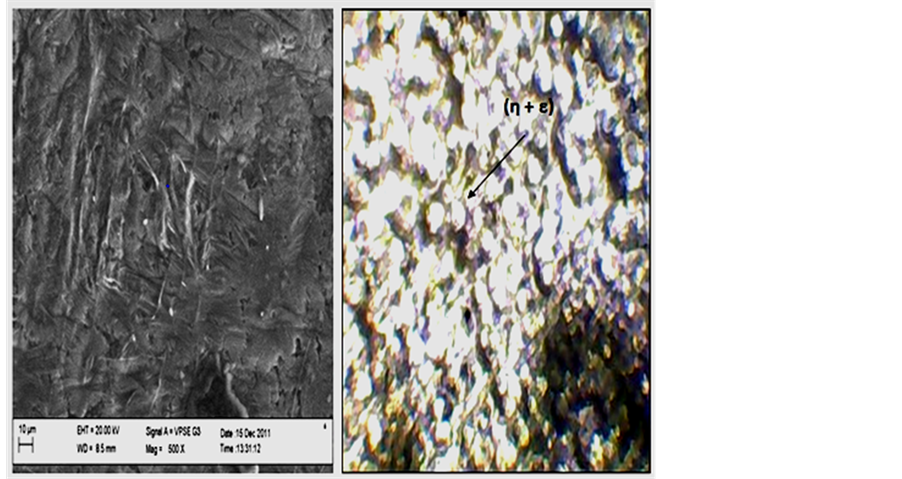
Figure 9. SEM (scanning electron microscope) and DEM (digital electron microscope) of A380 alloy cast with injection pressure of 1400 kg/cm2.

Figure 10. SEM (scanning electron microscope) and DEM (digital electron microscope) of A380 alloy cast with injection pressure of 700 kg/cm2.
reactions becomes greater due to the fact that the eutectic point moves to the direction of rich Al, thus the quan- tity of remaining liquid phase is reduced greatly. On the other hand, because the melting points are elevated at high pressure, the degree of super-cooling increases, thus the nucleate rate of primary reaction increases largely during solidifying. This is also the reason of microstructure refining. In addition, the remaining phase is in deep super-cooling state when temperature is dropped to the eutectic point.
Therefore the improvement of mechanical properties was attributed to eliminating of micro-pores caused by higher pressure. On the other hand, it is because of the microstructure refining as the applied pressure is increased as seen below that increased tensile strength and hardness are attributed. From the above results, it can be deduced that the eutectic reaction was restrained while the primary reaction was promoted at higher pressure. This viewpoint agrees with other works [5] -[7] .
In Figure 9, almost 95 percent of grains occupy the micrograph showing fine grain sizes. The much concentrated grains were cohesively arranged and evenly distributed due to good compatibility of the grain structures which is absolutely, evenly distributed in an attractive manner and perfectly embedded with one another. The improvement of mechanical properties is attributed to eliminating of micro-pores in the alloy caused by applied pressure and this is because of the microstructure refining as the applied pressure is increased as mentioned above.
In Figure 11, the micrograph shows spherical dimples characteristics of grain types which are still shown occupying almost 85 percent the micrograph showing also fine grain sizes and also the much concentrated grains were cohesively arranged and evenly distributed also due to good compatibility of the grain structures. The improvement of mechanical properties is attributed to eliminating of micro-pores in the alloy caused by applied pressure.
In Figure 10, microstructure shows the much concentrated grains are cohesively arranged and evenly distributed, also almost 75 percent of grains occupy the micrograph showing not very fine grains.
In Figure 12, the micrograph shows spherical dimples characteristic of grain type and almost 70 percent of grains occupy the micrograph showing big grain sizes. It was also clearly shown that the grains were scanty because of bigger grain sizes that depict porosity susceptibility over time.
In Figure 10, it is seen that the grains are very scanty, also the regions at which grains occupies was lower than 50 percent showing presence of bigger grain sizes. The micrograph also shows deformation that is worsened and the degree of deformation so great. The microstructure clearly shows obvious porosity in the sample that solidified at low pressure.

Figure 11. SEM (scanning electron microscope) and DEM (digital electron microscope) of A380 alloy cast with injection pressure of 1050 kg/cm2.

Figure 12. SEM (scanning electron microscope) and DEM (digital electron microscope) of A380 alloy cast with injection pressure of 350 kg/cm2.
7. Conclusions
From the results of this research, the following conclusions can be drawn:
Hardness values increased from 76 to 85 HRN as applied pressure was increased from 0 to 1400 kg/cm2. This justifies our expected outcome.
Number of grains increased from 20.31 to 87.05 g/a2 as applied pressure was raised from zero pressure to 1400 kg/cm2.
Tensile strength, yield strength and elongation increased with increased applied pressures.
The impact strength was also increased with increase in applied pressure from 3.93 to 4.39 joules as pressure was raised from zero to 1400 kg/cm2.
The microstructures obtained in the A380 alloy cast with 1400 kg/cm2 pressure show that the eutectic reaction was restrained, and the final solidified structure was (η + ε) phases instead of eutectic phase (β + η + ε). Also the primary solid reaction (α) was promoted and a finer microstructure was obtained.
The micrographs of the A380 alloy casts show different morphologies distributed across the samples under the varying applied pressure as fine grains which were seen homogenously distributed across the micrograph of the sample that was cast with 1400 kg/cm2 pressure, can effectively block the movement of dislocation, and increase the strength and plasticity.
The microstructures also show structure changes due to applied pressure as some appeared granular, lamellar, coarse etc. It was also seen that porosity susceptibility was lower in the sample that solidified at high pressures due to finer grain sizes.
References
- Doehler, H. (1951) Die Casting. McGraw Hill Book Company, New York.
- Adler, L., Nagy, P.B., Rypien, D.V. and Rose, J.H. (1989) Ultrasonic Evaluation of Porosity in Aluminium Cast Materials. Ohio State University, Columbus.
- Dahle, A.K., Arnberg, L. and Apelian, D. (1997) Burst Feeding and Its Role in Porosity Formation during Solidification of Aluminum Foundry Alloys. 101st Casting Congress, American Foundry Men’s Society, Seattle.
- Matthew, S., Dargusch, A., Dourb, G., Schauer, C., Dinnis, C.M. and Savaged, G. (2006) The Influence of Pressure during Solidification of High Pressure Die Cast Aluminium Telecommunication Components. Journal of Materials Processing Technology, 180, 37-43. http://dx.doi.org/10.1016/j.jmatprotec.2006.05.001
- Zhu, J.D., Cockcroft, S.L. and Maijer, D.M. (2006) Modelling of Micro Porosity Formation in A356 Aluminium Alloy Casting. Metallurgical and Materials Transactions A, 37, 1075.
- Zhang, M., Zhang, W.-W., Zhao, H.-D., Zhang, D.-T. and Li, Y.-Y. (2007) Effect of Pressure on Microstructures and Mechanical Properties of Al-Cu-Based Alloy Prepared by Squeeze Casting. Transactions of Nonferrous Metals Society of China, 17, 496-501. http://dx.doi.org/10.1016/S1003-6326(07)60122-8
- Wei, Y.-H., Hou, L.-F., Yang, L.-J., Xu, B.-S., Kozuka, M. and Ichinose, H. (2009) Microstructure and Properties of Die Casting Components with Various Thickness Made of AZ91D Alloy. Journal of Materials Processing Technology, 209, 3278-3284. http://dx.doi.org/10.1016/j.jmatprotec.2008.07.034
- Chiang, K.-T., Liu, N.-M. and Tsai, T.-C. (2008) Modelling and Analysis of the Effect of Processing Parameters on the Performance Characteristics in the High Pressure Die Casting Process of Al-Sl Alloys. International Journal of Advanced Manufacturing Technology, 41, 1076-1084. http://dx.doi.org/10.1007/s00170-008-1559-5
- Li, R.-X., Li, R.-D., Bai, Y.-H., Qu, Y.D. and Yuan, X.-G. (2009) Effects of Specific Pressure on Microstructure and Mechanical Properties of Squeezed Casting ZA27 Alloy. Shenyang University of Technology, Shenyang.
- Ambardar, R., Jayakumar, T., Pathak, S.D. and Prabhakar, O. (1996) Effect of Surface Roughness on Ultrasonic Echo Amplitude in Aluminium-Coper Alloy Castings. 14th World Conference on Non Destructive Testing, New Delhi, 2, 981-984.
- Aweda, J.O. (2006) Temperature Distribution and Properties in Squeeze Casting of Aluminium. Ph.D. Thesis, University of Ilorin, Ilorin.
- Doehler, H. (1910) Art of and Apparatus for Casting Fluid Metal. United States Patent 973,483, United States Patent and Trademark Office, Washington DC.
- Duckett, G. (1988) Quality-Whose Definition? Foundry Trade Journal, 163, 660-661.
- Xu, J.-P., Ji, W.-Z. and He, Z.-Q. (2005) Squeeze Casting of Zn-Al Alloy Gears with High Strength. Special Casting and Nonferrous Alloys, 25, 637-638.
- Li, R.-D., Huang, Z.-P., Bai, Y.-H., Zhang, Q.-S. and Zhang, H.-F. (2003) Effect of Super-High Pressure on the Non- Equilibrium Solidified Microstructure and Mechanical Properties of ZA27 Alloy. Foundry, 52, 92-94.
- Mikelonis, P.L. (1986) Foundry Technology. In: Walsh, L., Wurster, R. and Kimber, R.J., Eds., Quality Management Handbook, Marcel Dekker, New York, 753-790.
- Sabau, A.S. and Vishvanathan, S. (2002) Micro Porosity Prediction in Aluminum Alloy Castings. Metallurgical and Materials Transactions B, 33, 243.
- Hong, S.Z. and Zeng, Z.P. (2002) Effects of the Specific Pressure on Grain Size in Squeeze Casting. Special Casting and Nonferrous Alloy, 22, 26-27.
- Watmough (1960) The Effects of 0, 10, 20 psi (0, 0.069, and 0.138 MPa) Pressure Levels on the X-Ray Soundness of Sand Cast Steel Bars.
NOTES

*Corresponding author.