Food and Nutrition Sciences
Vol. 2 No. 10 (2011) , Article ID: 16355 , 7 pages DOI:10.4236/fns.2011.210149
Stability of Hydroxytyrosol in Aqueous Solutions at Different Concentration, Temperature and with Different Ionic Content: A Study Using UPLC-MS
![]()
1Department of Analytical Chemistry, University of Granada, Granada, Spain; 2Unit of Genetic, Reproduction and Fetal Medicine, Hospital “Virgen del Rocío”, Seville, Spain; 3Department of Bioorganic Chemistry, Chemistry Research Institute (CSIC), Seville, Spain.
Email: azafra@ugr.es
Received June 10th, 2011; revised July 18th, 2011; accepted July 26th, 2011.
Keywords: Hydroxytyrosol, Stability Studies, UPLC-MS Analysis
ABSTRACT
The work describes a stability study of hydroxytyrosol (HTyr) in aqueous solutions carried out varying the following parameters: HTyr concentration, temperature and ionic content in the aqueous solution. First, an analytical method based on the use of ultra performance liquid chromatography (UPLC-MS) as analytical technique was developed and validated. The equation of the linear model was A/AISTD = –0.0013 + 0.0117 ∙ [HTyr], with a very good linearity, since the R-Squared was 99.9% and the P value of the lack of fit test was higher than 5%. Limits of quantification estimated, CCa (a = 0.05%) and CCb (b = 0.05%), were 0.2 and 0.4 g/L respectively. As well, the relative standard deviation in the intra-day precision was lower than 3%. Therefore, the method is reproducible. We have applied this methodology to study the stability of HTyr and have observed that the most critical aspect turned to be the ionic content of the aqueous solutions. A tap water with high contents of calcium and magnesium (52 and 21 mg/L) degraded HTyr up to 64% in 48 hours whereas a low mineralization water with low contents of calcium and magnesium (4 and 2 mg/L) produced only 19% degradation.
1. Introduction
Epidemiological studies indicate that the consumption of natural phenolic compounds produces beneficial health effects and these substances are now considered as being potentially therapeutic [1]. In fact, it has been reported that polyphenols are endowed with interesting biological activities such as anti-inflammatory [2], cardioprotective [3], antibacterial [4], and anticarcinogenic activities, and they have been applied for pharmacological purposes [5]. Those bioactive phenolic compounds have been associated with a reduced incidence of cardiovascular disease and cancer [6-8]. Brain aging and the most diffused neurodegenerative diseases of the elderly are characterized by oxidative damage, redox metals homeostasis impairment and inflammation. In fact, some authors have suggested potential benefits from these antioxidants [9]. Hydroxytyrosol (HTyr), one of the most important compounds of this group, has been proposed to prevent neurodegenerative diseases [10]. At the same time, in vivo studies on rabbits have revealed that this compound is effective in cardioprotection [11].
Administration of HTyr in animal studies has normally been carried out as part of an extra virgin olive oil [12], as an olive oil mill waste water extract [13] or as an aqueous solution of a drug for daily animal consumption [11]. Recently, our group has participated in an in vivo study on the biological activity of HTyr where the compound was administered as an aqueous solution. However, we noticed that the HTyr solution darkened after several hours, most probably due to degradation through oxidation. We decided to carry out a stability study of HTyr in aqueous solutions varying the concentration of the compound, the temperature and the ionic content in the aqueous solution. HTyr has been analyzed using gas chromatography in biological samples, such as plasma [14] and urine [15]. Liquid chromatography has also been used to measure HTyr in olive oil [16], olive mill waste waters [17] and also in plasma and urine [18,19].
The main objective of the present work is to study the stability of HTyr in aqueous solutions at different concentration, temperature and with different ionic content. An ultra performance liquid chromatography coupled mass spectrometry method (UPLC-MS) without any pretreatment of sample was developed, validated and applied.
2. Methods
2.1. Reagents and Standards
All reagents were of analytical grade unless stated otherwise. Water was purified with a Milli-Q plus system, conductivity 18.2 MΩ·cm−1 (Millipore, Bedford, USA). Methanol, acetonitrile, o-phosphoric acid and acetic acid were supplied by Panreac (Barcelona, Spain). Formic acid and tyrosol were purchased from Sigma-Aldrich (Sigma-Aldrich, St. Louis, USA).
HTyr was prepared from their corresponding carboxylic acid by reduction with lithium aluminum hydride, purified by column chromatography and stored at –20˚C [20,21]. A concentrated stock solution (10.0 g/L) of the compound in milli Q water was freshly prepared to obtain the calibration curve and also right before each stability experiment.
A standard solution of 11.0 g/L of tyrosol in milli Q water after adequate dilution to a final concentration of 1.0 g/L was added to samples, as internal standard, just before injection.
2.2. Instrumentation and Software
A Waters UPLC liquid chromatograph (Mildford, MA, USA) equipped with a quaternary pump, a vacuum membrane degasser, a thermostated column compartment, an automatic autosampler, an automatic injector and connected “on-line” to a Micromass Premier XE triple quadrupole mass spectrometer with an electrospray ionization source was used. The mass spectrometer was operated in the negative ion mode. Nebulizing gas (nitrogen) flow was 70 L·hr–1. Nitrogen desolvation gas was used at a flow rate of 400 L·hr–1 and 350˚C. MS parameters were optimized to the following: capillary voltage = 3.5 kV, extraction cone = 3 V, RF lens = 0.5 V, source temperature = 120˚C, cone voltage 20 V, LM Resolution = 15.0, HM Resolution = 15.0 and multiplier = 650 V. Samples were injected as diluted solutions in water.
As liquid chromatographic columns, an Acquity BEH C18 (10 mm × 2.1 mm i.d., 1.7 mm particle size) from Waters (Milford, MA, USA), a Gemini C18 (150 mm × 4.6 mm i.d., 5 mm particle size) from Phenomenex (Torrance, CA, USA) and a Zorbax Eclipse XDB-C8 (150 mm × 4.6 mm i.d., 5 mm particle size) from Agilent Technologies (Palo Alto, CA, USA) were tested.
Data acquisition and processing was performed using MASSLYNX 4.0 software (Micromass Ltd.). All mass spectra were smoothed twice using Savitzky-Golay algorithm with 0.75 Da peak width. Statgraphics software was used for the statistical analysis of data.
2.3. Sample Preparation
Experiment 1. In volumetric flasks of 50 mL of capacity, three solutions of HTyr containing 2.75, 27.5 and 275.0 mg/L of the compound in Milli-Q water were prepared and divided into three portions into Falcon tubes of 15 mL of capacity. The fractions obtained were stored for one week under different conditions. The first one was stored in a freezer at –20˚C, the second in the fridge at 4˚C and the third at room temperature (RT, about 25˚C). Aliquots of 100 µL were picked up at initial time and after 0.5, 1, 2, 4, and 7 days and analyzed by UPLC-MS in order to study the stability of compounds in the different storage conditions. 10 µL of the internal standard solution (11 g/L) was added previous to injection in UPLC-MS system in order to get a final concentration of 1 g/L.
Experiment 2. In volumetric flasks of 25 mL of capacity, four aqueous solutions of HTyr containing 220 mg/L of the compound with different ionic content were prepared. The solutions were stored at room temperature and aliquots of 100 µL of each solution were taken at different time intervals (1, 3, 6, 9, 12, 24, 48 and 120 h). 10 µL of internal standard was also added just before injection (final volume 110 µL of 200 mg/L solution of analyte) and the aliquots were analyzed without delay. The changes in analyte concentration in the samples were monitored using the proposed method. The stability of Htyr was assayed in Milli-Q water, tap water from the city of Granada (Spain), bottled high and low mineralization water. The bottled mineral water was obtained from a supermarket. The ionic content data of waters was obtained from the label of bottles in case of mineralized water and from the regional water company (Emasagra, Granada, Spain) for tap water.
2.4. Description of the Analytical Method
For chromatographic separation of compounds, the Acquity BEH C18 was the selected column. This column showed the best resolution (tyrosol/HTyr) and the shortest chromatographic times. As mobile phase, in order to optimize peak separation and shapes of compounds, two organic solvents (methanol and acetonitrile) commonly used in liquid chromatography were evaluated. Both of them gave very similar results and acetonitrile was selected. Moreover, acidification of the LC eluent was assayed. Formic acid, acetic acid and o-phosphoric acid were tested as additives. Good results were obtained using a mobile phase composed of 0.1% (v/v) acetic acid aqueous solution modified (solvent A) and acetonitrile (solvent B). An isocratic mobile phase was used to obtain a good resolution for HTyr and internal standard in a low time. The composition was 95% of A and 5% B and held for 6 min. The flow-rate was 0.4 mL·min–1 and the column temperature 30˚C.
Lastly, in order to improve the sensitivity of the method, a study was performed to evaluate the possibility of increasing the injection volume. A range from 2 to 10 mL was studied and no extra broadening of the peak was observed, even at 10 mL. Accordingly, 10 mL was chosen as the injection volume.
For mass spectrometry detection, atmospheric-pressure chemical ionization (APCI) and Electrospray ionization (ESI) interfaces were evaluated for the compound in positive and negative modes. ESI interface in negative mode was selected because presents, in general, higher sensitivity for the studied compound. SIM mode was used for quantitative analysis. Figure 1 shows the chromatographic profile and the mass spectra for the compound and internal standard in water.
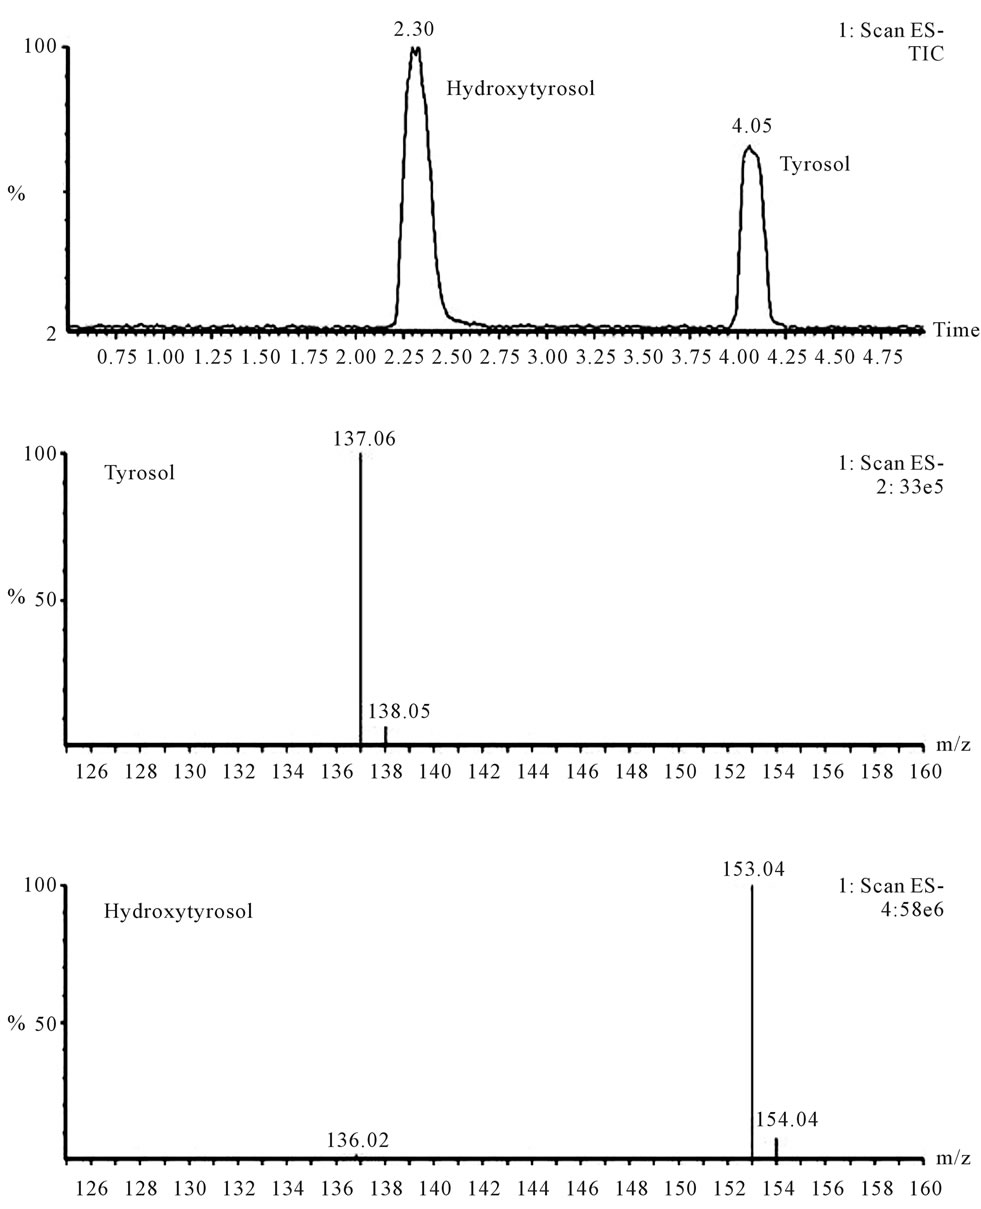
Figure 1. Chromatogram and mass spectra in SCAN mode of HTyr (100 mg/L of a distilled water solution) and tyrosol (1 g/L).
HTyr shows a chromatographic peak at 2.30 minute, while internal standard appears at 4.05 minutes. The mass spectra in SCAN mode shows the base peak at 153 m/z corresponding to the molecular ion in negative mode [M-1]– for HTyr and for internal standard tyrosol, the ion used was the corresponding to the molecular peak at 137 m/z in negative mode. No matrix effect or ion suppression was observed.
3. Results and Discussion
3.1. Analytical Performance
Calibration graphs were made using SIM mode in UPLCMS. Six concentration levels ranging from 0.4 to 250 mg/L were prepared in distilled water (each level by duplicate, and the central calibration standard was analyzed three times). Calibration curves were constructed using analyte/internal standard peak area ratio versus concentration and the equation of the fitted model was A/AISTD = –0.0013 + 0.0117 · [HTyr], with a regression standard deviation of 0.0302. Linearity of the calibration graphs was tested using the lack-of-fit test and the regression coefficient according to the Analytical Methods Committee [22]. The values obtained show that the results fit a linear model to describe the relationship between variables, since the R-Squared statistic indicates that the model as fitted explains 99.9% of the variability in signal and the P value of the lack of fit is higher than 5% (Plof 20.5%).
Limits of quantification were also estimated. The decision limit, CCa, and the detection capability, CCb were calculated [23]. The decision limit is the limit from which it can be inferred that a sample is contaminated with an error probability of a. The detection capability is the smallest content of analyte that may be detected, identified and/or quantified in a sample with an error probability of b. Decision limit and detection capacity which are better adjusted to a statistical evaluation are implemented. Thus, LOQs, CCa (a = 0.05%) and CCb (b = 0.05%), were 0.2 and 0.4 g/L respectively. Finally, to assess intra-day precision of the assay, standard samples at three concentration levels were analyzed by duplicate. The procedure was repeated on five consecutive days to determine inter-day-variability. Each day, stock solutions of the analyte were prepared in distilled water. The relative standard deviations were lower than 3% in all cases. Therefore, the method is reproducible.
3.2. Stability of Hydroxytyrosol Aqueous Solutions at Different Concentration and Temperature
In this experiment, three concentrations of HTyr (2.5, 25 and 250 mg/L) and three different temperatures (–20˚C, 4˚C and room temperature) were assayed. Aliquots of 100 µL of each solution were analyzed at different times adding 10 µL of an ethanol solution (11.0 g/L of internal standard) just before injection. In all cases, no changes in the signal obtained for the samples stored at –20˚C were observed after a week. However, when the samples were stored at 4˚C or room temperature a notable decrease in concentration was observed. For the most diluted sample (2.5 mg/L) the signal completely disappeared after 2 days at room temperature and after 4 days at 4˚C. It seems that the compound gets oxidized quite rapidly at low concentrations. The disappearance of HTyr in aqueous solutions has previously been related to the consumption of oxygen [24]. Cilliers and Singleton [25] proposed that phenolate anions directly react with triplet oxygen to form a semiquinone. Some authors have proposed that Htyr autoxidise to o-quinone or tautomeric p-quinone methides that after water addition undergo coupling with a second o-quinone leading to the formation of dimmers (methanooxocino benzodioxinone derivatives) [26,27].
When the concentration is higher (25 and 250 mg/L) the compound is much more stable and degradation is low. For the 25 mg/L sample, 10% of H degraded at 4˚C and about 25% at room temperature after one week. In the case of 250 mg/L the loss of compound is quite similar to the case of 25 mg/L, both at 4˚C and at room temperature.
3.3. Stability of Hydroxytyrosol in Aqueous Solutions with Different Ionic Content
Based on the results obtained in the previous stability study at different concentration and at different temperatures, a second assay was developed to test the importance of the different ionic content in the aqueous solutions. Since the stability is quite similar at 25 and 250 mg/L, a high concentration (200 mg/L) was used for better analytical performance. At the same time, since the behavior of compound at 4˚C and RT is also quite comparable, the second assay was carried out at RT (25˚C). Therefore, the results would be relevant for future animal studies with the compound and for predicting the stability of the compound when it is used with pharmaceutical purposes in aqueous solutions. Table 1 shows the four types of water used in the study: milli-Q water, bottled low mineralization water, bottled high mineralization water and tap water from the city of Granada (Spain). They were selected due to the increasing concentration of the most important ions such as sulphate, chloride, calcium, magnesium and sodium. Contents of heavy metals such us iron, copper, zinc or cobalt were below 0.3 mg/L
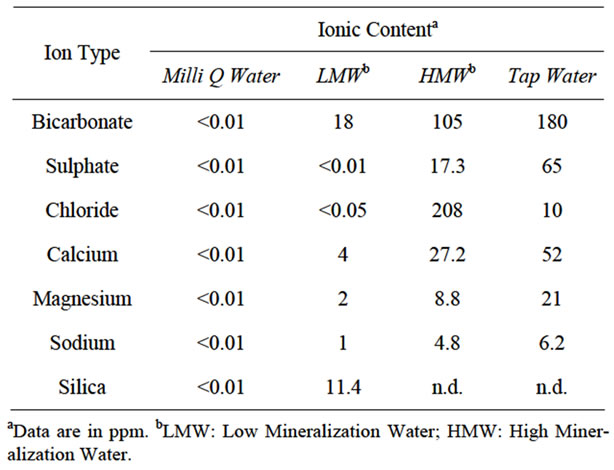
Table 1. Ionic content of water solutions used in this study.
in all cases.
The stability study was carried out for a period of 5 days and samples were analyzed at different time points. The results are shown in Figure 2.
The graph shows the degradation at different rates depending of the type of water employed. The concentration of HTyr in milli-Q water after five days decreased about 8%, and in the bottled low mineralization water the loss of signal was about 17%. However, when the ionic content of water was higher (bottled high mineralization water), the loss of signal clearly increased reaching values of 55% degradation. Finally, the decomposition of hydroxytyrosol was faster with the highest ionic content tested (tap water) where the signal of the antioxidant decreased 90% in five days.
It is known that the stability of complexes formed between ligands and metals contribute to the lower reducing capacity of the former compounds. In fact, it has been described previously that this compound is capable of chelating transition metal ions such as iron or copper [28,29] and its stability was drastically reduced in their presence (e.g. 0.6 mM in a 65% ethanol/water solution was degraded up to 50% in the presence of 0.6 mM Fe(III)). This effect of autoxidation catalyzed by iron or copper ions has shown to affect the antioxidant activity of olive polyphenols in other matrices such as olive oil or oil-in-water emulsions [30-32].
It is important to remark the low levels of iron or copper ions in our aqueous solutions, which points out to other metal ions that may be responsible of the consumption of the compound. In fact, the oxidation rate in the presence of calcium, has been described to be very similar to that of iron [24]. A slightly lower oxidation rate has been reported in the case of magnesium. The increasing amounts of these two types of metal ions in the four
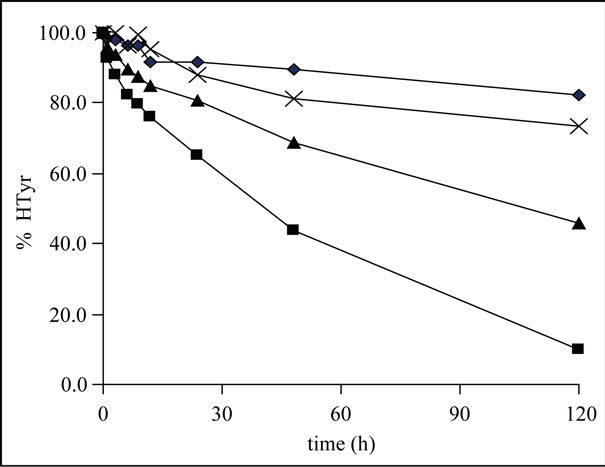
Figure 2. Degradation of hydroxytyrosol in different water media: ♦ milli Q water, X low mineralization water; ▲ high mineralization water; and ■ tap water.
types of water studied seem to be related with the rate of degradation. Therefore, aqueous solutions containing low mineralization appear as the best ionic conditions for the antioxidant stability and the most appropriate to be used in future animal studies.
4. Conclusions
A simple and rapid UPLC-MS method for the determination of HTyr in water samples is proposed. The method has been validated and the analytical parameters have been established. The stability of the compound has been studied at different storage conditions and in different types of water. Storage is best done at –20˚C since for at least 1 week no significant degradation of compound is observed. The presence of salts in water and the temperature produces the oxidation of compound and consequently a notable decrease in availability and a loss in biological activity. Therefore, the results are of high relevance for future animal studies with this compound, for predicting the stability of potential liquid food samples containing the compound but also when performing quantitative determinations of this compound in biological fluids particularly when using LC/MS. Being HTyr lower concentrations more prone to degrade than the higher ones. Therefore, we have observed changes in HTyr stability with concentration and temperature, but the most critical aspect turned to be the ionic content of the aqueous solutions. A tap water with high contents of calcium and magnesium (52 and 21 mg/L) degraded HTyr up to 64% in 48 hours.
REFERENCES
- C. W. Arts and P. C. H. Hollman, “Polyphenols and Disease Risk in Epidemiologic Studies,” American Journal of Clinical Nutrition, Vol. 81, No. 1, 2005, pp. 317S- 325S.
- I. Rahman, S. K. Biswas and P. A. Kirkham, “Regulation of Inflammation and Redox Signaling by Dietary Polyphenols,” Biochemical Pharmacology, Vol. 72, No. 11, 2006, pp. 1439-1452. doi:10.1016/j.bcp.2006.07.004
- T. L. Zern and M. L. Fernandez, “Cardioprotective Effects of Dietary Polyphenols,” Journal of Nutrition, Vol. 135, No. 10, 2005, pp. 2291-2294.
- M. Daglia, A. Papetti, P. Grisoli, C. Aceti, C. Dacarro and G. Gazzani, “Antibacterial Activity of Red and White Wine Against Oral Streptococci,” Journal of Agricultural and Food Chemistry, Vol. 55, No. 13, 2007, pp. 5038- 5042. doi:10.1021/jf070352q
- R. W. Owen, A. Giacosa, W. E. Hull, R. Haubner, B. Spiegelhalder and H. Bartsch, “The Antioxidant/Anticancer Potential of Phenolic Compounds Isolated from Olive Oil,” European Journal of Cancer, Vol. 36, No. 10, 2000, pp. 1235-1247. doi:10.1016/S0959-8049(00)00103-9
- A. Keys, “Mediterranean Diet and Public Health: Personal Reflections,” American Journal of Clinical Nutrition, Vol. 61, No. 6, 1995, pp. 1321S-1323S.
- P. M. Kris-Etherton, K. D. Hecker, A. Bonanome, S. M. Coval, A. E. Binkoski, K. F. Hilpert, A. E. Griel and T. D. Etherton, “Bioactive Compounds in Foods: Their Role in the Prevention of Cardiovascular Disease and Cancer,” American Journal of Medicine, Vol. 113, No. 9, 2002, pp. 71-88.
- H. L. Newmark, “Plant Phenolics as Potential Cancer Prevention Agents,” Advances in Experimental Medicine and Biology, Vol. 401, 1996, pp. 25-34. doi:10.1007/978-1-4613-0399-2_3
- L. Rossi, S. Mazzitelli, M. Arciello, C. R. Capo and G. Rotilio, “Benefits from Dietary Polyphenols for Brain Aging and Alzheimer’s Disease,” Neurochemistry Research, Vol. 33, No. 12, 2008, pp. 2390-2400. doi:10.1007/s11064-008-9696-7
- A. Geerlings, E. López-Huertas, J. C. Morales, J. Boza and J. Jiménez, “Natural Phenolic Products and Derivatives Thereof for Protection against Neurodegenerative Diseases,” Patent WO 03/082259, 2003.
- M. González-Santiago, E. Martín-Bautista, J. J. Carrero, J. Fonollá, L. Baró, M. V. Bartolomé, P. Gil-Loyzaga and E. López-Huertas, “One-Month Administration of Hydroxytyrosol, a Phenolic Antioxidant Present in Olive Oil, to Hyperlipemic Rabbits Improves Blood Lipid Profile, Antioxidant Status and Reduces Atherosclerosis Development,” Atherosclerosis, Vol. 188, No. 1, 2006, pp. 35-42. doi:10.1016/j.atherosclerosis.2005.10.022
- M. J. Oliveras-López, G. Berná, E. M. Carneiro, H. López-García de la Serrana, F. Martín and M. C. López, “An Extra-Virgin Olive Oil Rich in Polyphenolic Compounds Has Antioxidant Effects in OF1 Mice,” Journal of Nutrition, Vol. 138, No. 6, 2008, pp. 1074-1078.
- C. M. Bitler, T. M. Viale, B. Damaj and R. Crea, “Hydrolyzed Olive Vegetation Water in Mice Has Anti-Inflammatory Activity,” Journal of Nutrition, Vol. 135, No. 6, 2005, pp. 1475-1479.
- E. Miro-Casas, M. I. Covas, M. Farre, M. Fito, J. Ortuño, T. Weinbrenner, P. Roset and R. de la Torre, “Hydroxytyrosol Disposition in Humans,” Clinical Chemisty, Vol. 49, No. 6, 2003, pp. 945-952. doi:10.1373/49.6.945
- F. N. Bazoti, E. Gikas, C. Puel, V. Coxam and A. Tsarbopoulos, “Development of a Sensitive and Specific Solid Phase Extraction—Gas Chromatograph—Tandem Mass Spectrometry Method for the Determination of Elenolic Acid, Hydroxytyrosol, and Tyrosol in Rat Urine,” Journal of Agricultural and Food Chemistry, Vol. 53, No. 16, 2005, pp. 6213-6221. doi:10.1021/jf050851w
- M. Brenes, A. García, P. García, J. J. Rios and A. Garrido, “Phenolic Compounds in Spanish Olive Oils,” Journal of Agricultural and Food Chemistry, Vol. 47, No. 9, 1999, pp. 3535-3540. doi:10.1021/jf990009o
- E. De Marco, M. Savarese, A. Paduano and R. Sacchi, “Characterization and Fractionation of Phenolic Compounds Extracted from Olive Oil Mill Wastewaters,” Food Chemistry, Vol. 104, No. 2, 2007, pp. 858-867. doi:10.1016/j.foodchem.2006.10.005
- P. Del Boccio, A. Di Deo, A. De Curtis, N. Celli, L. Iacoviello and D. Rotilio, “Liquid Chromatographytandem Mass Spectrometry Analysis of Oleuropein and Its Metabolite Hydroxytyrosol in Rat Plasma and Urine after Oral Administration,” Journal of Chromatography B, Vol. 785, No. 1, 2003, pp. 47-56. doi:10.1016/S1570-0232(02)00853-X
- H. W. Tan, K. L. Tuck, I. Stupans and P. J. Hayball, “Simultaneous Determination of Oleuropein and Hydroxytyrosol in Rat Plasma Using Liquid Chromatography with Fluorescence Detection,” Journal of Chromatography B, Vol. 785, No. 1, 2003, pp. 187-191.
- R. Capasso, A. Evidente, S. Avolio and F. Solla, “A Highly Convenient Synthesis of Hydroxytyrosol and Its Recovery from Agricultural Wastewaters,” Journal of Agricultural and Food Chemistry, Vol. 47, No. 4, 1999, pp. 1745-1748. doi:10.1021/jf9809030
- P. G. Baraldi, D. Simoni, S. Manfredini and E. Menziani, “Preparation of 3,4-Dihydroxy-1-benzeneethanol: A Reinvestigation,” Liebig’s Annals of Chemistry, Vol. 1983, No. 4, 1983, pp. 684-686. doi:10.1002/jlac.198319830417
- Analytical Methods Committee, “Is My Calibration Linear?” Analyst, Vol. 119, No. 11, 1994, pp. 2363-2366. doi:10.1039/an9941902363
- “COMMISSION DECISION 2002/657/EC of 12 August 2002 Implementing Council Directive 96/23/EC Concerning the Performance of Analytical Methods and the Interpretation of Results,” Official Journal of the European Communities, 2002, pp. L221/8-L221/36.
- P. García, C. Romero, M. Brenes and A. Garrido, “Effect of Metal Cations on the Chemical Oxidation of Olive o-Diphenols in Model Systems,” Journal of Agricultural and Food Chemistry, Vol. 44, No. 8, 1996, pp. 2101- 2105. doi:10.1021/jf9503265
- J. J. L. Cilliers and V. L. Singleton, “Nonenzymic Autoxidative Phenolic Browning Reactions in a Caffeic Acid Model System,” Journal of Agricultural and Food Chemistry, Vol. 37, No. 4, 1989, pp. 890-896. doi:10.1021/jf00088a013
- D. Vogna, A. Pezzella, L. Panzella, A. Napolitano and M. d’Ischia, “Oxidative Chemistry of Hidroxytyrosol: Isolation and Characterization of Novel Methanoxo Cinobenzodioxinone Derivatives,” Tetrahedron Letters, Vol. 44, No. 45, 2003, pp. 8289-8292. doi:10.1016/j.tetlet.2003.09.066
- M. de Lucia, L. Panzella, A. Pezzella, A. Napolitano and M. d’Ischia, “Oxidative Chemistry of the Natural Anti-Oxidant Hydroxytyrosol: Hydrogen Peroxide-Dependent Hydroxylation and Hydroxyquinone/o-Quinone Coupling Pathways,” Tetrahedron, Vol. 62, No. 6, 2006, pp. 1273-1278. doi:10.1016/j.tet.2005.10.055
- F. Paiva-Martins and M. H. Gordon, “Interactions of Ferric Ions with Olive Oil Phenolic Compounds,” Journal of Agricultural and Food Chemistry, Vol. 53, No. 7, 2005, pp. 2704-2709. doi:10.1021/jf0481094
- A. Bendini, L. Cerretani, S. Vecchi, A. Carrasco-Pancorbo and G. Lecker, “Protective Effects of Extra Virgin Olive Oil Phenolics on Oxidative Stability in the Presence or Absence of Copper Ions,” Journal of Agricultural and Food Chemistry, Vol. 54, No. 13, 2006, pp. 4880-4887. doi:10.1021/jf060481r
- F. Paiva-Martins and M. H. Gordon, “Effects of pH and Ferric Ions on the Antioxidant Activity of Olive Polyphenols in Oil-In-Water Emulsions,” Journal of the American Oil Chemists’ Society, Vol. 79, No. 6, 2002, pp. 571-576.
- T. Keceli and M. H. Gordon, “Ferric Ions Reduce the Antioxidant Activity of the Phenolic Fraction of Virgin Olive Oil,” Journal of Food Science, Vol. 67, No. 3, 2002, pp. 943-947. doi:10.1111/j.1365-2621.2002.tb09432.x
- F. Paiva-Martins, V. Santos, H. Mangericao and M. H. Gordon, “Effects of Copper on the Antioxidant Activity of Olive Polyphenols in Bulk Oil and Oil-In-Water Emulsions,” Journal of Agricultural and Food Chemistry, Vol. 54, No. 10, 2006, pp. 3738-3743. doi:10.1021/jf060033j