Food and Nutrition Sciences
Vol. 2 No. 7 (2011) , Article ID: 7238 , 5 pages DOI:10.4236/fns.2011.27104
Development and Validation of an Australian Database for Estimating the Seafood Content of Canned Products
![]()
1Smart Foods Centre, University of Wollongong, Wollongong, Australia; 2Statistical Consulting Service, University of Wollongong, Wollongong, Australia.
Email: epn579@uow.edu.au
Received May 17th, 2011; revised July 26th, 2011; accepted August 3rd, 2011.
Keywords: Canned Fish, Clinical Trial, Food Database, Australia
ABSTRACT
Canned fish products are of increasing popularity in Australia; however current Australian nutrient databases do not include data on the percentage fish in these products. The objective of this study was to develop and validate a database of the percentage fish and seafood contained in common canned fish and seafood products, for use in clinical trials. Six major supermarkets in the Illawarra region, NSW were audited for canned seafood products, and a database of reported percentage fish and seafood was developed. Mean + SD of each type of product was then determined. To validate the database, a represen-tative sample of canned tuna products were weighed according to Codex Alimentarius methods. The weighed percentage fish was compared to reported percentage via independent sample t-test and Mann-Whitney test. Percentage fish data was collected for n = 214 canned fish products. The mean percentage fish in tuna products was 60.4% + 11.3% (n = 144), 72.0% + 14.7% in salmon products (n = 31) and 70.9% + 9.3% in sardine products (n = 23). There was no significant difference between the reported and weighed percentage fish. This database highlighted the substantial proportion of additional ingredients found in canned fish products. Given the popularity of such products, future studies measuring fish consumption should use a similar database to accurately measure fish intake.
1. Introduction
Habitual fish consumption has been associated with a range of health benefits, including decreased incidence of stroke and heart failure and decreased mortality from cardiovascular disease [1-5]. There is evidence that canned fish and seafood products such as canned tuna are increasing in popularity as a convenient source of fish in Australia. The most recent National Nutrition Survey, conducted in 1995, found that packed fish and seafood, which included canned products, were on average 12.8% of all fish consumed [6]. In contrast, a recent survey in Melbourne, Victoria found that canned fish accounted for more than one third of seafood purchases, and that canned tuna was the most popular fish species bought for in-home consumption [7].
Australian and international nutrient databases such as the AUSNUT 2007 [8] and the USDA National Nutrient Database [9] contain nutrient data on a variety of canned fish and seafood products, based on the edible portion of each product. Whilst this allows for the calculation of nutrient intake, no data is available on the percentage fish or seafood in these canned products in these databases, which is essential for accurately measuring consumption of fish and seafood.
Food Standards Australia New Zealand (FSANZ) specifies that canned fish and seafood products, like most foods, must contain percentage labelling of all characterising ingredients and components [10]. Canned fish and seafood products must list the percentage fish or seafood in the product, calculated as the weight of the fish and seafood as a percentage of the total weight of the product [10]. Percentage labelling of canned fish and seafood is of particular significance given the popularity of the products in Australia, and the inclusion of packing mediums such as oil, brine, and added flavourings and sauces which may contribute a substantial percentage of the weight of the total product (Choice, January/February 2004, pp. 15-19). Furthermore, given the large number of clinical trials investigating the effects of fish and seafood consumption on human health [11-16], it is of high importance that such studies adjust for the percentage of fish contained in canned products, as the assumption that the weight of fish consumed is the same as the net weight of the can’s contents could result in dramatic overestima tions of fish consumption. To date, no known studies measuring fish consumption have reported an adjustment for this variation.
The aim of this study was to develop and validate a database of the percentage fish contained in a range of common canned seafood products, which could be used to estimate fish and seafood consumption from canned products in future clinical trials.
2. Methods
2.1. Development and Validation of Canned Fish Database
To identify all available varieties of canned seafood, an audit was carried out on the six major supermarket chains in the Illawarra region of New South Wales, Australia. Data collected included name, total weight and percentage seafood contained in the product, as stated on the label. Samples were excluded from further analysis if they did not state the percentage seafood, if the seafood content was less than one third of the total weight, or if they were not in stock on the day the audit was taken. A database of canned seafood products was then developed, with products categorised according to species and packing medium (for example springwater, oil, brine, or added flavourings). Products were considered to be flavoured if they contained any flavouring in addition to the water, oil or brine, for example tuna in springwater with lemon.
As canned tuna products were found to be the dominant canned product available, validation of the database was carried out in canned tuna products only. The number of samples required to yield a sample mean within 10% of the population mean was calculated according to the method described by Proctor and Meullenet [17]. A stratified sampling technique was used by dividing samples into their packing medium, which included springwater, oil, brine, and flavoured tuna products and stratifying according to brand [18]. The required number of samples for each packing medium and brand was then randomly selected using SPSS (Version 15, SPSS Chicago IL, 2006).
The amount of tuna in the selected canned products was measured using the methods described in the Codex Alimentarius [19]. Briefly, for samples canned in springwater, oil or brine, the contents of the can were poured through a pre-weighed wire sieve, weighed on a CAS SW-1 scale. The fish was allowed to drain at an angle of 17˚ - 20˚ for two minutes. The sieve containing the drained fish was then weighed and the total weight of the drained fish determined by subtracting the original weight of the sieve.
For flavoured tuna samples, a similar procedure was used; however contents were washed with warm water prior to weighing to remove any sauces. Ingredients such as onion, chilli and beans were also removed with pincers prior to weighing. Additional steps were then undertaken to improve the accuracy of the measurement, following the findings of a pilot study using n = 7 tuna products in different packing mediums. After the removal of the fish, the can was filled with warm water to remove any remaining fish and poured through the sieve as well. Following this step, the fish was also pressed with paper towel to remove any excess liquid, with care taken to ensure no fish adhered to the towel.
2.2. Statistical Analysis
All statistical analyses were carried out using SPSS (Version 15, SPSS Chicago IL, 2006). Statistical significance was set at p = 0.05. Mean and standard deviation of data from the audited samples were calculated for the total grams of seafood and percentage seafood as expressed on the label to allow for the development of the database. After weighing, grams of fish were converted to a percentage of the total weight to allow for comparison between the different serving sizes used between brands. The mean and standard deviation of the percentage fish expressed on the label and as weighed were calculated. The normality of the label and weighed data were determined using the Shapiro-Wilks test. Depending on normality, independent sample t-tests or a MannWhitney test were used to compare the mean of the label and weighed data for each category of canned tuna product.
3. Results
Based on the supermarket audit, samples were recorded for: canned tuna products (n = 144), canned salmon (n = 31), canned sardines (n = 23), canned oysters (n = 5), canned mackerel (n = 3), canned herring (n = 2), canned mussels (n = 2), canned anchovies (n = 1), canned kipper (n = 1), canned prawns (n = 1), and canned crab (n = 1). The mean and SD for these products is shown in Table 1, as a summary of the database. The percent seafood varied between the type of seafood in the canned products and the canning medium. Salmon canned in brine had the highest reported percentage fish, whilst flavoured tuna products had the lowest.
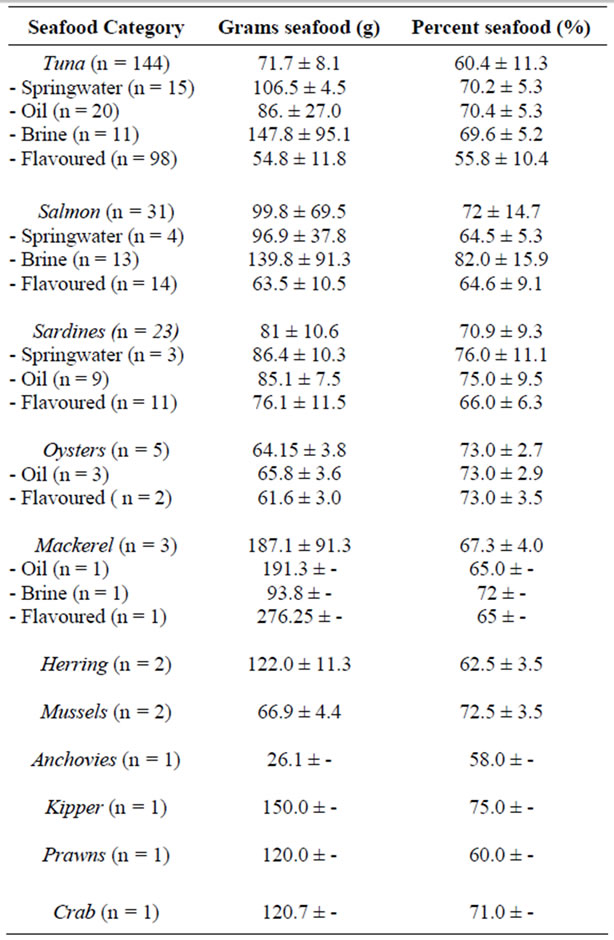
Table 1. Mean ± SD grams and percentage seafood in canned seafood products, as expressed on the label.
For validation of the database, samples were collected for: tuna canned in springwater (n = 12), tuna canned in oil (n = 12), tuna canned in brine (n = 10), and canned flavoured tuna (n = 25). The number of samples selected was sufficient to provide a sample mean within 10% of the population mean [18]. The mean and SD of the percentage tuna reported on the label and found after weighing is shown in Table 2. There was no significant difference between the label and weighed data in all categories or in total tuna products. Weighed percentage tuna was found to be slightly lower than reported percentage tuna for springwater, oil and brine, but was higher for flavoured tuna products.
4. Discussion
The results of this study confirmed that the percentage labelling of fish in a sample of canned products did not differ significantly from the actual percentage. This study is the first known attempt to develop a database of the percentage fish present in canned products. Previous ob-
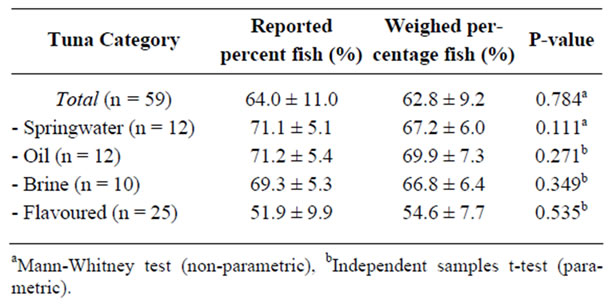
Table 2. Mean ± SD and p-value of reported and weighed percent fish in canned fish products.
servational studies which have approximated fish consumption through the use of dietary records and questionnaires often do not adjust for the presence of additional ingredients in fish and seafood products, instead calculating fish consumption as being equal to reported fish intake [2,3,20-24].
The importance of accounting for the presence of additional ingredients in canned products when calculating fish intake can be clearly seen in the findings of this study. The results of the supermarket audit revealed some canned fish categories to contain on average, as low as 55.8%, or 53 grams of fish, highlighting the substantial contribution of added ingredients to the weight of the product. Given the popularity of canned fish and seafood products in Australia [7], these findings suggest that many Australian consumers may be overestimating their current fish consumption, and highlight the importance of percentage labelling of food products. It is also clear that not adjusting for percentage fish in canned products in clinical trials could result in a large overesti-mation of the amount of fish consumption, which could potential lead to inaccurate conclusions being drawn about fish intake patterns.
Given the standards governing the labelling of percentage ingredients in food products [10], it is expected that products would provide accurate representations of the percentage fish they contain, as was found in this study. It should be noted, however, that all categories of tuna other than flavoured varieties, were measured as containing less tuna than reported on the label.
Conversely, flavoured tuna products were found on average to contain more tuna than docume-nted. This variation may have been due to the contents of the flavoured tuna products, which often contained additions such as pepper and sauces. While care was taken to remove as much of these ingredients as possible, it is inevitable that some could not be removed, and were weighed with the fish. However, whilst potentially more accurate methods of analysis, such as measurement of the creatine content of the products [25], were considered, these methods are inaccurate for use in fish products (Tume [CSIRO], 2009, pers. comm. 11 November).
The selection of samples for validation of the database may also be considered a limitation of this research, as only tuna samples were selected. This choice was made based on the large variety of tuna samples noted in the audit, and was due to the known popularity of canned tuna products in Australia [7]. Performing the validation using tuna products also satisfied the criteria required to provide a sample mean within 10% of the population mean, which included all canned fish documented in the audit [18]. An additional limitation of the validation process is that the amount of tuna in each sample was measured once, potentially limiting the reliability of these analyses. However, the analyses were carried out according to a repeatable and published methodology [19], with a pilot study conducted prior to this analysis to standardise the process.
Finally, the audit of available fish and seafood products was limited to supermarkets in the Illawarra area, meaning the results of this study cannot be extrapolated to different geographical regions. For this database to be relevant to wider areas, future research may be required to expand the auditing process to a broader geographical area.
5. Conclusions
This study resulted in the development and validation of the first known database to approximate the percentage fish contained in canned fish and seafood products. Given the known health benefits of fish consumption [1, 2,20,26] it is of great importance that efforts such as this are made in order to accurately measure fish intake in dietary trials. Future research should aim to expand on these findings, to the development of a comprehensive canned fish and seafood database which can be used in a wide variety of future trials.
6. Acknowledgements
This study was supported by the School of Health Sciences, University of Wollongong (HDR student funding). Elizabeth Neale was supported by an Australian Postgraduate Scholarship.
REFERENCES
- D. Mozaffarian, W. T. Longstreth Jr., R. N. Lemaitre, T. A. Manolio, L. H. Kuller, G. L. Burke and D. S. Siscovick, “Fish Consumption and Stroke Risk in Elderly Individuals: The Cardiovascular Health Study,” Archives of Internal Medicine, Vol. 165, No. 2, 2005, pp. 200-206. doi:10.1001/archinte.165.2.200
- D. Mozaffarian, C. L. Bryson, R. N. Lemaitre, G. L. Burke and D. S. Siscovick, “Fish Intake and Risk of Incident Heart Failure,” Journal of the American College of Cardiology, Vol. 45, No. 12, 2005, pp. 2015-2021. doi:10.1016/j.jacc.2005.03.038
- K. He, E. B. Rimm, A. Merchant, B. A. Rosner, M. J. Stampfer, W. C. Willett and A. Ascherio, “Fish Consumption and Risk of Stroke in Men,” JAMA, Vol. 288, No. 24, 2002, pp. 3130-3136. doi:10.1001/jama.288.24.3130
- K. Yamagishi, H. Iso, C. Date, M. Fukui, K. Wakai, S. Kikuchi, Y. Inaba, N. Tanabe and A. Tamakoshi, “Fish, Omega-3 Polyunsaturated Fatty Acids, and Mortality From Cardiovascular Diseases in a Nationwide Community-Based Cohort of Japanese Men and Women: The JACC (Japan Collaborative Cohort Study for Evaluation of Cancer Risk) Study,” Journal of the American College of Cardiology, Vol. 52, No. 12, 2008, pp. 988-996. doi:10.1016/j.jacc.2008.06.018
- E. B. Levitan, A. Wolk and M. A. Mittleman, “Fish Consumption, Marine Omega-3 Fatty Acids, and Incidence of Heart Failure: A Population-Based Prospective Study of Middle-Aged and Elderly Men,” European Heart Journal, Vol. 30, No. 12, 2009, pp. 1495-1500. doi:10.1093/eurheartj/ehp111
- Australian Bureau of Statistics, “National Nutrition Survey: Foods Eaten,” Canberra, 1995.
- Fisheries Research and Development Corporation, “Retail Sale and Consumption of Seafood—Melbourne,” Australian Government, 2006.
- Food Standards Australia and New Zealand, “AUSNUT 2007—Australian Food, Supplement and Nutrient Database for Estimation of Population Nutrient Intakes,” 2008. http://www.foodstandards.gov.au/consumerinformation/ausnut2007/
- U.S. Department of Agriculture; Agriculture Research Service, “USDA National Nutrient Database for Standard Reference,” Release 18, 2005.
- Food Standards Australia New Zealand, “Percentage Labelling,” 2001.
- I. Thorsdottir, H. Tomasson, I. Gunnarsdottir, E. Gisladottir, M. Kiely, M. Parra, N. Bandarra, G. Schaafsma and J. Martinez, “Randomized Trial of Weight-Loss-Diets for Young Adults Varying in Fish and Fish Oil Content,” International Journal of Obesity, Vol. 31, 2007, pp. 1560- 1566. doi:10.1038/sj.ijo.0803643
- V. Ouellet, J. Marois, S. Weisnagel and H. Jacques, “Dietary Cod Protein Improves Insulin Sensitivity in Insulin-Resistant Men and Women: A Randomized Controlled Trial,” Diabetes Care, Vol. 30, No. 11, 2007, pp. 2816. doi:10.2337/dc07-0273
- J. J. Lara, M. Economou, A. M. Wallace, A. Rumley, G. Lowe, C. Slater, M. Caslake, N. Sattar and M. E. J. Lean, “Benefits of Salmon Eating on Traditional and Novel Vascular Risk Factors in Young, Non-Obese Healthy Subjects,” Atherosclerosis, Vol. 193, No. 1, 2007, pp. 213-221. doi:10.1016/j.atherosclerosis.2006.06.018
- D. Parra, N. Bandarra, M. Kiely, I. Thorsdottir and J. Martinez, “Impact of Fish Intake on Oxidative Stress When Included into a Moderate Energy-Restricted Program to Treat Obesity,” European Journal of Nutrition, Vol. 46, No. 8, 2007, pp. 460-467. doi:10.1007/s00394-007-0686-3
- A. Ramel, D. Parra, J. Martinéz, M. Kiely and I. Thorsdottir, “Effects of Seafood Consumption and Weight Loss on Fasting Leptin and Ghrelin Concentrations in Overweight and Obese European Young Adults,” European Journal of Nutrition, Vol. 48, No. 2, 2009, pp. 107-114. doi:10.1007/s00394-008-0769-9
- T. A. Mori, V. Burke, I. B. Puddey, J. E. Shaw and L. J. Beilin, “Effect of Fish Diets and Weight Loss on Serum Leptin Concentration in Overweight, Treated-Hypertensive Subjects,” Journal of Hypertension, Vol. 22, No. 10, 2004, pp. 1983-1990. doi:10.1097/00004872-200410000-00022
- A. Proctor and J. Meullenet, “Sampling and Sampling Preparation,” In: S. Nielsen, Ed., Food Analysis, Aspen, Maryland, 1998, pp. 71-83.
- H. Greenfield and D. Southgate, “Food Composition Data: Production, Management and Use,” Food and Agriculture Organization of the United Nations, Rome, 2003.
- Codex Alimentarius, “Codex Standard for Canned Tuna and Bonito,” In Codex Stan 70-1981, 1995.
- F. B. Hu, L. Bronner, W. C. Willett, M. J. Stampfer, K. M. Rexrode, C. M. Albert, D. Hunter and J. E. Manson, “Fish and Omega-3 Fatty Acid Intake and Risk of Coronary Heart Disease in Women,” JAMA, Vol. 287, No. 14, 2002, pp. 1815-1821. doi:10.1001/jama.287.14.1815
- J. Dallongeville, J. Yarnell, P. Ducimetiere, D. Arveiler, J. Ferrieres, M. Montaye, G. Luc, A. Evans, A. Bingham, B. Hass, J.-B. Ruidavets and P. Amouyel, “Fish Consumption Is Associated with Lower Heart Rates,” Circulation, Vol. 108, No. 7, 2003, pp. 820-825. doi:10.1161/01.CIR.0000084542.64687.97
- H. Iso, K. M. Rexrode, M. J. Stampfer, J. E. Manson, G. A. Colditz, F. E. Speizer, C. H. Hennekens and W. C. Willett, “Intake of Fish and Omega-3 Fatty Acids and Risk of Stroke in Women,” JAMA, Vol. 285, No. 3, 2001, pp. 304-312. doi:10.1001/jama.285.3.304
- C. M. Oomen, E. J. M. Feskens, L. Rasanen, F. Fidanza, A. M. Nissinen, A. Menotti, F. Kok and D. Kromhout, “Fish Consumption and Coronary Heart Disease Mortality in Finland, Italy, and the Netherlands,” American Journal of Epidemiology, Vol. 151, No. 10, 2000, pp. 999-1006.
- D. Kromhout, M. B. Katan, L. Havekes, A. Groener, G. Hornstra and C. de Lezenne Coulander, “The Effects of 26 Years of Habitual Fish Consumption on Serum Lipid and Lipoprotein Levels (The Zutphen Study),” Nutrition, Metabolism and Cardiovascular Diseases, Vol. 6, 1996, pp. 65-71.
- G. del Campo, B. Gallego, I. Berregi and J. A. Casado, “Creatinine, Creatine and Protein in Cooked Meat Products,” Food Chemistry, Vol. 63, No. 2, 1998, pp. 187-190. doi:10.1016/S0308-8146(98)00034-X
- D. S. Siscovick, T. E. Raghunathan, I. King, S. Weinmann, V. E. Bovbjerg, L. Kushi, L. A. Cobb, M. K. Copass, B. M. Psaty, R. Lemaitre, B. Retzlaff and R. H. Knopp, “Dietary Intake of Long-Chain n-3 Polyunsaturated Fatty Acids and the Risk of Primary Cardiac Arrest,” American Journal of Clinical Nutrition, Vol. 71, No. 1, 2000, pp. 208S-212S.