International Journal of Medical Physics, Clinical Engineering and Radiation Oncology
Vol.3 No.1(2014), Article ID:43059,4 pages DOI:10.4236/ijmpcero.2014.31011
Dose Distribution of Photon Beam by Siemens Linear Accelerator
1Faculty of Medicine, University of Prishtina, Prishtina, Kosovo
2Department of Physical Engineering, Polytechnic University of Tirana, Tirana, Albania
3Department of Physics, Faculty of Natural Science, University of Prishtina, Prishtina, Kosovo
Email: *besim.xhafa@uni-pr.edu
Copyright © 2014 Besim Xhafa et al. This is an open access article distributed under the Creative Commons Attribution License, which permits unrestricted use, distribution, and reproduction in any medium, provided the original work is properly cited. In accordance of the Creative Commons Attribution License all Copyrights © 2014 are reserved for SCIRP and the owner of the intellectual property Besim Xhafa et al. All Copyright © 2014 are guarded by law and by SCIRP as a guardian.
Received January 1, 2014; revised January 31, 2014; accepted February 16, 2014
KEYWORDS
Radiation; Absorbed Dose; Measurements; Percent Dose Depth; Dose Profile; Treatment Planning System
ABSTRACT
The radiation therapy is applied on around 50% of the cancer patients. As we know, before implementing a radiation treatment planning system in the clinic, the dose-calculation measurement must be validated using rigorous, clinically relevant criteria [1]. Percent Depth Doses (PDD), Dose Profile (DP), Open Collimator Factor (OCF) etc., are measured for all numbers of square fields for Treatment Planning System XiO, version 4.7, for 6 and 15 MV photons energies and for 15˚, 30˚, 45˚, 60˚ wedge, which were employed to obtain the profiles in any depth. The measurements were conducted also for different energies of electron beam and TPS calculation algorithms.
1. Introduction
There are many objectives to using external radiotherapy in cancer treatment using high radiation doses from photon or electron beams. Healthy tissues and organs at risk surrounding the tumor should be preserved during treatment by the optimization of the irradiation parameters using a convenient Treatment Planning System (TPS). However, a quality control program should be implemented to compare the results provided by the TPS with experimental data. The experimental data are obtained by measurement of dosimetric parameters such as dose profile, relative output factor and percentage depth dose (PDD) [2].
Determination of dosimetric characteristics of all radiation beams is vital so that the most appropriate set of treatment planning parameters is chosen. Data on the percentage depth-dose of diagnostic X-rays are important in evaluating patient dose from medical exposure [3]. In radiotherapy, quality of a radiation beam is most usefully expressed in terms of its penetrating power, which is a function mainly of the mean photon energy, and may be fully described by its depth dose characteristics in water [4] but an increase in surface dose with field size is also noted due to electron scattering from intervening materials [5]. Data on dose distribution are almost entirely derived from measurements in phantoms, and then are used in a dose calculation system devised to predict dose distribution in an actual patient [6]. Dosimetry is a very significant element of radiotherapy treatment as all the treatment planning is based on the data obtained during dosimetry. Optimization of treatment plan, and calculation of dose for certain plan is performed when radiation physicists have measured dosimetry data. This data is actually representing different physics characteristics of the machine, beam and its energies in the form of dosimetric quantities. Physicists are always interested in obtaining these parameters, first to use in radiotherapy treatment and second to evaluate and investigate physics of radiation beams field size, photon energy and Source to Surface Distance (SSD). Measurement of absorbed dose is performed using water or any other equivalent media phantom, which is kept perpendicular on the path of beam. This measurement is expressed as percent of dose which gives a unique value for a certain set of parameters like beam energy, depth, SSD and field size. Variation in this value can be noted by change in any of these parameters [7]. These measurements are conducted at University Clinical Center of Kosova during January, February and March 2012, Department of Radiotherapy (first Cancer Centre in our Country). To follow in continuous the ionization on the central beam axis and the variation of dose profile, measure will be realized in a water phantom with two ionization chambers. The first ionization chamber moving is used for measure and the second (reference ionization chamber) fixed, placed in beam size, serves to correct the first ionization chamber measures by fluency variation of primary beam (pulsed photon beam). To study the energy and geometrical parameters on the dose distribution in the medium, we will create different field sizes, the Source Skin Distance (SSD) and the photon beam energy. The influence of these parameters will be evaluated by the measure of Percent Dose Depth (PDD) and Dose Profile (DP). According to the dosimetry protocol in International Atomic Energy Agency (IAEA), Technical Reports Series (TRS) 277 [8], the absorbed dose is defined by [9]
 (1)
(1)
 = non corrected measure
 = absorbed dose to air calibration factor
 = stopping-power ratio water to air
 = factor to allow for non-water equivalence of the ionization chamber.
 = factor to take account of non-air equivalence of the material in the central electrode of an ionization chamber.
 = factor that accounts for the effect of replacing a volume of water with the detector cavity when the reference point of the chamber is taken to be at the chamber center.
The absorbed dose to water varies with the energy because S and pu vary with the energy. For a photon beam which traverses a medium, the fluency decreases with increasing the depth but its energy stay practically constant. So, for a photon beam, the PDD curve in ionization merges with the PDD curve in dose.
2. Material
Linear Accelerator, Siemens, Primus 5472, with 82 MLC Computerized 3-D water phantom of multi-data system was used. The measurements were made through PTW Three ionization chambers:
-PTW Pin Point Chamber TM 31010-1046
-PTW Pin Point Chamber TM 30010-0358 (Reference Chamber)
-PTW Markus Chamber TM 23343-3809 (for electrons)
-PTW Water Tank Phantom.
We used MEPHYSTO (PTW) version 7.4 software to analyze beam profiles parameters. The parameters analyzed are Homogeneity, Symmetry, Penumbra sizes, Field Size, CAX Dev, Pen left, Pen Right, Dmax, Dmin, Quality, etc as we can read in each figure. We have conducted measurements for all profiles for PDD, Dose Depth Curve, Open Collimator Factor (OCF) for photons 100 cm and 105cm, SSD, and field size with dimension: (3 × 3) cm2, (4 × 4) cm2, (5 × 5) cm2, (7 × 7) cm2, (10 × 10) cm2, (15 × 15) cm2, (20 × 20) cm2, (25 × 25) cm2, (30 × 30) cm2, (35 × 35) cm2 and (40 × 40) cm2, with the following wedge angels: 15˚, 30˚, 45˚ and 60˚. Also we make a measurement for all energies for electron. In this paper we only show results for:
1) Percent Depth Dose
6 MV photon beam, (10 × 10) cm2 field size and 100 cm SSD (Source Skin Distance)
15MV photon beam, (10 × 10) cm2 field size and 100 cm SSD 6 & 15MV photon beam, for different field size, 100 cm SSD
2) Dose Profile
6 MV photon beam, (10 × 10) cm2 field size, 10 cm depth and 100 cm SSD 15 MV photon beam, (10 × 10) cm2 field size, 10 cm depth and 100 cm SSD 6 & 15 MV photon beam, X, Y dose profile for different field size.
3. Results
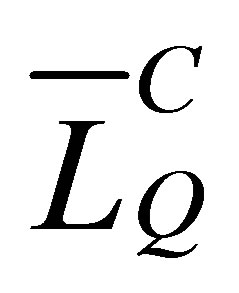
Dose distributions along the beam central axis give only part of the information required for an accurate dose description inside the patient. Dose distributions in 2-D and 3-D are determined with central axis data in conjunction with off-axis dose profiles. In the simplest form, the offaxis data are given with beam profiles measured perpendicularly to the beam central axis at a given depth in a phantom. The depths of measurement are typically at zmax and 10 cm for verification of compliance with machine specifications, in addition to other depths required by the particular treatment planning system (TPS) used in the department [10]. PDD values were measured for different field sizes in the phantom and for different SSD - The PDD curves for 15 MV, 6 MV with field size 10 × 10 and 6 & 15 MV for different filed size together with analyse profile are shown in Figures 1-3. Dose profile for 15 MV, 6 MV, field size 10 × 10 and 6 & 15 MV for different filed size together with analyse profile, are shown in Figures 4-6.
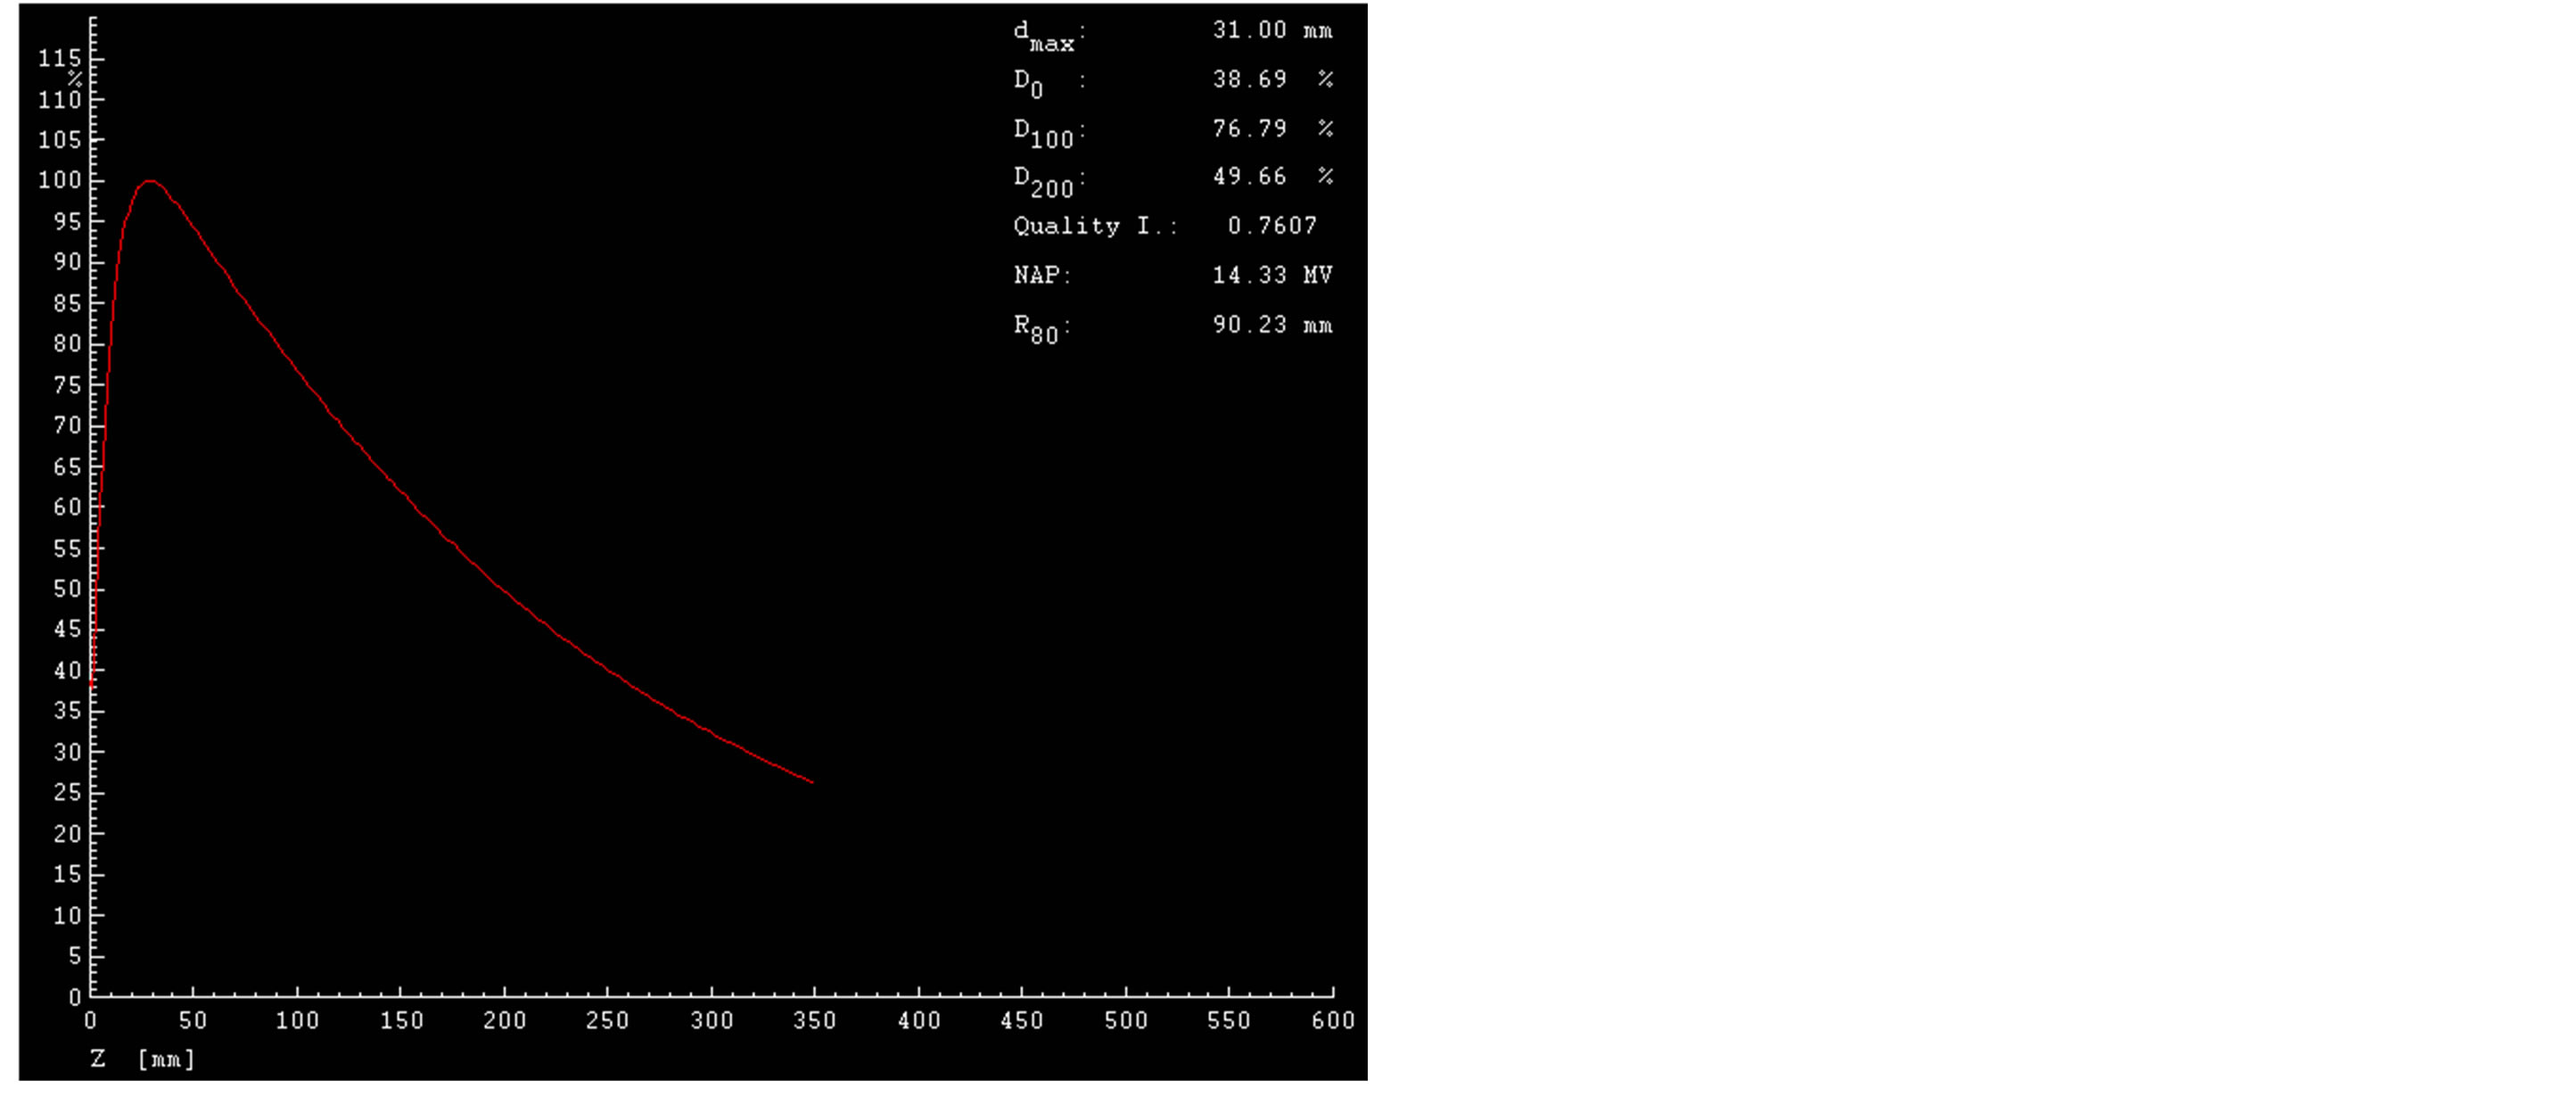
Figure 1. Percent Dose Depth (PDD) for 15 MV, field size (10 × 10) cm2, SSD 100 cm.
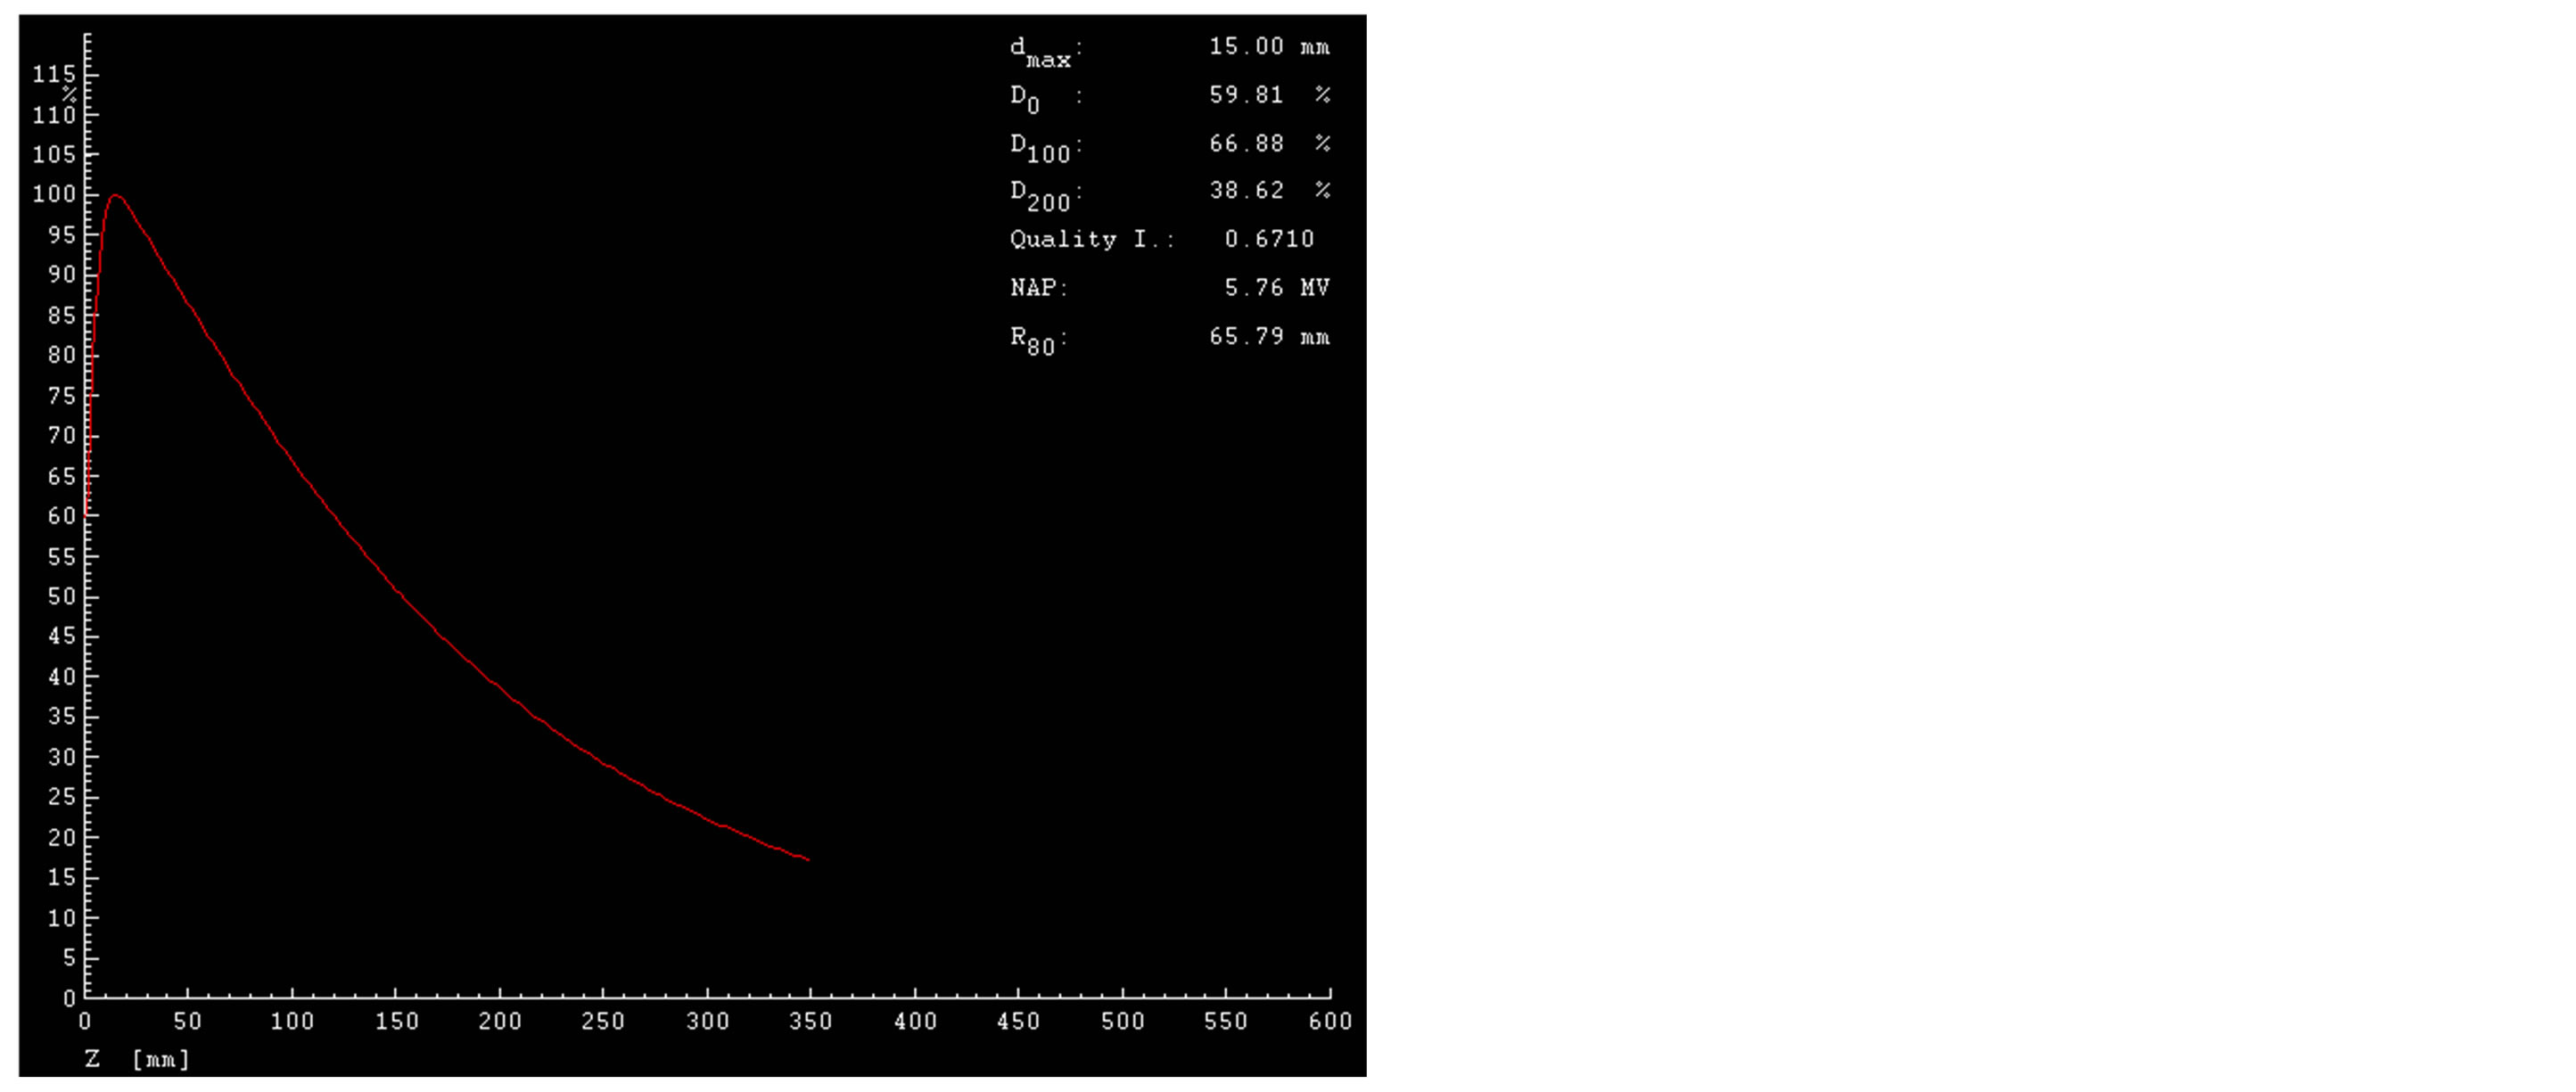
Figure 2. Percent Dose Depth (PDD) for 6 MV, field size (10 × 10) cm2, SSD 100 cm.
Figure 3. Percent Dose Depth (PDD) for 6 & 15 MV, field size (10 × 10) cm2, SSD 100 cm.
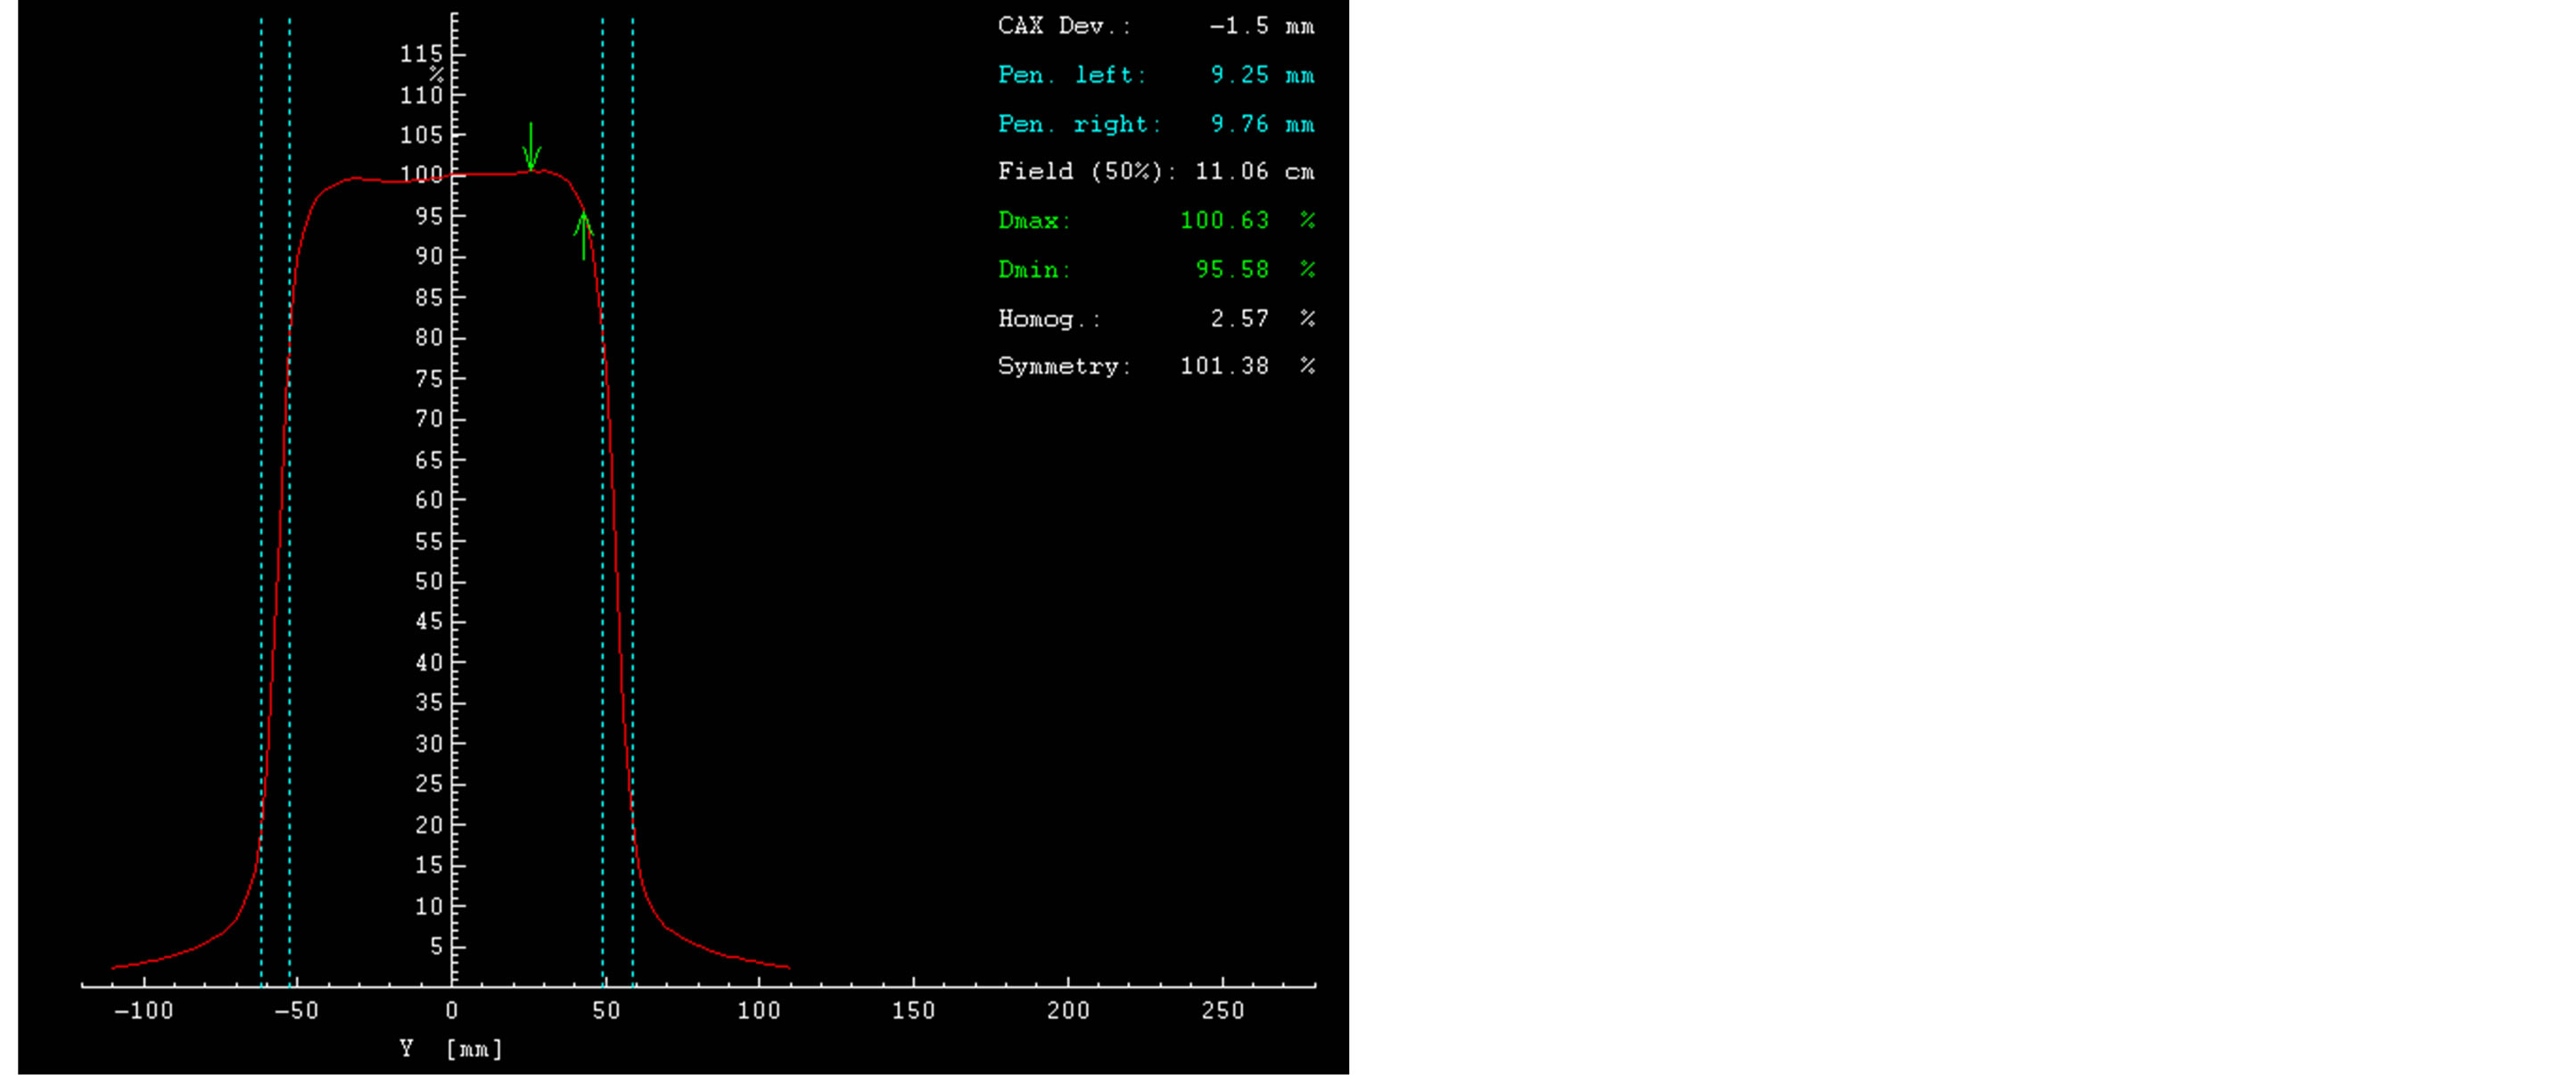
Figure 4. Dose Profile curve 15 MV, SSD 100 cm, field size (10 × 10) cm2.
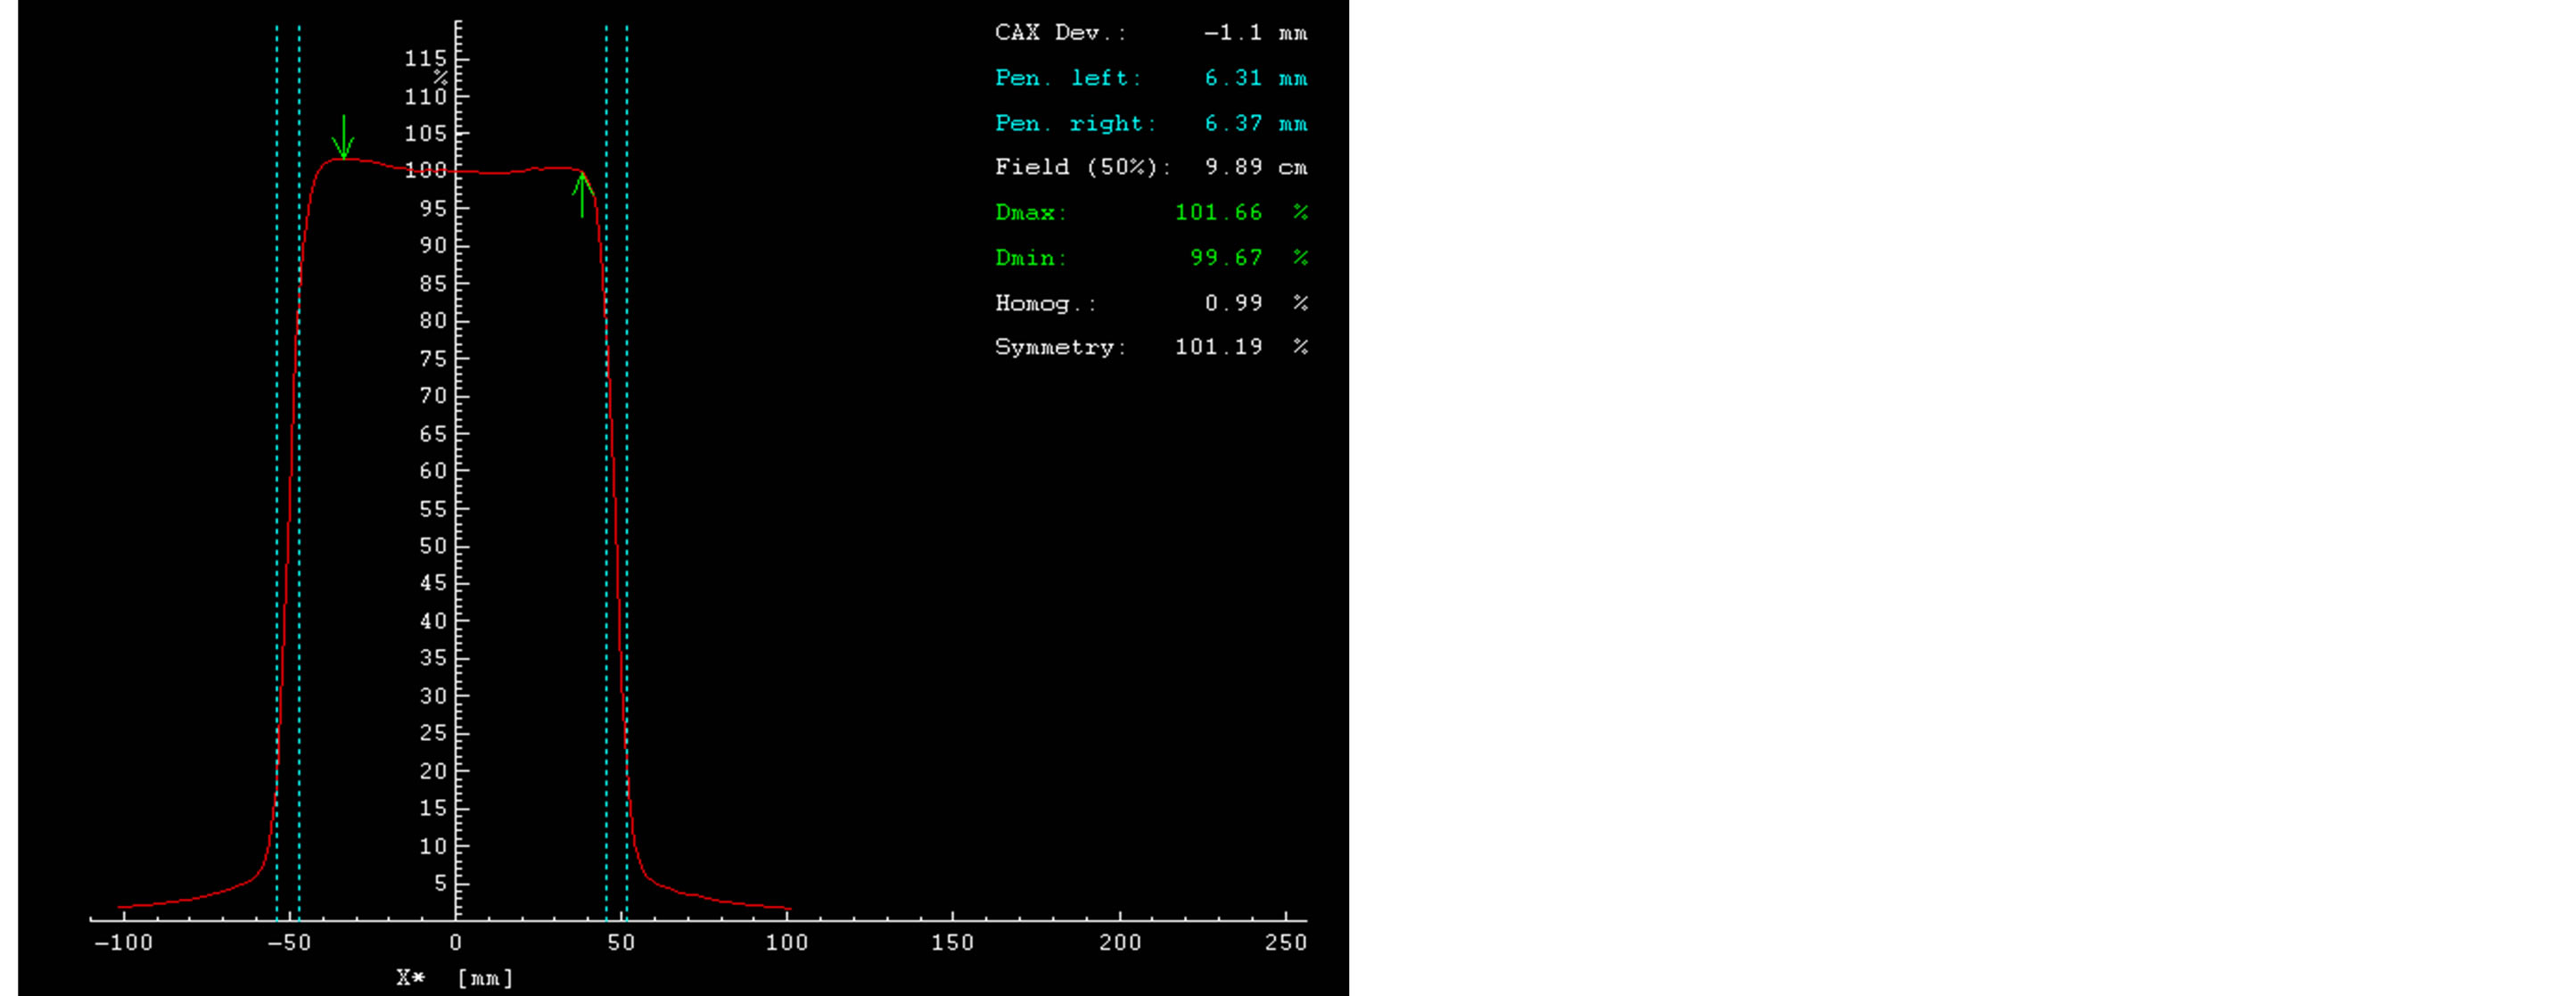
Figure 5. Dose Profile curve 6 MV, SSD 100 cm, field size (10 × 10) cm2.
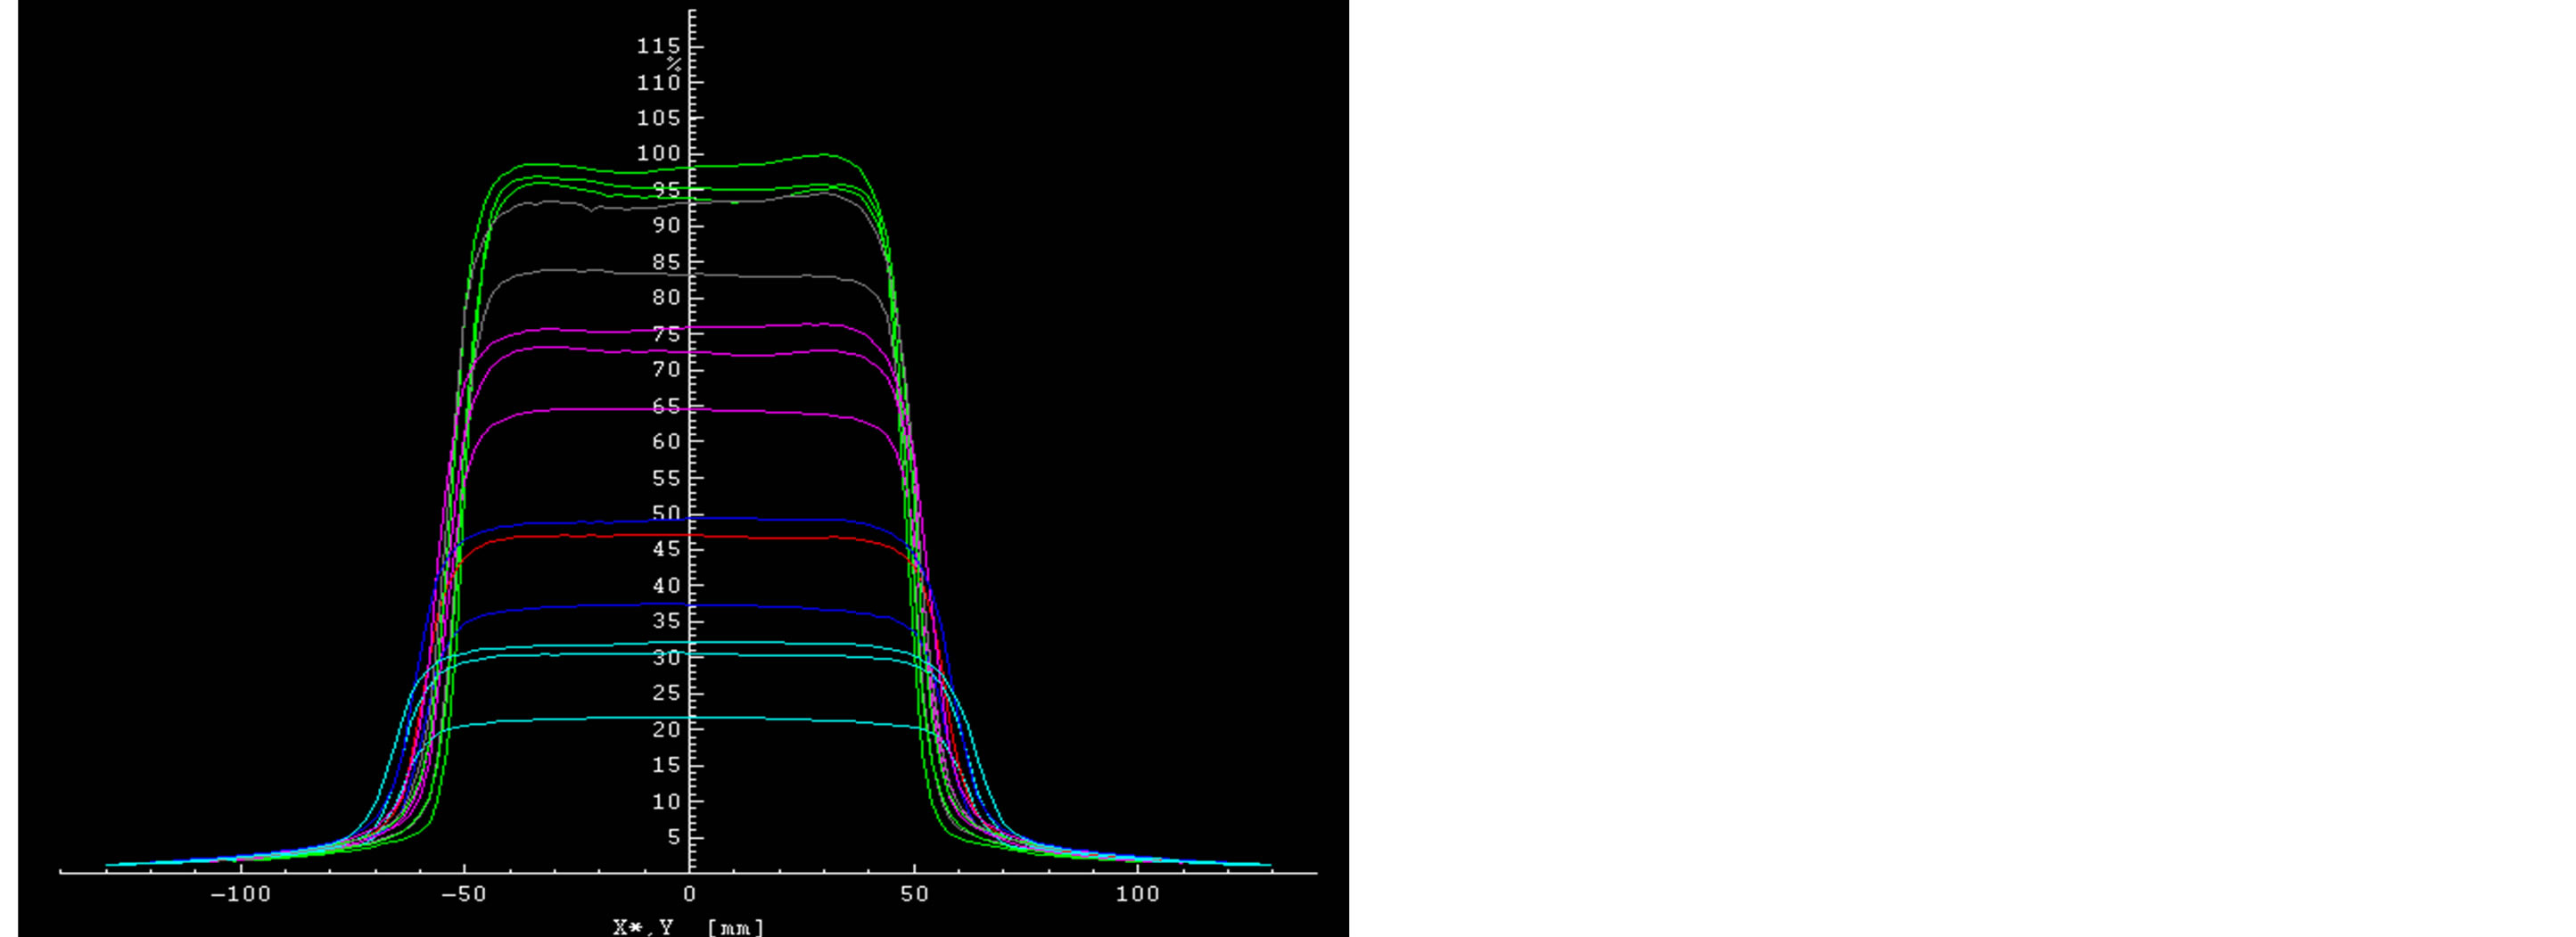
Figure 6. Dose Profiles for 6 & 15 MV photon beam, X, Y profile for different field size.
4. Conclusion
Today, the use of radiotherapy Treatment Planning Systems (TPS) is inevitable. Beam profile and PDD are the parameters used to verify the dose calculation algorithms of TPS [11]. The study of photon and electron beam characteristic is necessary before calibration machine. Knowledge of energy and geometrical influence on different dosimetric parameters is indispensable for absorbed dose calculations. We have also conducted the TLD measurements which were audited and accepted by IAEA. After that all of these measurements and profiles for photons and electrons we have installed in our Treatment Planning System XiO, version 4.7.0 by which we make a treatment planning for radiation. The following aspects of the 6 and 15 MV plans for each patient were compared isodose distributions for the PTV and GTV: dose-volume histograms and dose parameters [12].
REFERENCES
- K. A. Gifford, D. S. Followill, H. H. Liu and G. Starkschall, “Verification of the Accuracy of a Photon DoseCalculation Algorithm,” Journal of Applied Clinical Medical Physics, Vol. 3, No. 1, 2002, pp. 26-45. http://www.jacmp.org/index.php/jacmp/article/viewFile/2589/1057
- J. V. Ramírez, T. Marques, F. Chen, P. Nicolucci and O. Baffa, “Percentage Depth Dose Curves Comparison between L-Alanine Minidosimeters, Radiographic Film and PENELOPE Monte Carlo Simulation for a 60Co Beam,” 2012. http://www.irpa12.org.ar/fullpapers/FP3334.pdf
- H. Kato, S. Fujii and S. Suzuki, “Method of Calculating Percentage Depth Dose for Diagnostic X-Rays,” Nippon Hoshasen Gijutsu Gakkai Zasshi, Vol. 60, No. 8, 2004, pp. 1107-1115. http://www.ncbi.nlm.nih.gov/pubmed/15389168
- S. A. Buzdar, M. A. Rao and A. Nazir, “An Analysis of Depth Dose Characteristics of Photon Beam in Water,” Journal of Ayub Medical College Abbottabad, Vol. 21, No. 4, 2009, pp. 41-45. http://www.ncbi.nlm.nih.gov/pubmed/21067022
- T. J. Jordan, “Megavoltage X-Ray Beams: 2-50 MV,” BJR Supplement, Vol. 25, 1996, pp. 62-109. http://www.ncbi.nlm.nih.gov/pubmed/9068357
- M. Ravikumar and R. Ravichandran, “Dose Measurements in the Build-Up Region for the Photon Beams from Clinac-1800 Dual Energy Medical Linear Accelerator,” Strahlentherapie und Onkologie, Vol. 176, No. 5, 2002, pp. 223-228. http://link.springer.com/article/10.1007/s000660050004 http://dx.doi.org/10.1007/s000660050004
- A. Wambersie, H. G. Menzel, R. A. Gahbauer, D. T. Jones, B. D. Michael and H. Paretzke, “Biological Weighting of Absorbed Dose in Radiation Therapy,” Radiation Protection Dosimetry, Vol. 99, No. 1-4, 2002, pp. 445-452. http://www.ncbi.nlm.nih.gov/pubmed/12194351 http://dx.doi.org/10.1093/oxfordjournals.rpd.a006829
- International Atomic Energy Agency (IAEA), Technical Reports Series (TRS) 277, “Absorbed Dose Determination in photon and Eletron Beam,” Viena, 1987. http://www-pub.iaea.org/books/IAEABooks/1380/Absorbed-Dose-Determination-in-Photon-and-Electron-Beams-An-International-Code-of-Practice
- J. E. McGary, B. S. Teh, E. B. Butler and W. Grant, Journal of Applied Clinical Medical Physics, Vol. 3, No. 1, 2002.
- E. B. Podrosak, “Radiation Oncology Physics. A Handbook for Teachers and Students,” p. 194. http://www-pub.iaea.org/books/IAEABooks/7086/Radiation-Oncology-Physics-A-Handbook-for-Teachers-and-Students
- M. J. T. Birgani, N. Chegeni, S. Arvandi, S. R. Ghalaee, M. Zabihzadeh and D. Khezerloo, “Analytical Approach for Determining Beam Profiles in Water Phantom of Symmetric and Asymmetric Fields of Wedged, Blocked, and Open Photon Beams,” Journal of Applied Clinical Medical Physics, Vol. 14, No. 6, 2013. http://www.jacmp.org/index.php/jacmp/rt/metadata/4424/0
- L. Wang, E. Yorke, G. Desobry and C. S. Chui, “Dosimetric Advantage of Using 6 MV over 15 MV Photons in Conformal Therapy of Lung Cancer: Monte Carlo Studies in Patient Geometries,” Journal of Applied Clinical Medical Physics, Vol. 3, No. 1, 2002, pp. 51-59. http://www.ncbi.nlm.nih.gov/pubmed/11818004 http://dx.doi.org/10.1120/1.1432862
NOTES
*Corresponding author.