American Journal of Plant Sciences
Vol.07 No.17(2016), Article ID:73169,26 pages
10.4236/ajps.2016.717220
Study on Plant Diversity of Mountain Areas of Yangmeikeng and Chiao,
Hong Liang1, Yuyuan Huang2*, Shizhen Lin2, Kangsai Zhao1, Yufeng Zou2, Xinfan Yu1,2, Lijun Yang1*, Wang Xu1, Zhu Ming1, Zhibin Zhou1
1Shenzhen Environmental Monitoring Center, Shenzhen, China
2College of Life Sciences, Zhongkai University of Agriculture and Engineering, Guangzhou, China

Copyright © 2016 by authors and Scientific Research Publishing Inc.
This work is licensed under the Creative Commons Attribution International License (CC BY 4.0).
http://creativecommons.org/licenses/by/4.0/


Received: June 13, 2016; Accepted: December 27, 2016; Published: December 30, 2016
ABSTRACT
In this study, Yangmeikeng mountain area with a long-term natural restoration status (communities 1, 2, and 3) and Chiao mountain area with an artificially disturbed status (communities 4 and 5) in Shenzhen in China were subjected to plant community composition and diversity statistical analysis on the basis of the following indices: plant height; density; tree layer DBH; coverage; number of family, genus, and species; calculated diversity indices; richness; similarity coefficients of family, genus and species; and species evenness. The diversity levels of each index in each community were compared, and the relationships of family, genus, and species in the communities with one another were determined. The integrated diversity levels in the two areas were also analyzed. Results showed that the composition status of three communities, especially communities 2 and 3, which were located at high elevation, in Yangmeikeng with the long-term natural restoration status was better. The diversity values were also evidently higher. The vegetation composition in Yangmeikeng was also greater than that in Chiao. The integration status of numerous diversity indices, such as evenness and richness, was higher than that of the latter. These data could be used as a basis for arguments regarding the status of natural and artificial forest biodiversities. Many species in the community in artificial forests were shrubs and herbs. The richness and proportion of tree species were distinctly low. Thus, shrubs and herbs were the main components of the artificial interference community. The number and richness of the tree species in natural or long-term natural restoration forests were higher than those of the former. The family diversity Df of the three communities in Yangmeikeng was slightly lower than that of the two communities in Chiao. By contrast, the genus diversity Dg, family richness, and genus richness in Yangmeikeng were higher than those in Chiao. In terms of α-diversity and similarity coefficient, family, genus, and species were not directly related to one another. Therefore, species, genus, and family composition should be combined with their diversity status in the statistical and biodiversity analysis of a community. Synthetic diversity indices should be further analyzed to evaluate the diversity status of a community objectively.
Keywords:
Diversity, Community, Family, Genus, Species, Ecosystem

1. Introduction
With the rapid economic development in Shenzhen for more than 30 years, the ecosystem and biodiversity in this city have been greatly affected, but the specific effects have yet to be determined. Biodiversity has emerged as an issue because of an increase in extinction rates caused by human activities [1] , and several extensive experiments [2] [3] [4] [5] [6] have addressed the relationship between biodiversity measured as species richness and ecosystem function. Huston [7] failed to provide evidence on the improvement of ecosystem functions by increasing biodiversity and on the determination of both local species diversity and rate of ecosystem processes, such as productivity, in terms of the amount and variability of the fundamental environmental resources that regulate plant growth and ecosystem processes.
However, highly diverse plant communities comprise a more abundant food web than poorly diverse plant communities. As such, more local animal species are found in the former than in the latter. The ecosystem structure of highly diverse plant communities is also more complex than that of poorly diverse plant communities. Consequently, the ability of the former to resist external invading species is stronger than that of the latter. The productivity and eco-service effects of ecosystems of the former are also higher than those of the latter. Biodiversity is positively correlated with productivity. There is not only a linear relationship between biodiversity and productivity, along with advances in plant communities development and their relationship presented “U”, “S” and so on. As biodiversity increases, productivity increases under certain circumstances that have distinct difference of geographical environment or species characteristic factors. However, productivity decreases when diversity continuously increases. As diversity further increases, productivity also increases. Some are the situations that are curve of the second degree progressive increase or power exponent progressive increase, but diversity and productivity simultaneously reach a constant status when community succession is reached within a certain period [8] - [14] .
Jin’s [14] research results showed that in the forests planting for ecosystem restoration in recent 20 years, between herb plant diversity (x) and productivity (y), the power exponent progressively increased: y = axb; the relationship between shrub species diversity (x) and productivity (y) was: v = ab2 − bx + c; when the restoration period reached to 20 - 40 years, between the herb and shrub plant diversity (x) and productivity (y), the power exponent progressively increased: y = axb; when the forests restoration was over 40 years, the diversity (x) of herb, shrub and tree all layers plant with productivity (y) began to show the relation of power exponent progressive increase: y = axb. Qin et al. [10] researched result on the relationship community plant diversity with productivity was also justified aforementioned viewpoint.
Some regional test results and measured data couldn’t prove that biodiversity and high or low community productivity were related, even if it showed negative correlation, because those measured data only come from herb plants in the special geographic environment such as grassland, and research period span of community succession was insufficient. For instance, research measurement is usually terminated when productivity declines, but data are not measured when productivity increases. Thus, local geographical and microenvironment characteristics, species characteristics, and succession stages should be considered to determine the relationship of biodiversity with ecosystem productivity and system stability. Furthermore, a long-term investigation should be conducted to obtain a more reasonable and accurate judgement.
There were some researches about the vegetation structure and plant diversity in Shenzhen. Yin et al. [15] investigated mountain vegetation through a diversity study on the Shenzhen park greenbelt carried out part areas plant community structure research. Liu et al. [16] investigated the Acacia mangium plantation in Phoenix Mountain and determined the plant community structure in Danan Mountain [17] . Zhang et al. [18] examined the diversity of Syzygium odoratum community in Dapeng Peninsula, Shenzhen. Kang et al. [19] evaluated the plant types and community characteristics in Bijiangshan Park, Shenzhen. Wang et al. [20] evaluated the species diversity and succession status in natural forest communities in the Nanshan District of Shenzhen. Previous studies, measurement, and analyses focused on several or approximately ten communities in a narrow scale. Chen et al. [21] further explored communities to divide several broad-leaf forest types by selecting samples that mainly represent several community types.
Shenzhen is a large area with more than 10 districts and new management districts. Thus, studies have been rarely performed and the effects of urbanization on biodiversity in each region in Shenzhen have yet to be fully understood. As such, further systematic investigation should be conducted regarding plant biodiversity status, patterns and relations between them, ecosystem structure status, and vegetation’s ecological effect on Shenzhen. This study is a comparative research on plant diversities in Yangmeikeng mountain area of Dapeng New District and in Chiao mountain area located inside the reservoir in Pingshan New District, Shenzhen. The effects of artificial factors on plant diversity were determined to understand the plant composition, structural status, anthropogenic disturbances, and effects on vegetation on the mountain region around Shenzhen. This study provided a scientific reference for the development of scientific, reasonable, and ecological construction strategies in Shenzhen and effective measures to protect urban ecosystem and biodiversity. This study also established a theoretical reference for other cities and regions to design strategies that protect urban biodiversity, and could be used as a guide to investigate urban biodiversity in forest mountainous areas.
2. Methods
2.1. Study Area
Shenzhen is located in the subtropical region of Southern China and adjoins Hong Kong. In summer, it is influenced by the southeast monsoon, causing high temperature and rainy season; in winter, it is influenced by the northeast monsoon, triggering northeast trades and northern cold, and sometimes climate is slightly colder. The average annual air temperature is 22.4˚C, the highest monthly mean temperature is 28.1˚C, and the lowest monthly mean temperature is 12.1˚C. The frost-free season is 355 days. In May to September of every year, the period is rainy season, and often several typhoons occur. The annual maximum rainfall is 2662.2 mm, and the average annual precipitation is 1966.5 mm. The average annual sunshine hours is 1934 h, and the relative humidity is higher, with an average annual relative humidity of 77%. The climate is suitable for subtropical plants and a part of tropical plants growth.
From 2007, an ecological monitoring system began to be constructed in Shenzhen. In January 2013, the Shenzhen Ecological Monitoring Center Station, located in Yangmeikeng of Dopeng New District overlooking the sea, was built. In July 2013 to March 2014, authors first conducted research to the mountain area vegetation of Yangmeikeng, in the eastern slope, from the sea beach along the hill slope upward. Three different altitude plant communities were investigated. Their longitude and latitude angles and altitudes are as follows: community 1. Macaranga sampsonii―Rhodomyrtus tomentosa―Carex cruciata community, 22˚32'25.23"N, 114˚35'0.95"E, altitude 110 m; community 2. Machilus velutina―Psychotria rubra―Pandanus oustrosinensis community, 22˚32'18.69"N, 114˚34'53.73"E, altitude 125 m; community 3. Schefflera octophylla―Psychotria rubra―Adiantum capillus-junonis community, 22˚32'34.69"N, 114˚ 35'0.02"E, altitude 180 m. Formed a height gradient.
Chiao, Tianxin Mountain in Pingshan New District, Shenzhen, is located inside a reservoir chose 2 hill area communities: community 4. Litchi chinensis―Schefflera octophylla―Blechnum orientale community, 22˚39'38.21''N, 114˚22'0.05''E, altitude 72 m, and community 5. Eucalyptus robusta―Rhodomyrtus tomentosa―Dicranopteris pedata community, 22˚39'41.41''N, 114˚22'15.87''E, altitude 85 m, made investigation.
The geographical places of the five communities in the two areas are shown in Figure 1.
2.2. Methods of Measurement
Every community quadrat area of more than 700 - 800 m2, every community investigation was conducted in not less than 3 quadrats, with every quadrat size ranging from 200 m2 to 300 m2. To understand the situation of the dominant species of every layer of

Figure 1. Geographical places of the five communities in the two areas.
communities, the species name, individual number, plant height, DBH (only tree), and coverage of tree, shrub, and herb layers. The shrub layer was set up 4 - 7 smaller quadrats inside above tree layer big quadrat, with every small quadrat area 4 m × 4 m; the herb layer was set up four 1 m × 1 m small quadrats inside every shrub layer quadrat. According to Ouyang [22] method, woody plants, which are higher than 4 m, were classifies as tree layer, and those below 4 m were classified as shrub layer (include the seeding of tree). Then the diversity, evenness, and richness indices were calculated and analyzed.
For species identification, all species were collected to the characteristics of their flowers, leaves, stems, and fruits or seeds. Reference books, such as Flora of China, Flora of Guangdong, Flora of Shenzhen, Flora of Guangxi, Flora of Hainan and so on, were used to check the specimens’ characteristics, with the identification retrieval table.
2.3. Data Analysis
2.3.1. Diversity Index
1) Simpson index of species

 (as same at below) (1)
In the formula, S is the number of species; Ni is the number of individual species I; and N is the number of individual of all species. The index is only used to calculate the species diversity, and is not related to any diversity situation on family and genus.
The Simpson index of improved pattern of species is expressed as follows:
 (2)
(2)
where S is the number of species; Ns is the number of individuals of all species; and Nsi is the number of individual species i.
2) Index of genus diversity
According to Pielou [23] and Lloyd [24] on genus and family diversity theory, the genus diversity is calculated as follows (Huang et al. [25] ):
 (3)
(3)
 (4)
(4)
where Ngi is the number of species which belongs to genus I; Ng is the number of all genera; and Dg is the index of genera diversity. If there is only one species and one genus in one community, the numerator and denominator should not be subtracted with 1.
3) Index of family diversity
According to Pielou [23] Lloyd [24] on family diversity theory, family diversity is calculated as follows [25] [26] :
 (5)
(5)
 (6)
(6)
where f is the number of family; Nf is the number of all families; Nfi is the number of genus which belongs to family I; and Df is the diversity index of family of community. If there is only one species and one genus in one community, the numerator and denominator should not be subtracted with 1.
4) Composite diversity index [25] [27] :
 (7)
(7)
 (8)
(8)
where Dc1 and Dc2 are the composite diversity indices of community; Df1 and Df2 are the diversity indexes of families; Dg1 and Dg2 are the diversity indices of genus; and Ds is the diversity index of species (it is not any layer (as tree, herb) index, and is integral value. When Dc is high, the diversity of the community level is also high; meanwhile, the values of Df1, Df2 and Dg1, Dg2, Ds, and their proportion shall show the diversity composition situation. Only when every value of Df, Dg, or Ds are all high, and near equality of their proportion, the community biodiversity is optimum. If only the Ds value is high, or only the Dg, and the other two values are low, the diversity of the community is also low even if the Dc value is high.
5) Shannon-Wiener index
 (9)
(9)
where S is the number of species; Pi is the ratio of species i individuals in all individuals; and H is the species diversity index.
2.3.2. Richness Index
1) Species richness index
Odum index:  (10)
(10)
Menhinnick index:  (11)
(11)
where S is the species index; and N is the number of whole species individuals.
2) Genus richness
According to Pielou [23] on genus and family diversity theory, the genus richness index calculated method [25] :
 (12)
(12)
 (13)
(13)
where G is the number of genus; and S is the number of species; the formula shows that the higher the S value, the lower the diversity, such as in a community in which every genus possessed more species, the whole community will have lower genus diversity. If the number of genera in two communities is the same but each genus comprises one species in community 1, the genus diversity of this community is higher. If each genus includes more than one species or most of the genera contain one species and one or two genera are composed of more than two species in community 2, then its genus diversity is lower than that of community 1.
3) Family richness
According to Pielou [23] on family diversity theory, family diversity is calculated as follows [25] :
 (14)
(14)
 (15)
(15)
F is the number of families while G is the number of genera. The formula shows that when G is higher, diversity is lower. In a community, when each family had more genera, the whole community had lower family diversity. Thus, if the number of families in the two communities was the same, but each family had a genus only in community A, then the family diversity of this community was higher. However, if every family had more than one genus or if most of the families had one genus, but one to two families had more than two species in community B, its diversity was lower than community A.
2.3.3. Pielou Evenness Index:
 (16)
(16)
In the formula,  , S is the number of species; Ni is the indi-
vidual number of species I; and N is the individual number of all species in one layer.
2.3.4. Similarity Coefficient (β-Diversity Index)
1) The similarity coefficient of species (improved pattern) is obtained as follows:
 (17)
(17)
Ns is the number of species commonly existing in communities A and B; as is the number of species in community A; bs is the number of species in community B; and Cs is the similarity coefficient of species.
2) The similarity coefficient of genera in a community is obtained as follows [25] [27] :
 (18)
(18)
cNg is the number of genera commonly existing in communities A and B; ag is the number of genera in community A; bg is the number of genera in community B; and Cg is the similarity coefficient of genera.
3) The similarity coefficient of families in a community is obtained as follows [25] [27] :
 (19)
(19)
Nf is the number of families commonly existing in communities A and B; af is the number of families in community A; bf is the number of families in community B; and Cf is the similarity coefficient of families.
4) Synthetic similarity coefficient of family, genus, and species is obtained as follows [25] [27] :
 (20)
(20)
βc is the synthetic similarity coefficient of family, genus, and species; Nf is the number of common families in the two communities; Ng is number of common genera in the two communities; Ns is the number of common species in the two communities; Nfa is the number of families in community A; Nga is the number of genera in community A; Nsa is the number of species in community A. Nfb is number of families in community B; Ngb is the number of genera in community B; and Nsb is the number of species in community B.
3. Results
All communities were in subtropical evergreen broad-leaved forests, and community names were given according to the dominant species that were of important value in the three layers.
4. Composition of Family, Genus, and Species in the Communities
The Macaranga sampsonii―Rhodomyrtus tomentosa―Carex cruciata community was composed of 17 families: Euphorbiaceae, Leguminosae, Rutaceae, Sabiaceae, Saxifragaceae, Elaeocarpaceae, Rhizophoraceae, Rubiaceae, Myrtaceae, Gramineae, Annonaceae, Cyperaceae, Blechnaceae, Polypodiaceae, Sterculiaceae, Lygodiaceae, and Chloranthaceae; 23 genera: Macaranga, Aporusa, Glochidion, Pithecellobium, Gleditsia, Evodia, Acronychia, Sterculia, Lygodium, Sarcandra, Meliosma, Itea, Elaeocarpus, Carallia, Psychotria, Myrtaceae, Cleistocalyx, Neyraudia, Lophatherum, Uvaria, Carex, Blechnum, and Colysis; and 23 species: Macaranga sampsonii, Aporusa dioica, Glochidion eriocarpum, Pithecellobium clypearia, Gleditsia australis, Evodia lepta, Acronychia pedunculata, Meliosma cuneifolia, Itea chinensis, Elaeocarpus sylvestris, Carallia brachiata, Psychotria rubra, Rhodomyrtus tomentosa, Cleistocalyx operculatus, Neyraudia reynaudiana, Lophatherum gracile, Uvaria microcarpa, Carex cruciata, Blechnum orientale, Colysis diversifolia, Sterculia lanceolata, Lygodium japonicum, Sarcandra glabra.
Among them, Euphorbiaceae had three species, while other families had only one or two species. All other genera had only one species, showing that genus had a higher diversity.
In Machilus velutina―Psychotria rubra―Pandanus oustrosinensis community, was composed of 25 families: Lauraceae, Euphorbiaceae, Leguminosae, Elaeocarpaceae, Ebe- naceae, Theaceae, Rutaceae, Sterculiaceae, Moraceae, Palmae, Annonaceae, Rubiaceae, Boraginaceae, Thymelaeaceae, Rhamnaceae, Saxifragaceae, Blechnaceae, Gleicheniaceae, Liliaceae, Lygodiaceae, Pteridaceae, Pandanaceae, Adiantaceae, Dilleniaceae, and Aquifoliaceae; and 31 genera: Glochidion, Sapium, Pithecellobium, Litsea, Elaeocarpus, Diospyros, Camellia, Machilus, Cassia, Acronychia, Sterculia, Ficus, Calamus, Fissistigma, Uvaria, Psychotria, Gardenia, Adina, Cordia, Aquilaria, Berchemia, Itea, Blechnum, Dicranopteris, Ophiopogon, Lygodium, Pteris, Pandanus, Adiantum, Tetracera, and Ilex. The species composition was richer, had 33 species, they were: Glochidion puberum, Sapium discolor, Pithecellobium clypearia, Pithecellobium lucidum, Litsea cubeba, Elaeocarpus sylvestris, Diospyros eriantha, Camellia oleifera, Machilus velutina, Cassia fistula, Acronychia pedunculata, Sterculia lanceolata, Ficus variolosa, Ficus variolosa, Calamus thysanolepis, Fissistigma oldhamii, Uvaria microcarpa, Psychotria rubra, Gardenia jasminoides, Adina pilulifera, Cordia dichotoma, Aquilaria sinensis, Berchemia lineate, Itea chinensis, Blechnum orientale, Dicranopteris dichotoma, Ophiopogon bodinieri, Lygodium japonicum, Pteris cretica, Pandanus austrosinensis, Adiantum capillus-veneris, Adiantum capillus-junonis, Tetracera asiatica, Ilex chinensis.
In the community, Leguminosae and Rubiaceae had three species in every family, while the other families had one or two species. For genus, except for Pithecellobium and Adiantum, the other genera had only one species.
Plant constitution situation of Schefflera octophylla―Psychotria rubra―Adiantum capillus-junonis community was composed of 27 families: Lauraceae, Euphorbiaceae, Rutaceae, Myrtaceae, Saxifragaceae, Leguminosae, Boraginaceae, Guttiferae, Thymela- eaceae, Annonaceae, Rosaceae, Rubiaceae, Moraceae, Chloranthaceae, Rhizophoraceae, Myrsinaceae, Aquifoliaceae, Sterculiaceae, Adiantaceae, Liliaceae, Gramineae, Gleicheniaceae, Blechnaceae, Lygodiacea, Araliaceae, Theaceae, Connaraceae; 36 genera: Machilus, Litsea, Aporusa, Sapium, Glochidion, Evodia,Zanthoxylum, Syzygium, Myrtaceae, Itea, Dalbergia, Cordia, Cratoxylum, Aquilaria, Fissistigma, Uvaria, Rhaphiolepis, Psychotria, Adina, Gardenia, Canthium, Ficus, Sarcandra, Carallia, Ardisia, Aquifoliaceae, Reevesia, Adiantum, Ophiopogon, Miscanthus, Dicranopteris, Blechnum, Lygodium, Schefflera, Camellia, Rourea; and 39 species: Machilus chinensis, Litsea rotundifolia, Aporusa dioica, Sapium discolor Glochidion puberum, Evodia lepta, Evodia glabrifolia, Zanthoxylum avicennae, Syzygium jambos, Rhodomyrtus tomentosa, Itea chinensis, Dalbergia odorifera, Cordia dichotoma, Cratoxylum cochinchinense, Aquilaria sinensis, Fissistigma oldhamii, Uvaria microcarpa, Rhaphiolepis indica, Psychotria rubra, Adina pilulifera, Gardenia jasminoides, Canthium dicoccum, Ficus hirta, Sarcandra glabra, Carallia brachiata, Ardisia crenata, Ardisia quinquegona, Ilex asprella, Reevesia thyrsoidea, Adiantum capillus-veneris, Adiantum capillus-junonis, Ophiopogon bodinieri, Miscanthus floridulus, Dicranopteris dichotoma, Blechnum orientale, Lygodium japonicum, Schefflera octophylla, Camellia oleifera, Rourea microphylla.
In the community, Euphorbiaceae and Rubiaceae had three and four species, respectively, while other families had only one species. In Evodia, Ardisia, and Adiantum, each genus had two species, while the other genera had only one species, showing that the genus diversity level was lower in the two communities.
Plant constitution situation of Litchi chinensis―Schefflera octopphylla―Blechnum orientale in Chiao hill area were that it had 26 families: Sapindaceae, Araliaceae, Moraceae, Aquifoliaceae, Lauraceae, Anacardiaceae, Euphorbiaceae, Chloranthaceae, Rubiaceae, Leguminosae, Annonaceae, Rosaceae, Sterculiaceae, Gramineae, Blechnaceae, Pteridaceae, Gleicheniaceae, Adiantaceae, Thelypteridaceae, Cyperaceae, Lindsaeaceae, Dicksoniaceaev, Liliaceae, Rutaceae, Melastomataceae, Myrtaceae; 32 genura: Litchi, Cardiospermum, Schefflera, Ficus, Ilex, Machilus, Cinnamomum, Litsea, Rhus, Triadica, Glochidion, Aporusa, Sarcandra, Psychotria, Hedyotis, Pithecellobium, Desmos, Rhaphiolepis, Helicteres, Blechnum, Miscanthus, Pteris, Dicranopteris, Adiantum, Cyclosorus, Carex, Lindsaea, Cibotium, Dianella, Sarcandra, Melastoma, Rhodomyrtus; 36 species: Litchi chinensis, Cardiospermum halicacabum, Schefflera octophylla,, Ficus variolosa, Ficus hirta, Ilex asprella, Cinnamomum camphora, Machilus chinensis, Cinnamomum burmannii, Litsea rotundifolia var. Oblongifolia, Rhus chinensis, Triadica cochinchinensis, Glochidion eriocarpum, Aporosa dioica, Sarcandra glabra, Psychotria asiatica, Hedyotis acutangula, Pithecellobium clypearia, Desmos chinensis, Rhaphio- lepis indica, Helicteres angustifolia, Blechnum orientale, Miscanthus floridulus, Pteris semipinnata, Pteris cretica var. Nervosa, Dicranopteris pedata, Adiantum capillus- veneris, Cyclosorus parasiticus, Carex cruciata, Lindsaea odorata, Cibotium barometz, Dianella ensifolia, Sarcandra glabra, Melastoma malabathricum, Melastoma sangui- neum, Rhodomyrtus tomentosa.
In these families, Moraceae, Lauraceae, and Euphorbiaceae had more species, while the other families had one species. For genus, four genera had two species in every genus, while the other genera had only one species.
The composition situation of family, genus and species of Eucalyptus robusta― Rhodomyrtus tomentosa―Dicranopteris pedata community were that there were 18 families: Myrtaceae, Mimosaceae, Araliaceae, Euphorbiaceae, Theaceae, Sapindaceae, Moraceae, Lauraceae, Anacardiaceae, Aquifoliaceae, Rosaceae, Gleicheniaceae, Gramineae, Cyperaceae, Pteridaceae, Adiantaceae, Rubiaceae, Blechnaceae; 21 genura: Eucalyptus, Rhodomyrtus, Acacia, Schefflera, Triadica, Schima, Cardiospermum, Litchi, Ficus, Litsea, Machilus, Rhus, Ilex, Rhaphiolepis, Dicranopteris, Miscanthus, Carex, Pteris, Adiantum, Hedyotis, Blechnum; and 22 species: Eucalyptus robusta, Rhodomyrtus tomentosa, Acacia mangium, Schefflera octophylla, Triadica cochinchinensis, Schima argentea, Cardiospermum halicacabum, Litchi chinensis, Ficus hirta, Litsea rotundifolia var. oblongifolia, Machilus chinensis, Rhus chinensis, Ilex asprella, Rhaphiolepis indica, Dicranopteris pedata, Miscanthus floridulus, Carex cruciata, Pteris cretica var. Nervosa, Pteris semipinnata, Adiantum capillus-veneris, Hedyotis acutangula, Blechnum orientale.
Myrtaceae, Lauraceae, and Pteridaceae had two species in each family, the other families had one species, and the other genera had only one species in each genus, except Pteris.
4.1. α-Diversity Index
The analysis on diversity, richness, and evenness of every community in every layer is presented in Table 1.
In Table 1, the integration circumstance of the two diversity indices, evenness and richness, in Yangmeikeng was higher than that of Chiao. Although integral indices of community 1 were closer to those of community 4 and a slightly higher than those of community 5, the tree layer indices were distinctly higher than those in communities 4 and 5. Because the tree layer was obviously more abundant, even surpassing shrub and herb layer biomass by more than ten times, major and dominant positions should be established to maintain ecosystem stability and other ecological effects. In the communities of Yangmeikeng, the diversity of the S. octophylla―P. rubra―A. capillus unonis community was highest, probably because the altitude of the place was suitable for the growth and reproduction of more species.
The diversity indices of families and genera of every community are shown in Table 2.

Table 1. The ecological indices of species diversity in every layer.
Table 2. The diversity indices of family, genus of every community
In Table 2, for family and genus, the diversity values of the three communities were slightly lower than those in Chiao, although the number of families, especially that of community 3, was higher. However, the two values of diversity were at the medium level, and were slightly lower than those in communities 4 and 5 of Chiao. The study results showed that only species diversity did not more generally reflect the extent of genetic difference and richness of plants and animals in the local community, and that research and analysis on the composition of family and genus should be preferred. Community 3 had the highest number of families and genera, but its diversity value was at the medium level. This demonstrated that every family and genus had more species, thereby reducing the value.
Richness values Rf1 and Rg1 were the highest in community 3, with the two indices being the only earnest statistic of individual number. However, a flaw was seen in their ability to better reflect the genus or species number of every family and genus. Therefore, using Rf2 and Rg2 can better reflect these characteristics. Ds was slightly lower, but Dg2, Rf2, and Rg2 were higher, in community 3 than in communities 4 and 5. As a result, some families had more species, but the situation of genus was better, which means that every genus had only one or very few species.
For the number of species in every layer of the communities, see Figure 2 and Figure 3.
In Figure 2, the number of tree species in communities 1, 2, and 3 of Yangmeikeng were apparently higher than that in the two communities of Chiao. The number of species in community 1 was twice that in community 5 and was 1.66 times that in community 4, whereas the number species in communities 2 and 3 were over twice that in communities 4 and 5, respectively. Moreover, the number species in community 2 was almost 3 times that in community 5. Regarding shrub species number, the advantage of Yangmeikeng communities was apparent, even when community 1, which had a fewer number of species, was only one species less than community 5. In addition, community 2 was higher than community 5, while community 3 was higher than communities
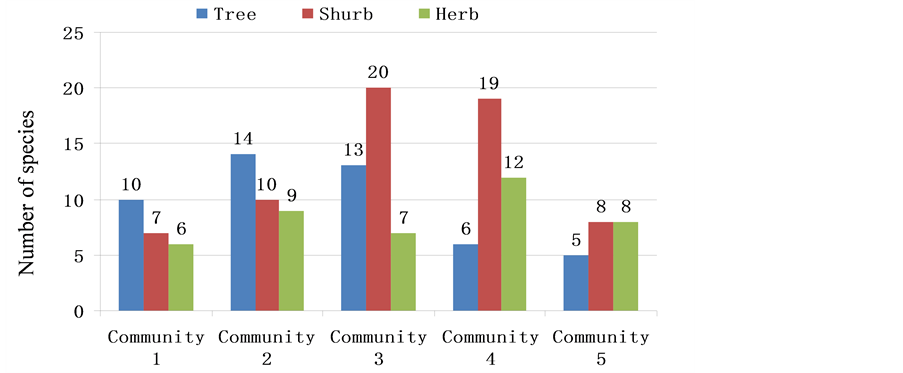
Figure 2. Number of species of tree, shrub and herb.
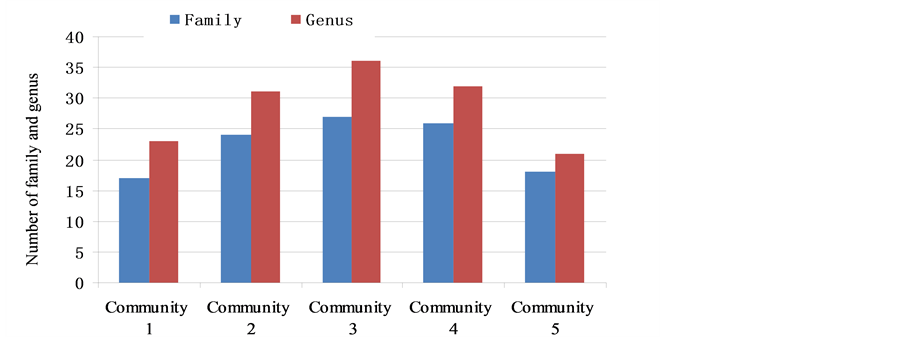
Figure 3. The number of family, genus (Rf1, Rg1).
4 and 5. As seen in community 4, although the number of species reached 19, it was lower than that in community 3, but was higher than that in communities 1 and 2. In the two communities of Chiao, most of the species were shrub and herb, while the number of tree species and its proportion were distinctly low, indicating that in the man-made interference community, shrub and herb were the main components. Therefore, to compare the diversity of natural or half-natural forests with that of artificial forests, analysis should be done on not only the diversity index, but also species proportion and composition in every layer.
Figure 3 shows the number of families and genera in every community. In the two places, the number of families in community 1 of Yangmeikeng was one family less than that of community 5, and 9 families less than that of community 4 of Chiao. However, community 3 had a higher number of families than communities 4 and 5. The number of genera of community 1 was lower than that of community 4, while, in the two other communities, community 2 was one genus lower than community 4, but more than 10 genera higher than community 5. All values in community 3 were higher than those in communities 4 and 5.
The number of families and genera showed that several communities of Yangmeikeng were better than community 5 of Chiao, while community 2 was closer to community 4 of Chiao and community 3 was higher than community 4. Because genus number in every family and species number in every genus were fewer, or the proportions of genus or species in every family and genus were more even, the family and genus diversity indices (Df, Dg, Dc, J, Rf2, and Rg2) of Yangmeikeng were all higher than those of Chiao. Only some indices of community 1 were lower than those of community 4 and closer to those of community 5. However some other indices, such as Dg and Rg, were higher than those of community 5, and even higher than those of community 4.
Of course, as observed, the number of families and genera in the communities of the two research areas had differences. However, these do not represent the similarity or difference of the families and genera of each of the five communities. This is the reason for making a β-diversity analysis. Along with geographic position, the composition situation of family and genus was changed to provide an opportunity for increased biodiversity with respect to the composition of the entire region’s ecosystem.
4.2. β-Diversity Index
The similarity coefficients of species in each community are shown in Table 3.
As seen in Table 3, the similarity coefficient values between community 1 and the other communities were generally lower, ranging from 0.1 to 0.2, while those between community 2 and community 3 were higher, reaching 0.4722. This showed that although the two communities’ altitudes were different, they had more common species. In addition, when passing through the transition region between the two areas, the dominant species of two communities and some other species were different. Moreover, the similarity coefficient values between community 2 and the two other communities, at a distance of several tens of kilometers, were very small, with the value between community 2 and community 4 being only 0.2319. Subsequently, the value between community 2 and community 5 was distinctly lower than that of community 4, being 0.1454. However the value between Yangmeikeng community 3 and community 4 was very high, reaching 0.7333, a problem well worth studying. They also had a better similarity between community 3 and community 5, the value being 0.3607. Each of the two communities of Chiao had higher coefficient values.
The similarity coefficient values of family and genus in every community is presented in Table 4 and Table 5.
Synthetic similarity coefficient (βc) of family, genus, and species are shown in Table 6.
Table 3. Similarity coefficients of species in each community.
Table 4. The similarity coefficient of family.
Table 5. The similarity coefficient of genus.
Table 6. Synthetic similarity coefficient (βc) of family, genus, and species.
In Tables 3-5, the similarity coefficient values of species were lowest, values of family were highest, and the values of genus were at the middle position except in few situations. Moreover, the synthetic similarity coefficient (βc) was able to accurately show the extent of similarity or difference between every community with regard to genetics and composition.
5. Discussion
Analyzing the five communities, the Simpson index (Ds) and Shannon-Wiener index (H) in every layer of the three communities in Yangmeikeng, specially the tree layer, were obviously higher than those in the two communities of Chiao. Community 3, S. octophylla―P. rubra―A. capillus-junonis, had the highest diversity index value, with the number of species reaching 39 and indices showing that the difference was smaller in the individual number, distribution, density, and dominance of every species, especially pointing out that this community had 27 families. Although Euphorbiaceae, Rutaceae, and Rubiaceae had 3 or 4 genera while several other families had 2 genera, other families had only 1 species, with the situation being better. With respect to genus, almost all genera had only one species, while only Evodia, Ardisia, and Adiantum had two species, justifying that its genetic difference was more obvious. The characteristics also reflected the richness values of family and genus, which were highest in this community.
Looking at the indices of diversity, richness, and evenness of species grade, the highest synthetic levels were those of community 3, with community 2 being second. The integral values of Ds, H, J, R1, and R2 were 0.9565, 3.3424, 1.4513, 7.7312, and 0.7001 in community 3 and 0.9792, 3.1334, 1.3972, 6.5832, and 0.6822 in community 2, respectively. This showed that the regional vegetation went through about 20 years of long- term protection in the scale of a national geological park, and had a natural recovery. Moreover, the vegetation had good development, the species numbers increased, the individual number of every species increased, and distribution was better. However, in the two communities of Chiao, which had intense artificial disturbance status, diversity, evenness, and richness of species were all obviously lower than those of the former.
Community 4 had the second-most number of species, with 36 species, but the individual number composition and distribution situations were worse. A few species occupied a larger space and had a higher number proportion, while their individual number increased, possessing strong dominance. Moreover, other major species had fragmentary distribution accompanied with little amounts. Hence, its α-diversity index values were obviously lower than those of community 3, and lower than those of community 2, even if its species number was less than that of the former. These indicated that the destructive effect of artificial disturbance to the environment and vegetation was rather prominent.
Community 5 and community 4 had similar situations, and because of the artificial planting of the eucalyptus economic forest, diversity further decreased. Community 5 had a species number of only 22, which was lower than that of community 4 and further lower than those in communities 2 and 3. Moreover, Ds and H were lowest in all communities, while richness values were only slightly higher than those in community 1.
Considering each layer of the communities, we observed that the diversity, evenness, and richness in the tree layers of the three communities in Yangmeikeng were evidently higher than those of the two communities of Chiao. Moreover, even though community 1, which was located in a low-altitude position and had more artificial damage, went through more than 20 years of natural restoration, its values of Ds, H, J, R1, and R2 in the tree layer were obviously higher than those of community 4 in Chiao, which had been planted L. chinensis (a fruit tree). These showed that the diversity of the more artificially disturbed forest was obviously lower than that of a naturally restored or developed forest. When the integral diversity index value of species in the artificially disturbed forest or artificial forest was higher in certain situations, their main contribution would be herb layer or shrub layer. However, the biomass in such a community was evidently lower than that in the community wherein the diversity of the tree layer was high and the structure was good. Thus, its ecological effects in maintaining good structure, function, and service of the ecosystem are obvious low.
The above research results are better evidences and references to the argument on whether natural forests and naturally restored forests, artificial forests, or more artificially disturbed forests had higher biodiversity [28] [29] . The research results showed that plant diversity of natural or long-term naturally restored forests was obviously higher than that of artificial forests or more artificially disturbed forest.
With regard to the diversity of family and genus, Pielou [23] proposed that when researching on community biodiversity, research on family and genus diversity ought to be included. Although he also provided some calculated models on α-diversity of family and genus [23] [24] , only a few people applied them. The major cause was that at that time, some people thought that the current capability of research on species diversity level could not yet well reflect the objective situation. Hence, research on family and genus diversity had been set aside for future work [30] . After about 40 years of research, species level diversity studies had obtained better development and the calculated methods had proven that they could very well reflect the objective situation of species grade biodiversity. Moreover, many researches on genetic material components and structures at molecular biological level had justified that family and genus are the units and grades which could accurately and objectively reflect the relationships between species and between groups with grades higher than species. Although some studies showed that some adjustments should made to the phylogenetic relationship of some families or genera, the family and genus grade positions were thought to be reasonable and were basically not changed [31] - [40] . They have key effects and roles in the research of the relationship between species, plant flora, species immigration, distribution and its correlation with the environment, and the evolutionary process in every group and their relationship each other. Moreover, our research results showed that the extent of species diversity did not represent the extent of family or genus diversity in a community or a wider region. Therefore, we should now give more attention and proper status to family and genus diversity research, which can more reasonably and objectively reflect the biodiversity characteristics of a community or a larger region consisting of several communities.
Looking at the values of Df1 and Df2 in this research showed that community 4 was the highest, but was only a little higher than community 3. The reason was that although community 3 had 27 families, more than community 4 which had 26 families, the former had 36 genera and the latter had 32 genera. Therefore, according to the method of calculating the diversity statistic, the values of family diversity in community 4 should be a little higher than those of community 3 which had a greater species number. However, family richness Rf2 of community 3 was higher than that of communities 4 and 5. With regard to genus diversity, diversity indices (Dg1 and Dg2) of community 3 were higher than those of communities 4 and 5. Moreover, richness values (Rg1 and Rg2) of community 3 were obviously higher than those of communities 4 and 5. The values of Rg1 and Rg2 of communities 1 and 2 were all higher than those of community 5, showing that, with regard to genus, every genus in communities 1 and 2 had very few species and more uniformity, were it not for the phenomenon where one genus had more species. Compared with the family and genus diversity of nine wild cycad forests, most of the Df1 values in the five communities of Yangmeikeng and Chiao were higher. Furthermore, about 80% of Dg1 values of our research were higher than those of the nine wild cycad forests [26] . This showed that the structure and composition of Shenzhen vegetation were better, while those of the wild cycad forest areas need stronger protection.
The situation of community 2, when compared with communities 4 and 5 of Chiao in terms of family and genus diversity and richness, was similar to that of community 3. A more interesting situation was that although community 1 had only 17 families, its values of diversity and richness of genus were also higher than those of community 5 of Chiao, showing that all of its genera had very few species, and their genetic difference was more distinct.
Communities 2 and 3 in Yangmeikeng had higher composite diversity index (Dc1 and Dc2) values than communities 4 and 5 in Chiao, whereas community 1 had slightly lower values than community 4. This showed that natural or half-natural forests of Yangmeikeng had obviously better integral biodiversity than the artificial forest of Chiao.
Above results showed that when analyzing regional biodiversity, the number of family, genus, and species needs to be calculated, while the indices of diversity, evenness, and richness of several grades of family, genus, and species, and the component situation of every layer of vegetation need to be combined. This can lead to a more objective and roundly evaluation.
With respect to β-diversity, the similarity coefficient values of species in the communities showed that the values between community 1 and the other communities were the lowest, or very low, at 0.2 - 0.29. This was a very interesting circumstance. Maybe it was the near-seaside position and low altitude which led to the components of the plant being very different from those of the other communities. Although the altitude of communities 2 and 3 differ by several ten of meters, the similarity coefficient of their species was relatively high, reaching 0.4722, (of course, having more species still caused this difference). This proved that although the altitude changed and geological place difference degree increased, the species components were different, but this difference was less than the values between community 1 and other communities. It also indicated that in the same slope direction, along with the increase in height, more change in species composition in the lower elevation place was seen. An interesting situation was also observed between community 3 and community 4 of Chiao. They were at a distance of more than 40 km, but their similarity coefficient value was higher, reaching 0.7333. As seen in the elevation height, the former was 180 m, the latter was 80 m, vertical height difference was 100 m, and the horizontal distance was about 40 km. Between them was a position probably located near the seaside, a height that was higher in the position with a longer distance to seaside, and a height that was lower and had a more similar environment, resulting in plants adopting a degree that was more closer. Community 3 and community 5 of Chiao had a similarity coefficient value that was also low, only 0.3707. The value between two communities of Chiao was higher, of course, while about half of the species were still different. When several communities in a region, with distances not far from each other, have low similarity coefficient values, their regional biodiversity is high.
At the family level, the similarity coefficient values between community 1 and other communities were generally lower. However, higher values between other communities were also seen, such as communities 2 and 5 and communities 3 and 5. This result was in contrast with that for species level, indicating that at the family level, diversity degree did not probably present a distinct correlation with species diversity, as also seen in some wild cycad forests [26] . These aspects were more or less correlated with the regional landform difference degree. When every community is distributed in an obviously different environment, the difference degree of species and family difference degree would have a certain positive correlation. These still await further research.
The similarity coefficient value of family in communities 2 and 3 was higher, similar to the situation of species level. However, though the value of communities 2 and 4 was higher, it formed an obvious contrast with species level with a rather low value of 0.1454, showing that the species difference of two communities are established in the precondition of more similar families. This phenomenon is very similar to that of the similarity coefficient value in species level of communities 1 and 5, which was only 0.1333 at the lowest status. However, their family level value was 0.4857, which was thus a higher status. The similarity coefficient value of family in community 3 and community 4 of Chiao reached 0.6038, which was not similar to species level at the highest status and at the third position. This result proved that species level diversity did not better reflect the family level diversity and composition situation.
In the genus level, the situations were similar to families, where diversity degree did not probably present a distinct correlation with species diversity, even at the family diversity level.
With regard to the synthetic similarity coefficient (βc) of family, genus, and species, the value of community 1 was not the lowest, and yet was not higher. It reflected the basic aforementioned three grade difference situation. The similarity coefficient values of species in communities 4 and 5 were only at the third position because of the influence of family and genus factors. Moreover, the value of synthetic similarity coefficient was the highest, showing that the family and genus components of the two communities similarly reached the highest levels. Furthermore, the coefficient value of species in communities 3 and 4 was the highest. However, because the factors of family, genus, and species were not very well composed, βc was at the third position. When located between two long-distance places, the extent of genetic difference between two communities was higher. The synthetic similarity coefficient was also shown to be good and reflected the extent of the difference in the level of family, genus, and species.
Compared with the research of Li et al. [41] on four communities of the Lingnan Natural Conservation Area in Anhui Province, the three communities of Yangmeikeng in our study had higher Ds values for the tree, shrub, and herb layers, but the two communities of Chiao had lower values than the Lingnan Natural Conservation Area. This indicated that in the stronger artificial interference communities of Chiao, tree layer diversity was obviously low. Moreover, in the shrub layer, communities 2, 3, and 4 had obviously higher values than the former. Two other communities had slightly lower values than the former, particularly values in community 5. The shrub development situation of Chiao artificial forests was also shown to be worse. With respect to H, our research values of tree layers in the five communities showed that the communities of Yangmeikeng and the former had values that were basically equal, whereas the two communities of Chiao had more lower values than the former. With regard to evenness values (J), community 1 had higher values than community 2 of the former, and closer values to communities 3 and 4 of the former. The communities 2 and 3 of Yangmeikeng had higher values than the former, and the two communities of Chiao had evidently lower values than the four communities of the former. The man-made influence effect was also proven to be so obvious in the evenness situation.
Comparing α-diversity of our research with the researched results in other regions of Shenzhen, the Ds, H, and J values of Yangmeikeng in this research were basically higher than all other regions, whereas the two communities of Chiao had higher values than some parks, road sides, and some half-natural forests, but had lower values than communities which were protected for a longer period [15] [17] [18] [19] [21] .
He et al. [42] researched the diversity of several forest lands in Wuyishan Mountain region. The four forest lands were masson pine forest (community 1), economical forest (community 2), broad-leaved forest 1 (community 3), and broad-leaved forest 2 (community 4). Comparing our Ds H, and J research values for species, communities 1 and 2 of the former had lower values than community 3 of the latter. However, the index values of the two broad-leaved forests were better, and higher than those for the latter. With respect to tree layer evenness (J), our results showed that communities 2 and 3 were superior to all four communities of Wuyishan Mountain. Community 1 also had higher values than the two artificial forests (include masson pine forest), while having values that were closer to broad-leaved forest 1 of Wuyishan Mountain. However, the Chiao communities had lower J values than the former, with only community 5 having values close to community 1 of the former.
Burton et al. [43] researched the riparian woody plant forest diversity of urban-rural gradient in western Georgia, America. Compared with our researched H values in Yangmeikeng, only community 1 which was near the seaside and road, had more man- made influence. Its value was a slightly lower than that of the former, with two other communities generally similar or nearly equal to the former, even if some values were slightly lower than the former. However, some other values were higher than the former. Nevertheless, the two communities of Chiao had lower values than the former. Compared with evenness (J) values of the six communities in Georgia, community 1 of our research had higher values than 4 communities of the former, whereas communities 2 and 3 had higher than all communities of the former, which was evidently high. It showed that the vegetation evenness of Yangmeikeng was very good, but the situation of Chiao was worse than that of the former. This proved that artificial planting of economic forest regions obviously impacts and damages the diversity and evenness
Majumdar et al. [44] investigated four communities in Northeast Tripura, Indian. Compared with our research, the former had generally higher values, but communities 2 and 3 of Yangmeikeng were close to communities 1 and 4 of the former. This showed that this vegetation region of India was less artificially disturbed, with the structural composition being very important.
The Xishuangbanna tropical rain forest region is one of the regions where the structures of plant communities are most complex and plant diversity is very wide. Li et al. [45] studied six communities of tropical mountain rain forests in Xishuangbanna. Compared with our researched Ds, the three communities of Yangmeikeng had higher values than communities 1 and 2 of the former, but had lower values than the four other communities of the former. The two communities of Chiao had obviously lower values than all communities of the former. Furthermore, the conserved communities of Yangmeikeng had better vegetation restoration, leading to much higher diversities than some communities in the tropical rain forest region of Xishuangbanna. Moreover, the negative effects of artificial disturbance to Chiao communities were also prevented.
Wale et al.’s [46] research measured results from three communities of Gondel, Amhara of Northern Ethiopia, which showed that their integral H values were 3.43, 3.55, and 3.08. All were at a rather high level, showing that the situation of environment and diversity in this national conservation region was better. In our researched integral H values, communities 2 and 3 had higher values than the former, with other values being lower than those of the former’s. Therefore, even though the biodiversity values of the regions which were protected in Shenzhen were higher, they are still having room for improvement.
6. Conclusions
1) Most species of communities in artificial forests are shrub and herb. The tree species number and its proportion were distinctly low, indicating that in the man-made interference community, shrub and herb were the main components. The species number and richness of natural or long-term naturally restored forests for tree, shrub, and herb layers were higher than those of the former. Therefore, comparing the diversity of natural or half-natural forest with artificial forest, we need to analyze not only their diversity indices but also the proportion and composition of the layers of species. Because the tree layer was obviously greater, even surpassing the biomass of shrub and herb layers by more than times, major and dominant positions should be established to maintain ecosystem stability and other ecological effects.
2) Our research results confirmed that species-level diversity in one community did not reflect family-level diversity or genus-level diversity and their composition situation. Even if two communities were largely different in terms of species and if they were set up on the basis that the two communities had more similar genera, the difference in the genera of the two communities would be less, while genus diversity in the region would also be low. At the family level, diversity degree was probably not distinctly correlated with species diversity degree. Subsequently, even if the species diversity level is higher, its family or genus diversity levels are not certainly higher, since they have no distinctly correlation. Hence, when statistically analyzing biodiversity of a community, combining species, family, and genus composition, as well as their diversity situation, would be best. Meanwhile, analyzing their synthetic diversity index could objectively evaluate the diversity situation of a community.
3) When analyzing regional biodiversity, we need to not only analyze α-diversity situation of several communities, but also investigate and calculate β-diversity index between several communities. Only when the similarity coefficient values of several or more communities were lower or very low was the regional diversity high. Furthermore, we need to analyze not only the species β-diversity index but also the family and genus β-diversity indices because species composition and family and genus compositions in several communities have no distinct correlation. The synthetic similarity coefficient could indicate the extent of the difference in family, genus, and species levels.
Acknowledgements
We thank Nian Liu and An-Qiang Dong for joining part of the investigation work. This study was supported by the Science and Technology Project of Shenzhen Human Habitat and Environment Committee (SZGX2012118F-SCZJ).
Cite this paper
Liang, H., Huang, Y.Y., Lin, S.Z., Zhao, K.S., Zou, Y.F., Yu, X.F., Yang, L.J., Xu, W., Ming, Z. and Zhou, Z.B. (2016) Study on Plant Diversity of Mountain Areas of Yangmeikeng and Chiao, Shenzhen, China. American Journal of Plant Sciences, 7, 2527-2552. http://dx.doi.org/10.4236/ajps.2016.717220
References
- 1. Ehrlich, P.R. and Wilson, E.O. (1991) Biodiversity Studies: Science and Policy. Science, 253, 758-762.
https://doi.org/10.1126/science.253.5021.758 - 2. Tilman, D. and Downing, J.A. (1994) Biodiversity and Stabilityin Grasslands. Nature, 367, 363-365.
https://doi.org/10.1038/367363a0 - 3. Tilman, D. (1996) Biodiversity: Population versus Ecosystemstability. Ecology, 77, 350-363.
https://doi.org/10.2307/2265614 - 4. Naeem, S., Thompson, L.J., Lawton, J.H. and Woodfin, R.M. (1995) Empirical Evidence That Declining Species Diversitymay Alter Performance of Terrestrial Ecosystems. Proceedings of the Royal Society of London B, 347, 249-262.
https://doi.org/10.1098/rstb.1995.0025 - 5. Kareiva, P. (1994) Diversity Begets Productivity. Nature, 368, 686-689.
https://doi.org/10.1038/368686a0 - 6. Kareiva, P. (1996) Diversity and Sustainability on the Prairie. Nature, 379, 673-674.
https://doi.org/10.1038/379673a0 - 7. Huston, M.A. (1997) Hidden Treatments in Ecological Experiments: Evaluating the Ecosystem Function of Biodiversity. Oecologia, 110, 449-460.
https://doi.org/10.1007/s004420050180 - 8. Wu, Y.N. and Zhang, Y.F. (1997) The Relationship between Plant Species Diversity and Productivity of Steppe Community. Acta Scientiarum Naturalium Universitatis Neimongol, 28, 667-673.
- 9. Bai, Y.F., Li, L.H., Huang, J.H. and Chen, Z.Z. (2001) The Influence of Plant Diversity and Functional Composition on Ecosystem Stability of Four Stipa Communities in the Inner Mongolia Plateau. Acta Botanica Sinica, 43, 280-287.
- 10. Qin, G.L., Du, G.Z., Li, Z.Z., Yang, G.Y., Ma, J.Y. and Ning, M.J. (2002) Relationship between Productivity and Species Diversity in Alpine Meadow Plant Community. Acta Phytoecologica Sinica, 26, 57-62.
- 11. Shang, Z.H., Yao, A.X. and Long, R.J. (2005) Analysis on the Relationship between the Species Diversity and the Productivity of Plant Communities in the Arid Mountainous Regions in China. Arid Zone Research, 22, 74-78.
- 12. Wen, Y.G., Chen, F., Liu, S., Liang, H., Yuan, C.A. and Zhung, H. (2006) The Relationship between Plant Species Diversity with Productivity in Eucalyptus Plantation, Guangxi Province, China. Proceeding of Chinese Doctor Graduate Academic Forum—Branch Forum of Biodiversity of China, Chengdu, 20-23 July 2006, 24-29.
- 13. Li, X.H., Zhou, Q. and Zhang, G.S. (2008) Effect of Biodiversity on the Services of Urban Ecosystem. Ecology Economy, 409-415.
- 14. Jin, H.X. (2012) Study on Species Diversity and Productivity of Forest Planted for Ecosystem Restoration. Doctor Dissertation, Lanzhou University, Lanzhou.
- 15. Yin, X.X., Tian, X.G., Wang, D.Y., Wang, H., Xie, Z.G. and Wang, X.R. (2013) Diversity Analysis on the Plant Community Characteristics of Urban Park in Shenzhen. Journal of Hubei University for Nationalities (Natural Science Edition), 31, 366-376.
- 16. Liu, M., Qiu, Z.J., Zhou, G.Y. and Xu, H. (2007) Undergrowth Species Diversity of Acacia mangium Plantationin Phoenix Mountain, Shenzhen, China. Forest Science and Technology of Guangdong, 23, 26-31
- 17. Liu, J., Luo, L., Wu, G.P., Zhang, B., Zhan, H.L. and Liao, W.B. (2010) Studies on Sinosideroxylon wightianum comminities in Dananshan Region of Shenzhen City, Guangdong Province, China. Journal of Tropical and Subtropical Botany, 18, 523-529.
- 18. Zhang, Y.X., Chen, H.F., Qin, X.S., Zhang, R.J. and Xing, F.W. (2007) Characteristics and Species Diversity of Syzygium odoratum Community in Dapeng Peninsula, Shenzhen. Guihaia, 27, 596-603.
- 19. Kang, J., Liu, W.Q., Yu, F.Q., Zhai, Q.J. and Liao, W.B. (2005) Vegetation Types and Plant Community Characters in Bijiangshan Park in Shenzhen, Guangdong Province. Acta Scientiarum Naturalium Universitatis Sunyatseni, 44, 10-31.
- 20. Wang, D.P., Ji, S.Y., Chen, F.P., Xing, F.W. and Peng, S.L. (2003) A Study on the Species Diversity and Succession Situation of Natural Forest Communities in Nanshan District, Shenzhen City. Acta Ecologica Sinica, 23, 1415-1422.
- 21. Chen, Y., Sun, B., Liao, S.B., Luo, S.X., Liu, D.W., Du, P.Z. and Li, F.D. (2013) Classification of Main Phytocomunity and Biodiversity in Shenzhen. Forest Research, 26, 636-642.
- 22. Ouyang, Z.Y., Li, Z.X., Liu, J.G., et al. (2002) The Recovery Processes of Giant Panda Habitat in Wolong Nature Reserve, Sichuan China. Acta Ecologica Sinica, 22, 1841-1849.
- 23. Pielou, P.C. (1975) Ecological Diversity. John Wiley & Sons Inc., Hoboken.
- 24. Lloyd, M., Inger, R.F. and King, F.W. (1968) On the Diversity of the Reptile and Amphibian Species in a Bomean Rain Forest. American Naturalist, 102, 497-515.
https://doi.org/10.1086/282563 - 25. Huang, Y.Y., Yu, X.F., Liang, H, Zhao, K.S., Lu, Y.H., Chen, Y.H., Liu, N., Yang, L.J., Dong, A.Q., Ming, Z. and Lai, B.W. (2016) Studies on Vegetation Composition and Plant Diversity of Shenzhen Lianhua Mountain. Agricultural Research and Application, 18-34.
- 26. Huang, Y.Y., Nong, B.X., Zhong, Y.C., Wei, L.J., Huang, L.M., Xu, F. and Lu, Y.F. (2012) Studies on Distribution, Habitat Situation and Diversity of Eight Wild Cycads in China. Proceeding of the 2012 Annual Conference of Ecological Society of China, 9, 51-53.
- 27. Huang, Y.Y., Zhao, K.S., Chen, Y.H., Yu, X.F., Liang, H., Yang, L.J., Ming, Z., Wang, H.Y. and Zhou, Z.B. (2014) Study on Plant Diversity of Lianhuashan Park of Shenzhen. Proceeding of 13th Ecology Conference of China, Shenyang, 18-19 September 2014, 103-104.
- 28. Mao, Z.H. and Zhu, J.J. (2006) Effects of Disturbances on Species Composition and Diversity of Plant Communities. Acta Ecologica Sinica, 26, 2696-2701.
- 29. Wang, Y., Ouyang, Z.Y., Zheng, H., Chen, F., Chen, S.B. and Zeng, J. (2013) Effects of Three Forest Restoration Approaches on Plant Diversity in Red Soil Region Southern China. Acta Ecologica Sinica, 33, 1204-1211.
https://doi.org/10.5846/stxb201207080956 - 30. Ma, K.P. and Liu, Y.M. (1994) The Measured Methods of Biological Community Diversity, Iα-Diversity Measured Methods. Chinese Biodiversity, 2, 231-239.
- 31. Kita, Y., Ueda, K. and Kadota, Y. (1995) Molecular Phylogeny and Evolution of the Asian Aconitum Subgenus Aconitum (Ranunculaceae). Journal of Plant Research, 108, 429-442.
https://doi.org/10.1007/BF02344231 - 32. Chaw, S.M., Zharkikh, A., Sung, H.M., Lau, T.C. and Li, W.H. (1997) Molecular Phylogeny of Extant Gymnosperms and Seed Plant Evolution: Analysis of Nuclear 18s rRNA Sequences. Molecular Biology and Evolution, 14, 56-68.
https://doi.org/10.1093/oxfordjournals.molbev.a025702 - 33. Devoto, A., Hartmann, H.A., Piffanelli, P., Elliott, C., Simmons, C., Taramino, G., Goh, C.S., Cohen, F.E., Emerson, B.C., Schulze-Lefert, P. and Panstruga, R. (2003) Molecular Phylogeny and Evolution of the Plant-Specific Seven-Transmembrane MLO Family. Journal of Molecular Evolution, 56, 77-88.
https://doi.org/10.1007/s00239-002-2382-5 - 34. Heubl, G., Bringmann, G. and Meimberg, H. (2006) Molecular Phylogeny and Character Evolution of Carnivorous Plant Families in Caryophyllales. Plant Biology, 8, 821-830.
https://doi.org/10.1055/s-2006-924460 - 35. Feng, H.B. (2006) Molecular Phylogeny of Calycanthaceae. Master Dissertation, Liaoning Normal University, Dalian.
- 36. He, M. (2007) Study on Molecular Phylogenetics of the Genus Syringa in Northeastern China. Doctoral Dissertation, Northeast Forestry University, Harbin.
- 37. Liu, L. (2007) Molecular Phylogeny of Chinese Brachytheciaceae. Doctoral Dissertation, Chinese Eastern Normal University, Shanghai.
- 38. Wang, F.X. (2007) Studies on Morphology and Molecular Systematics of Four Genera in Chinese Mniaceae. Master Dissertation, Nanjing Forestry University.
- 39. Huang, Y.Y., Nong, B.X., Liu, C., Zhong, X.Q. and Wei, L.P. (2009) Improving of RAPD Reaction System in Cycad and Studies on the Genetic Relationships of Some Species. Guihaia, 29, 569-575.
- 40. Huang, J.L., Sun, G.L. and Zhang, D.M. (2010) Molecular Evolution and Phylogeny of the Angiosperm ycf2 Gene. Journal of Syetematics and Evolution, 48, 240-248.
https://doi.org/10.1111/j.1759-6831.2010.00080.x - 41. Li, X.Q., Zhang, G.B. and Chao, J.K. (2007) Study on Plant Species Diversity in the Forest Communities in Lingnan in Anhui Province. Journal of Jiangsu Forestry Science & Technology, 34, 28-31.
- 42. He, D.J., Hong, T., Hu, H.Q., Wang, Z.Y., Liu, Y.S. and Fan S.F. (2007) Species Diversity in Different Forest Landscapes in Wuyishan Scenery District. Chinese Journal of Eco-Agriculture, 15, 9-13.
- 43. Burton, M.L., Samuelson, L.J. and Pan, S. (2005) Riparian Woody Plant Diversity and Forest Structure along an Urban-Rural Gradient. Urban Ecosystems, 8, 93-106.
https://doi.org/10.1007/s11252-005-1421-6 - 44. Majumdar, K., Shankar, U. and Datta, B.K. (2012) Tree Species Diversity and Stand Structure along Major Community Types in Lowland Primary and Secondary Moist Deciduous Forests in Tripura, Northeast India. Journal of Forestry Research, 23, 553-568.
https://doi.org/10.1007/s11676-012-0295-8 - 45. Li, Z.S.,Tang, J.W., Zheng, Z., Li, Q.J., Luo, C.K., Liu, Z.A., Li, Z.N., Duan, W.Y. and Guo X.M. (2004) A Study on Plant Diversity of Tropical Mountain Rain Forests Xishuangbanna, Yunnan. Acta Phytoecologica Sinica, 28, 833-843.
https://doi.org/10.17521/cjpe.2004.0109 - 46. Wale, H.A., Bekele, T. and Dalle, G. (2012) Plant Community and Ecological Analysis of Woodland Vegetation in Metema Area, Amhara National Regional State, Northwestern Ethiopia. Journal of Forestry Research, 23, 599-607.
https://doi.org/10.1007/s11676-012-0300-2