American Journal of Climate Change
Vol.05 No.02(2016), Article ID:67815,21 pages
10.4236/ajcc.2016.52023
40 Years of Surface Warming in the Northern US Rocky Mountains: Implications for Snowpack Retreat
Matthew J. Hornbach*, Maria Richards, David Blackwell, Cliff Mauroner, Casey Brokaw
Huffington Department of Earth Sciences, Southern Methodist University, Dallas, TX, USA

Copyright © 2016 by authors and Scientific Research Publishing Inc.
This work is licensed under the Creative Commons Attribution International License (CC BY).
http://creativecommons.org/licenses/by/4.0/


Received 29 December 2015; accepted 26 June 2016; published 29 June 2016
ABSTRACT
The northern US Rocky Mountains are experiencing rapid warming. Combined analysis of Ground Temperature (GT) measurements at two high-fidelity boreholes with Surface Air Temperature (SAT) measurements near Helena Montana spanning the past 40 years indicate the northern US Rockies have warmed on average 0.12˚C - 0.32˚C/decade since 1975, at least a factor of ~5 higher than the predicted 500-year-average. Warming appears to be accelerating, with warming rates since 2013 4 - 7 times higher than the 40 year average. Though uncertainty exists, the most significant GT warming appears to occur at higher elevation. Warming estimates are consistent with modelling predictions, snowpack observations, and stream temperature studies, all suggesting rapid surface temperature change in this region during the past ~40 years. The analysis indicates GT warming measured at remote borehole sites is slightly lower than regional SAT measurements collected near urban environments. We associate the discrepancy between GT/SAT measurements to both anthropogenic effects (urban development) that increase warming at the nearest SAT measurement station and a 14-year period of anomalously low snowfall that reduces surface insulation and GT warming. Using a derived average forty-year surface warming rate of 0.22˚C/ decade and regional temperature-elevation trends, we calculate that the elevation of the winter freeze line during the three coldest months of the year (December, January, and February) in the northern US Rocky Mountains is retreating upward, on average, 33 m/decade. This implies a 21% reduction in freeze-line area since 1974. If this trend continues, we estimate that within the next 40 years (by 2060), the total area where ground freeze occurs during the three coldest months of the year will be ~60% of 1974 values. Since GT measurements indicate accelerated warming, this may be an underestimate. The analysis has important implications for the snowpack-water budget for Montana and the northern US Rocky Mountains.
Keywords:
Climate Change, Montana, Rocky Mountains, Water, Temperature, Borehole, Snowpack

1. Introduction
Global Surface Air Temperature (SAT) measurements indicate increasing surface temperatures on Earth since the mid-20th century, with average SAT increasing at a rate of ~2˚C during the past century [1] - [4] . This observation, however, is usually based on surface air temperature measurements that are prone to some uncertainty [5] - [8] . Although SAT studies indicate that most of the earth has warmed during the past century, the rate is highly variable depending on location [4] . As a result, assessing the impact and rate of warming at a particular region on Earth requires a more focused site-specific assessment of long-term temperature change.
The Northern Rocky Mountains of the United States represents a critical area of climate change study for several ecological and economic reasons. Warming in the Rocky Mountains may have a crippling effect on snowpack and water supply for the United States, as recently demonstrated with the California drought [9] [10] . Multiple studies suggest population centers in the western United States where water supplies depend on snowmelt are more vulnerable to the effects of increased temperatures over time, with areas at higher elevation and higher latitudes generally experience the most significant impact [7] [11] - [13] . In areas that rely heavily on snowpack to maintain their water supply, accurate assessment of long-term surface temperature change is critical for predicting future water resources [6] [7] [14] .
The number of below-freezing days has decreased over the last century in the US, and this has an impact on snowpack, water-storage, and therefore, water supply in the western United States [5] [15] - [19] . Currently, however, significant uncertainty exists in the rate of warming in the Northern US Rocky Mountains. Global studies suggest surface temperature warming of ~1˚C has occurred in the Northern US Rocky Mountains since 1901, or approximately 0.1˚C per decade [8] . Other studies suggest that mean annual temperature in the western United States has increased at rates as high as ~0.3˚C - 0.5˚C per decade [3] [7] ; perhaps more than double the mean global rate of ~0.2˚C [2] [4] . The factor of five difference highlights both the uncertainty that exists and the need for more detailed regional assessments.
The differences in estimated warming rates are not necessarily surprising: constraining the rate of surface temperature warming is difficult for several reasons. Estimated SAT values are impacted by several factors besides long-term climate change, including the density and spatial coverage of National Climatic Data Center (NCDC) thermometers, the heat island effect on weather stations located near urban centers [20] , apparent warming or cooling due to weather-station re-location or adjustment with time, the bias of more weather stations being located in areas of lower elevations, and the high internal variability of metadata sometimes used in these studies [2] [21] - [23] . As a result, accurately quantifying rates of surface warming using standard SAT records remains a valuable yet challenging approach for assessing decadal-scale temperature change both in the Rocky Mountains and beyond [24] .
In this study, we use not only SAT measurements but an alternative tool for assessing decadal-scale temperature change in the Northern US Rocky Mountains: repeat Ground Temperature (GT) estimates derived from borehole temperatures. Borehole temperature-depth measurements provide a well-established mechanism for estimating regional surface temperature change at annual-to-millennial time-scales [25] - [30] . Combining SAT with GT measurements presents a unique opportunity for better quantifying surface temperature change, especially for (1) longer (decadal to centennial) time scales and (2) locations where limited SAT measurements exist [29] - [34] .
Determining surface temperature change using boreholes is generally straight-forward: measure the temperature versus depth in a well; then return at a later date, re-measure, and compare to previous measurements. Assuming no changes to either the regional heat flow (due to advection or thermal conductivity changes in the Earth) or surface albedo (do to such effects as clear-cutting, vegetation change, land-use change, or other human development), then changes in the shallow part of the temperature-depth profile can be attributed to changes in surface temperature [29] [35] [36] . Both forward and inverse models routinely estimate GT change with time using this approach [29] [35] . Accurately determining regional temperature change using boreholes requires knowledge of the thermal properties of the subsurface at each well site and knowledge of any potential changes to surface microclimatic conditions that might affect subsurface temperatures [35] [37] - [39] . The most ideal boreholes for analyzing GT changes typically have conductive, near-linear temperature-depth profiles, relatively constant thermal conductivity in both space and time, and perhaps most importantly, are located in remote sites where few if any surface changes have occurred [29] [33] [35] .
For this study, we measure temperature versus depth at two wells ideally suited for climate analysis: CD9 and MV-RDH35. Both wells are located in western Montana, where temperature-depth measurements were previously made in 1973 and 1975, respectively. Although hundreds of wells have been temperature-logged by Blackwell and others in Western Montana since the 1960s [40] , we chose to reoccupy these two wells because (1) both wells have high-fidelity temperature measurements dating back 40 years, (2) neither well site has undergone surface changes since they were drilled, (3) both wells are located within 20 km of each other but at an elevation difference of more than 800 m, thereby providing potential insight into elevation effects on temperature change, (4) the wells are located 8 km and 28 km from Helena, Montana, respectively, where long-term high quality NOAA SAT measurements exists for comparison, and (5) both wells have near-linear temperature- depth profiles and cuttings/core data available, indicating near-constant thermal diffusivity and resulting in straightforward GT measurement. For this study, we compare temperature-depth measurements from 1973 (CD9) and 1975 (MV-RDH35), with recent (2013-2015) measurements made at these wells. We then model the surface temperature changes necessary to explain temperature-depth discrepancies that developed during the past 40 years. We compare results from the borehole temperature-depth study with SAT measurements in Helena during this same time period to quantify, compare, and assess temperature change in this region.
2. Well History and Location
The first well, defined as MV-RDH35 in the National Geothermal Database, and here referred to as the Fort Harrison well, is located at 46.616˚N, 112.131˚W at an elevation of 1285 m (Figure 1). This well is approximately
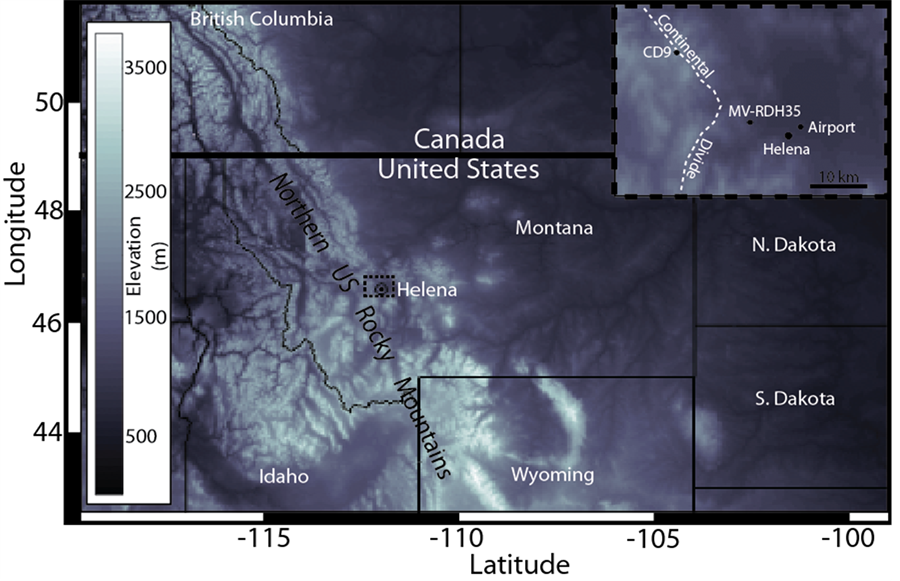
Figure 1. Mapview showing the location of the Northern US Rocky Mountains. Inset shows the location where GT measurements were made at well CD9, located at an elevation of 2097 m on the continental divide, and well MV-RDH39, located at Fort Harrison Army Reserve Base at an elevation of 1285 m, 8 km west of Helena. Comparison SAT measurements were also made at Helena Airport, located just 3 km northeast of downtown Helena.
8 km west of Helena, Montana, and is located on the Ft. William H. Harrison Army Reserve Base. The army base consists of 8500 (34.4 km2) contiguous acres of almost entirely uninhibited, treeless terrain and abuts both Bureau of Land Management and National Forest land along its northern and western boundary, respectively. Photographs taken when the well was drilled in the 1970s by David Blackwell and time-series satellite photos from Google Earth dating back to 1990 show no significant man-made or natural changes have occurred within at least 4 km of the well site in the last 40 years. The well site, located near the geographic center of the army base, consists of alluvium soil on an open plain vegetated with short (cm-tall) grasses. Photos indicate no vegetation change during the past 40 years and the army has worked to keep the area a high-plains native prairie grassland for decades. The well was originally drilled in 1973 to a depth of ~140 m to assess regional heat flow in the Northern Rocky Mountains. Although temperatures were initially measured in 1973 immediately following drilling, these temperatures were not in equilibrium due to circulation of drilling fluid. To determine a more accurate steady-state temperature-depth profile, Blackwell re-measured temperature at 5 m depth intervals at the site on June 29, 1975, approximately two years after drilling. Both hand-written logging notes and discussion with David Blackwell indicate these measurements were made by waiting several minutes (typically 10 - 20) to ensure probe temperatures approached equilibrium at each depth. Temperature-depth measurements obtained in 1975 indicate the water table occurred at approximately 30 m depth, with no systematic difference in thermal gradient observed above and below the water table.
The second well, defined as CD9 in the National Geothermal Database, is located at 46.726˚N, 112.334˚W. This well is approximately 19 km northwest of Fort Harrison, at an elevation of 2097 m, and is located within 1 km of the continental divide. Although CD9 is less than 20 km from the Fort Harrison well, it is 812 m higher. Analysis of surface temperature changes between CD9 and the Fort Harrison well may therefore provide insight into how temperature changes differ with elevation in this region. CD9 was drilled in the 1940s by AMAX Exploration for mineral exploration purposes at an inclination angle of ~45˚ from vertical to a total length of ~115 m, and a total depth below the surface of 82 m. Steady-state temperature depth profiles acquired by Blackwell and Baag in 1973 at a vertical depth interval of 3.53 m indicate a nearly linear temperature-depth profile at the site and no observed change in thermal gradient crossing below the water table [40] . Thermal conductivity and diffusivity of sediments at the site are constrained from drilling data and cuttings provided by AMAX to Blackwell in 1973 and from conductivity measurements from two other wells located less than a kilometer from CD9. Results from previous studies [40] indicate sediment thermal conductivity is nearly constant at this well site, averaging 2.95 +/−0.21 W/mK. Well CD9 is located on public Bureau of Land Management property that consists of open, grass-covered prairie, similar to the Fort Harrison well site. Analysis of photographs from 1973 taken by Blackwell, as well as historical photographs available from Google Earth suggest no surface changes have occurred near CD9 since original heat flow measurements were made. As a result, CD9, like the Fort Harrison well, is ideally suited for assessing ground temperature change during the past 40 years.
3. Methods
We re-measured temperature with depth at the Fort Harrison well on August 14th, 2013, and again approximately one year later, on August 6th, 2014. Temperature measurements were made from 5 m to 137.5 m below the surface at depth intervals ranging from 2.5 to 5 m intervals. The temperature probe was connected to an electrical cable that allowed for real-time temperature measurements during probe deployment. The thermistor probe, designed and built by Robert Spafford, is the same used for all measurements at the site in 1973, 1975, 2013 and 2014. The probe was calibrated to within 0.01˚C using NIST-traceable thermometers. During measurement, we lowered the probe to each depth interval and held the probe at each measurement depth up to 30 minutes to ensure that the probe temperature had either reached or was clearly converging on a steady-state value. Measurement wait times were often 15 to 30 minute at depth locations above the water table. In most instances where we measured temperature in air, the probe temperature settled at a constant value (to within +/−0.01 degrees) within 20 minutes of deployment at a specific depth. The only depths where anomalous temperature fluctuations sometimes occurred with time were at the very top of the hole (<10 m depth) where we suspect subtle air fluctuations at the top of the hole caused temperature fluctuations of +/−0.05 degrees. The probe measures steady state temperature almost instantaneously once it is submerged below the water table, and therefore, we required only a few minutes of measurement at each depth below the water table to estimate temperature. We reached the water table at a depth of ~25 +/−2.5 m at the Fort Harrison well during both the 2013 and 2014 measurements, consistent with water table estimates from 1975 estimates.
At well site CD9, we re-measured the temperature-depth profile for three consecutive years, with measurements made on August 18, 2013; August 8, 2014 and July 26, 2015. Temperature measurements were made every 2.5 to 5 m in the wellbore, or 1.77 m to 3.5 m in true vertical depth (TVD) below the surface, since the well is drilled at a 45 degree inclination. The water table was stable during all three years of measurement: we encountered the water table at a TVD of ~65 +/−2 m during all three runs and observed no change in thermal gradient at depths below this interval.
4. Results
4.1. The Fort Harrison well
We analyzed the temperature-depth profile at both wells for all depths greater than 20 m, below which no significant temperature changes associated with daily or seasonal temperature fluctuations exist [36] . At the Fort Harrison well, comparison between 1975, 2013, and 2014 temperature-depth measurements indicates temperatures have increased in the well during the past 40 years (Figure 2(a)). Since 1975, the temperature at the well has increased at all depth intervals at an average of 0.15˚C, with the most significant increase (between 0.2˚C - 0.3 ˚C) in the upper 40 m of the well (Figure 2(b)). At the deepest depths, 2014 measurements are approximately 0.1˚C warmer than 1975 measurements; this temperature difference is above the temperature measurement uncertainty of ~0.01˚C. At depths shallower than ~70 m, 2014 temperature measurements increasingly diverge from 1975 temperatures, with the largest temperature differences at the shallowest depths. At depths of ~20 m below the surface, measured 2014 temperatures at the Fort Harrison and CD9 wells are approximately 0.25˚C warmer, than 1975 measurements (Figure 2(a) inset). A warming trend also clearly exists between 2013 and 2014, with 2014 temperatures 0.028˚C warmer on-average than 2013 measurements, and the most significant warming (>0.05˚C) at depths shallower than 30 m (Figure 2(c)).
4.2. The CD9 Well
Comparison of temperature-depth measurements at the higher elevation CD9 well from 1973, 2013, 2014, and 2015 also shows temperature increasing with time (Figure 3(a)). Warming at the higher elevation CD9 well

Figure 2. Temperature-depth measurements at the Fort Harrison well in 1975, 2013, and 2014 (a). The difference between 2014 and 1975 temperature-depth measurements (b), and 2014 and 2013 temperature depth measurements (c); both indicate warming.

Figure 3. Temperature-depth measurements at the CD9 well located on the continental divide for 1973, 2013, 2014, and 2015 (a). The difference between 2015 and 1973 temperature-depth measurements (b), and 2015 and 2013 temperature depth measurements (c) both indicate warming.
appears more significant than the Fort Harrison well. Since 1973, the borehole temperature has increased on average 0.28˚C with the most significant warming (>0.3˚C) occurring in the upper ~30 m of the well. At the well bottom (~81 m below the surface), we observe 0.15˚C of warming (Figure 3(b)). A warming trend is also clearly observed in the high resolution measurements obtained annually at well CD9 from 2013-2015 that show a clear and statistically significant increase in subsurface temperature during the past two years in the upper 30 meters of the well (Figure 3(c)). Annual measurements from 2013 to 2015 in CD9 indicate an average warming trend 0.015˚C/year within the well, with the most significant warming (>0.03˚C) in the upper 30 m (Figure 3(c)).
5. Analysis
Analysis of temperature-depth measurements at each of the wells indicates subsurface temperature change is not linear, but has likely accelerated with time at these well sites. Taking a simple average for the rate of change in temperature in each well with time for the 1970s measurements and comparing this rate of change with 2013- 2015 measurements, it is clear that borehole temperature change is non-linear. For example, we estimate the an average temperature change at a depth of 25 m the Fort Harrison well from 1975-2014 of 0.007˚C/yr, yet, 2013-2014 estimates at this depth indicate warming at a rate of ~0.05˚C /yr, a factor of 7 higher. Similarly, the average rate of warming from 1973-2015 at well CD9 at a depth of 21 m is 0.012˚C/yr, yet average warming value from 2013-2015 at this depth is 0.04˚C/yr; nearly a factor of four higher. This analysis suggests that warming has been more significant in more recent years than the background forty year average.
We hypothesize that warming in the borehole is the direct result of changes to regional surface temperature since no significant changes to the surface environment have occurred at these sites in the past 40 years. Temperature measurement comparisons within the borehole provide useful insight into first-order regional warming, however, determining temperature change at the surface is much more valuable for assessing regional climate change. Due to seasonal and daily temperature fluctuations at the surface, estimating average annual surface temperature change using well temperature-depth data requires additional analysis and modeling. The following sections describe the approach we use to estimate the average annual ground temperature change at these well sites.
5.1. Estimating Surface Temperature Change Using a Best-Fit Forward Model
To generate a preliminary assessment of ground temperature change at each well site, we best-fit a line to the near-linear 1970s temperature-depth profiles, and from this, estimate mean annual ground temperature. Since any temperature measurement made shallower than ~20 m below the surface is affected by seasonal and daily temperature variations (e.g. [36] ), we calculate a best fit temperature-depth profile for data collected from the bottom of each hole to 20 m below the surface. We apply this approach to all measurements made at the Fort Harrison and CD9 wells, and incorporate least-squares uncertainty analysis to estimate relative error in the calculated mean annual ground temperature. We then use a 1D diffusive heat flow model to estimate the best fit surface temperature change necessary to replicate more recent (2013-2015) temperature-depth profiles for each well.
5.2. The 1D Diffusive Heat Flow Model
To determine the average rate of surface warming at the wells, we generate a best-fit forward model for temperature change in the borehole. The one-dimensional forward model uses a constant-diffusivity heat flow equation:
 (1)
(1)
where T is temperature (˚C), t is time (s), z is depth (m), and k, the thermal diffusivity (m2/s), is kept constant in space and time. We solve for T with respect to z and t by using a second-order forward-time center-space finite- difference approximation, similar to previous borehole temperature modeling studies [39] such that
 (2)
(2)
where n is the time node, j is the space node,  is the vertical cell dimensions set at a constant value of 0.5 m, and
  is the numerical time step, which satisfies the current condition. We then solve the forward model by solving for
  for each new time step:
 (3)
(3)
In order to forward model a best fit solution for average surface warming, the model allows the surface boundary temperature,  , to increase at a constant rate with time and determines which rate of warming produces a best fit. We use a least squares approach to estimate the initial starting model temperature-depth profile by best fitting a line to 1970s temperature-depth data. To minimize boundary condition effects, the total depth of the model is set at 500 m, and assumes an open bottom boundary condition. We estimate diffusivity, k, in the model from drill cuttings acquired from the sites [40] and by using a Monte Carlo approach to estimate and account for porosity uncertainty. The Monte Carlo approach assumes a large porosity uncertainty, with a uniform porosity distribution ranging between 10% - 60%. Based on this analysis, conductivity at the Fort Harrison well is 2.87 +/− 1.04 (1 sigma) W/mK and diffusivity is 1.21 × 10⁻⁶ m2/s +/−3.7 × 10−7 m2/s (1 sigma). Similarly, conductivity for CD9 is 2.95 +/− 0.21 W/mK with a diffusivity of 1.11 - 1.28 × 10⁻⁶ m2/s). The diffusivity values are consistent with other studies and typical of shallowly buried sediment [33] [41] .
5.3. Average Surface Temperature Warming at the Fort Harrison Well
Our best-fit analysis suggests an initial average surface temperature in 1975 at the Fort Harrison well of 9.40˚C +/− 0.05˚C and a thermal gradient of 20.50 +/− 0.2˚C /km. We run the forward model from June 29, 1975 to August 6, 2014, the dates measurements were made. To find a best fit solution for the mean surface warming during the past ~40 years, we sweep the model through average surface-warming values that range between 0.001 - 0.005 ˚C/yr, at an interval of 0.001˚C. We also sweep the model through random variations in diffusivity using a Monte Carlo approach that finds a best fit value for both warming and thermal diffusivity. The analysis provides a best-fit solution for diffusivity values ranging from 0.85 × 10⁻⁶ - 1.58 × 10⁻⁶ m2/s, consistent with the 1 sigma uncertainty for diffusivity. Based on this approach, we obtain a best fit solution for surface temperature warming at the Fort Harrison well of 0.012˚C +/− 0.002˚C/yr, or 0.12˚C/decade (Figure 4).

Figure 4. Temperature-depth measurements at the Fort Harrison well for 1975 (green) and 2014 (red) with the best-fit modelled surface warming results shown in 2 year time increments (blue). The best-fit solution indicates a mean best fit value of 0.012˚C/yr warming at the site.
5.4. Average Surface Temperature Warming at Well CD9
To determine if differences in surface warming exist between the lower-elevation Fort Harrison well and higher elevation CD9 well, we also analyze and forward model data collected at well CD9, located ~18 km Northwest and 812 m higher than the Fort Harrison well. We forward model a best-fit solution for surface warming at well CD9 following the same approach used for the Fort Harrison well. Applying a least-squares best fit analysis to 1973 temperature-depth measurements for all measurements below 20 m, we estimate a mean 1973 surface temperature of 4.10˚C +/− 0.06˚C and a thermal gradient of 60.24˚C/km +/− 1.1˚C/km at CD9, consistent with previous measurements at the site [40] . The colder surface temperature observed at CD9 compared to Fort Harrison is consistent with what we would expect given the higher elevation at CD9. We forward model surface temperature change at CD9 from July 1st 1973 to August 8th 2014, the dates first and last temperature measurements were made. Using the surface temperatures and thermal gradients described above and a measured thermal conductivity of 2.95 +/− 0.21 W/mK (diffusivity of 1.11 - 1.28 × 10⁻⁶ m2/s), we calculate a best-fit rate of warming for the last 42 years at CD9 of 0.017˚C/yr +/− 0.002˚C/yr, or 0.17˚C/decade. This rate of increase is ~42% higher than the Fort Harrison well site (Figure 5).
6. Implications for Surface Temperature Warming at CD9 and Fort Harrison Sites
Modeling results indicating rapid warming, with ~0.5˚C and ~0.7˚C warming during the past 40 years at the Fort Harrison and CD9 well sites, respectively. If these rates are constant, this implies an average warming rate of 1.25˚C and 1.75˚C per century, at these sites, with the higher elevation CD9 well experiencing ~40% higher warming rates. In reality, warming rates appear non-linear, with perhaps the most significant warming occurring in the past few years (Figure 3), making it difficult to estimate average warming during the past century. Nonetheless, analysis and observations of temperature-depth measurements at both CD9 and the Fort Harrison wells currently support the premise that surface warming at a rate in excess of 0.1˚C/decade has occurred in the Norther US Rockies during the past 40 years.
7. Comparing Borehole-Derived Warming with Air Temperature Warming
Fort Harrison is located ~10 km west of the Helena Airport, where more than 40 years of NOAA National Climate

Figure 5. Temperature-depth measurements at well CD9 for 1973 (green) and 2014 (red) with the best-fit modelled surface warming results shown in 5 year time increments (blue). The best-fit solution indicates a mean best fit value of 0.017˚C/yr warming at the site.
Data Center (NCDC) SAT records exist. It is therefore possible to compare GT changes at Fort Harrison with SAT changes at nearby Helena Airport to determine if consistent trends exist. Least squares analysis of NOAA NCDC SAT measurements from 1975 to the present indicate SAT at Helena, Montana warmed at an average rate of 0.032˚C/yr (Figure 6). The average standard deviation between the linear best fit and measured annual SAT values for Helena, however, are high at +/−0.73˚C (1-sigma), and using a Monte Carlo technique that randomly varies for 1000 iterations each recorded mean annual temperature up to 1 standard deviation from the line fit, we estimate the rate of SAT warming in Helena since 1975 is 0.032˚C +/− 0.014˚C/yr (1-sigma). This value is consistent with average US air temperature warming during this period (Figure 6).
Both SAT measurements at Helena Airport and GT measurements at the nearby Fort Harrison well indicate clear and statistically significant warming occurred in the Helena area during the past 40 years. The apparent difference between SAT warming at Helena Airport and GT warming at nearby Fort Harrison appears significant, despite high uncertainty in the SAT measurements. Average SAT warming during the past 40 years in Helena is 1.3˚C +/− 0.7˚C compared to lower GT warming at the Fort Harrison well of 0.48 +/− 0.06˚C. SAT warming is therefore higher than GT warming to one standard deviation. Interestingly, the observation of lower average GT warming compared to SAT warming is opposite what is observed when comparisons are made between other GT/SAT studies in North American at latitudes above 45˚N [35] .
8. Assessing Differences between GT and SAT Changes in Helena
Why mean GT warming near Helena is less than SAT warming during the past 40 years is unclear, however, several potential explanations exist. The general consistency between GT and SAT changes observed over long (decade-to-century) time scales and the diffusive nature of conductive heat flow implies that short term (annual) variations in solar radiation and snow cover likely smooth borehole-derived temperature results, resulting in negligible differences between GT/SAT warming trends for longer (such as centennial) time periods [29] [30] . It is therefore perhaps surprising that we observe a slight difference between air and surface temperature warming near Helena over this relatively long 40 year period. For completeness, we analyze several potential mechanisms that can cause different air and surface temperature changes, including changing precipitation and snow-cover patterns, location differences, and potential anthropogenic factors.

Figure 6. Annual average SAT in Helena Montana (lower line) compared to the average annual SAT in the contiguous United States (upper line) since 1975. Rates of SAT warming in Helena (0.032˚C/yr) are consistent with Contiguous US trend (0.036˚C/yr). The standard deviation for SAT warming in Helena (0.014˚C/yr), however, it is significant, totaling 44% of the mean SAT warming value.
8.1. Changing Precipitation Patterns as an Explanation of Lower GT Warming
Changing microclimatic conditions can cause changes in surface temperature. Specifically, greater cloud cover can sometimes reduce surface warming by increasing atmospheric albedo and reflecting more light back into space [42] . Less sunlight absorbed at the surface results in less radiative surface heating. In addition, cloud cover can also modulate temperature and reduce daily temperature changes via atmospheric insulation [43] . Therefore, one potential explanation for lower GT warming near Helena is that the region has experienced fewer sunny days in the last 40 years resulting in less direct surface warming despite warmer SAT values caused by cloud insulation. This implies that any change in regional cloud cover during this period may impact both the SAT and GT warming rates.
Using precipitation as a proxy for regional cloud cover, we can assess if and how weather patterns changed solar radiance in the Helena area during the past several decades. Using NOAA NCDC precipitation data dating back to 1938, the mean annual precipitation from 1938 to 1975 is 27.96 +/− 6.18 cm (1-sigma) (NOAA, 2014). Since 1975, the mean precipitation in Helena has been 29.36 +/− 7.01 cm (1-sigma). This difference is not statistically significant. Although the distribution of rainfall and cloud cover may vary intra-annually, our admittedly preliminary analysis suggests there have been no significant change in annual precipitation in Montana during the past 76 years (Figure 7(a)). This observation supports the concept that decadal-scale changes in precipitation (and associated cloud cover) cannot easily explain differences between GT and SAT warming rates in Helena during the past 40 years.
8.2. Snow Cover as a Possible Cause of Lower GT Warming
Changes in snow cover can also directly affect the rate of surface warming, especially over short (<100 yr) timescales [35] [38] [44] [45] . Snow, with its lower thermal conductivity, acts as an insulator, thereby reducing the effect of both winter cooling and summer heating in the subsurface. Over century timescales, it is unlikely that variations in snowfall have a significant impact on GT warming rates due to the inherently diffusive nature of heat flow at these well sites [38] [39] . However, at shorter time scales, variations in snowfall may have a potentially significant influence on estimated GT changes [45] . In Montana and most of the Northern US Rocky Mountain region, snow is typically present on the surface for less than 6 months of the year and insulates the surface from colder temperatures during the winter and early spring months. If snow cover is relatively constant
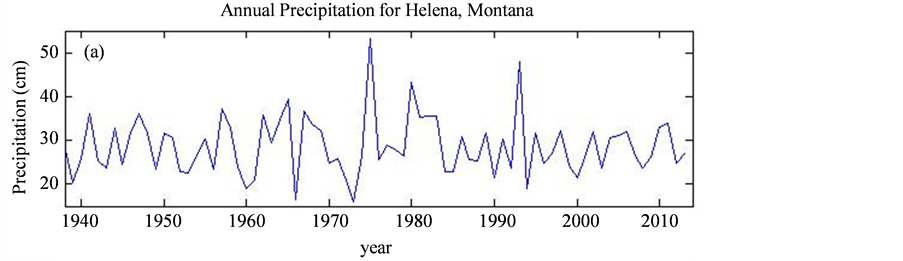
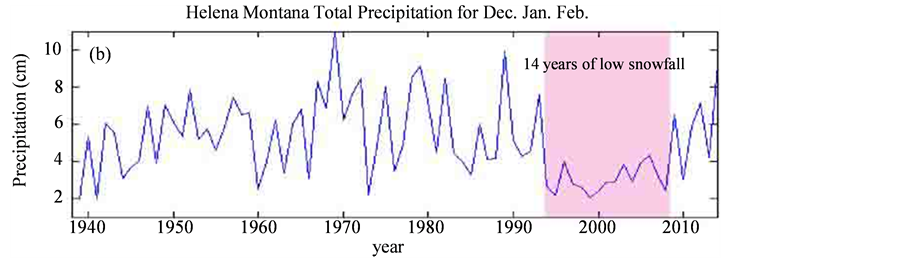
Figure 7. The total amount of precipitation in Helena area since 1938 (a) and total amount of precipitation during the three coldest months of the year (December, January, February) in Helena (b). Although total precipitation rates remained relatively constant during the past 76 years, there was a 14 year period of anomalously low precipitation/snowfall during the coldest months of the year. A reduction in snowfall can result in an under-prediction of GT warming rates due to less thermal insulation provided by snow-cover.
each year in Montana, then regions experiencing significant snow and ground-freeze during the winter will typically over-predict temperature change using GT measurements, since the coldest temperatures are insulated from the ground surface by snow and ice [35] . As a result, we might expect warming rates based on GT measurements to exceed warming rates predicted from SAT measurements in locations that receive significant snow fall or are below freezing for several months of the year. Perhaps surprisingly, we observe the opposite phenomenon for GT in western Montana at these well sites. Specifically, GT warming near Helena is less than the SAT warming observed during the past 40 years. It is therefore difficult to explain lower GT warming rates over the past 40 years, unless there has been a significant change to the snowfall pattern during that period. For example, if there are significant (decadal) periods of markedly less snowfall during the 40 year period, it would cause the surface to be exposed to colder temperatures, resulting in anomalously low GT measurements and less apparent warming [44] . Our analysis of precipitation during the winter months in Helena, Montana for the last 75 years suggests a statistically significant reduction in snow cover likely occurred from 1994-2008. During this 14 year period, snowfall was reduced by as much as ~50% below the 75 year average (Figure 7(b)), with precipitation dropping from an average value of 5.7 +/− 2.0 cm to 3.0 +/− 0.7 cm. This suggests significantly less snow fall and less snow cover during this 14 year period (Figure 7(b)). It is therefore possible that the difference between GT and SAT changes observed since 1975 results in part from reduced snow cover during this 14 year period that caused less surface insolation from cool temperatures, and therefore, anomalously low GT warming during that time.
8.3. Urban Heat Island Effect as a Cause of Greater SAT Warming
An additional explanation for the difference between GT and SAT warming rates is that anomalous air temperature warming has occurred near the Helena Airport where SAT measurements are made due to city growth and increased urban heat island effects during the past 40 years. Urban heat island warming occurs due to human activity and development. Even relatively small population (<100,000) Montana cities such as Great Falls and Billings Montana have experienced significant urban heating that exceeds background (adjacent rural) air temperatures by more than 3˚C [46] . Helena’s NOAA-recorded SAT measurements are made at Helena Regional Airport, less than 3 km northeast from the city center. In contrast, the Fort Harrison well is located 8 km west of Helena in the middle of a large (34 km2) undeveloped piece of land. While Lewis and Clark County where Helena is located has doubled in population in the last 40 years, nearly all of the urban development has been to the north and east of the city in the direction of the airport; not at Fort Harrison, which borders uninhabited BLM and National Forest property north and west of the city.
The size of a city correlates positively with the amount of urban heating, and the urban heat island effect has the ability to increase regional surface temperatures by several degrees (e.g. [20] ). Several factors, including wind, vegetation, population size, and population density, influence urban heating, making it difficult to constrain urban heating magnitude. In general, however, urban heating correlates with population [47] , with temperature increasing logarithmically with population change. The most significant rate-change in urban heating generally occurs in population centers between 1000 - 100,000 people [48] . Helena, with a population of ~30,000 falls within this range and has increased in population by nearly 50% since the mid-1970s. The observed higher rates of SAT warming compared to GT warming since 1975 may therefore be related to an increased urban heat island effect in the area. This is likely not true for the Fort Harrison well or CD9, both of which are located away from any recent development or population centers.
Differences in SAT/GT measurement locations and, in particular, the regional wind direction also likely play an important role in GT/SAT warming differences. Montana’s prevailing winds, westerlies, blow from the southwest. As a result, the airport, located just northeast of the city, is bathed in air that has passed over the city center. In contrast, Fort Harrison, located 8 km west of the city typically receives air that passes over hundreds of square miles of sparsely inhabited mountains and national forest land. It is therefore likely that SAT measurements at the airport are disproportionately impacted by anthropogenic effects and that the airport’s location is at least partially responsible for the apparently higher rates of SAT warming in the Helena area during the past 40 years.
Based on these observations, we use GT and SAT measurements to place bounds on regional warming, with GT measurements indicating lower bounds for warming and SAT values representing an upper limit for warming in the region. Specifically, we suggest SAT warming rates of 0.32˚C/decade derived from temperature measurements made at Helena Airport represent a maximum warming rate due to the fact that urbanization, development, and prevailing winds all promote increased anthropogenic warming at the SAT measurement site. We therefore bracket warming in the Helena area for the past 40 years between 0.12˚C and 0.32˚C/decade, with an average warming rate of 0.22˚C/decade.
9. Discussion
Both SAT and GT measurements indicate that western Montana has experienced statistically significant warming during the past 40 years. If SAT/GT changes represent approximate maximum and minimum warming rates, as suggested here, the values (0.12˚C - 0.32˚C/decade) are consistent with mean global air temperature warming estimates of ~0.2˚C/decade since 1976 [2] . The rate of warming at the higher elevation CD9 well is 42% higher than the rate of warming at the lower elevation Fort Harrison well. It is unlikely this difference is caused by anthropogenic factors since neither well is located in a city center and no major surface changes have occurred at the sites during the last 40 years. Differences in snow cover between the sites, as already noted, is however one possible explanation. Specifically, one way we could explain the anomaly between well sites is if snow cover remained relatively stable at the higher elevation CD9 well but decreased at Fort Harrison. Although precipitation records for Helena indicate snow cover likely decreased, we currently have no detailed snow cover or precipitation measurements for CD9. It is therefore difficult to conclude whether snow cover is the cause of GT warming differences between well sites. Higher rates of warming at CD9, however, do agree with predictive models of air temperature change along the American Cordillera that suggest the highest elevations experience the most significant warming due to increasing atmospheric CO2 levels [45] . Biological studies also indicate high elevation environments in western North America have recently experienced some of the most significant warming and unprecedented snowpack reduction across the Northern Rockies during the late 20th century (e.g. [7] [13] ). Nonetheless, without detailed snow cover data for the CD9 well site, our results cannot yet confirm whether greater warming at this site is a result of snow cover differences or other mechanisms.
10. Implications for Western Montana and the Northern US Rockies Snowpack
Based on these results, western Montana experienced an average temperature increase of 0.48˚C - 1.28˚C during the past 40 years, rates similar to those suggested by other 20th century borehole and SAT temperature studies for North America (e.g. [29] [49] ). This rate is 5 to 10 times higher than the estimated average during the past 500 years of Earth’s history (e.g. [30] ). If this rate remains constant, and does not increase in this region as some studies predict (e.g. [45] ), western Montana’s average temperature will increase ~1˚C (1.8 degrees F) every ~45 years, with temperatures 2.2˚C warmer in western Montana by the end of the 21st century.
Our measured rate of warming has important implications for Montana’s ecosystems and water supply. Although it is currently difficult to predict future micro-climatic changes across the region, it is possible using measured warming rates and elevation-temperature relationships to estimate the average rate of winter freeze line retreat and its implication for regional snowpack. The freeze line in the winter months in western Montana is determined by temperature, which is controlled to first order by elevation (Figure 8). As warming occurs over the years, the location where temperature is consistently below 0˚C during the winter months migrates to higher elevations. We estimate the Northern US Rocky Mountain winter freeze line elevation by plotting the mean monthly reported high SAT temperature versus elevation at 116 sites in Western Montana, Eastern Idaho, and Northwestern Wyoming for the three coldest months of the year (December, January, February) (Figure 8, Table 1). Analysis of SAT measurements versus elevation for this region suggests surface temperature decreases at

Figure 8. Crosses indicate average measured high temperature for December, January, and February for 115 cities and towns in the northern US Rockies based on NOAA data. The solid red line indicates the mean rate of temperature cooling that occurs with higher elevation based on atmospheric studies. Note that the mean rate of cooling with increased elevation generally matches the temperature-elevation trend for cities and towns in the northern Rockies. The dashed gray and red lines indicate how the temperature-elevation trend has shifted since 1974 and the expected shift by 2060, based on warming estimates from this study. The implication is that the elevation of the winter freeze line for December, January, and February in the Northern US Rockies will migrate up ~290 m (~950 ft) between 1974 and 2060.

Table 1. All temperature data obtained from http://www.usclimatedata.com/climate/.
a rate of 5.1˚C +/− 2.0˚C per kilometer increase in elevation. This rate is consistent with atmospheric measurements that indicate an average relative cooling of 6.5˚C per kilometer [50] (Figure 8). Our analysis therefore indicates that the freeze line currently exist at an average elevations of ~1610 m (~5250 ft) during the three coldest months of the year in the northern US Rockies.
If, as our study suggests, the surface warms at an average rate of 0.22˚C /decade, the mean freeze line elevation is currently migrating upward at an approximate rate of 18 - 50 m/decade, or on average, 33.4 m/decade (or 334 m per century) (Figure 8). This implies that in 1974, the freeze line was ~135 m lower, at a mean elevation during the winter months of ~1475 m. If warming continues at a rate of ~1˚C every 46 years, as this study suggests, the winter freeze line during the winter months will retreat an additional ~155 m to an elevation of ~1765 m (~5800 ft) by 2060.
Based on these values, we place constraints on the area where ground freeze will occur during the winter months and how the winter freeze line and associated snowpack will retreat in the next 50 years. Using high resolution (10 m × 10 m) Shuttle Radar Topography Mission data, we calculate that the freeze line area has decreased by 21% in the Northern US Rockies during the past 40 years (1974 to 2014) (Figure 9). This reduction in freeze-line area is due in large part to the fact that slope angles are modestly low (less than 10 degrees) along

Figure 9. The winter freeze line for Western Montana and neighboring US Mountain West states for 1974 (a), 2014 (b), and projected for 2060 (c). White areas indicate regions where average high temperatures never exceed 0˚C during the months of December, January, and February. Red areas in (b) (c) indicate where the freeze line has, on average, retreated due to warming since 1974 for years 2014 and projected for 2060. The 2060 projection assumes warming rates remain constant and do not accelerate as several studies suggest. Average winter freeze line elevations for (a), (b), and (c), are estimated at 1475 m, 1610 m, and 1765 m, respectively.
the Northern US Rocky Mountain front at elevations below 2000 m. Assuming this warming trend continues at the same average rate of 0.22˚C/decade and will not increase (as our analysis from 2013-2015 suggests), the area below the winter freeze line in the Northern US Rockies will be reduced to less than 60% of original 1974 values in 2060 (Figure 6).
These results have significant implications for Montana and neighboring Northern US Rocky Mountain states. As much as 75% of the stream water in the western US is sourced from melting snowpack [51] . Notably, the analysis indicates significant freeze line retreat occurs in lower elevation mountain ranges of northwestern Montana, including the Sawtooth and Lewis and Clark Ranges, with virtually no long-term winter snowpack existing in these ranges predicted in the coming decades. The analysis also implies less winter snow and ice cover in the Snake River Plain and central Wyoming during the winter months.
An important caveat of this study is that the analysis only assesses the freeze line location and not changes in precipitation and humidity patterns due to El Nino Southern Oscillation (ENSO) variability or longer-term climatic shifts that can also influence both regional precipitation patterns and snow sublimation rates. Nonetheless, several studies indicate a strong correlation exists between temperature and snow cover in the United States (e.g. [43] ), with clear evidence for decreased snow cover during the months of December, January, and February in regions experiencing anomalously warm surface temperatures [52] . Therefore, although the analysis does not yet account for other important factors that influence snowpack, the results provide first-order insight into expected freeze-line retreat, with potentially significantly (21% - 40%) reductions in snowpack area occurring in the coming decades.
If the analysis is correct, it implies significantly less water supplied to rivers, lakes, and streams in the form of meltwater. Less snow run-off will increase mountain stream and river water temperatures, resulting in potentially detrimental effects on cold-water native lake and river life, such as salmonid fish in the region [53] [54] . Indeed, our results are consistent with recent studies indicating stream temperatures in the Northern Rockies have warmed over the past 30 years at rates between 0.17˚C - 0.22˚C/km--a likely result of a retreating winter freeze line elevations and less water sourced from snowpack [55] . Our geophysical analysis implies that for native cold-water flora and fauna to exist at temperatures best suited for their survival, they will likely need to migrate to higher elevations at rates of ~3.3 m/yr. The results are therefore consistent with other biological and geophysical studies indicating a rapidly retreating snowpack in this region [55] - [57] .
11. Conclusion
GT and SAT measurements indicate that surface temperature in western Montana has increased at an average rate of 0.12˚C - 0.32˚C/decade during the past 40 years, with borehole-derived GT measurements providing a low-end estimate and SAT measurements providing a high-end estimate for warming across the region. We place higher certainty in the GT measurements as they are likely less impacted by anthropogenic effects, however, uncertainty in borehole-derived GT measurements associated with snow pack remains. Nonetheless, all results indicate rapid warming of at least 0.5˚C occurred in the region during the past 40 years. Results are consistent with other biological and geophysical studies across the region that suggests the area is undergoing rapid warming with significant environmental ramifications (e.g. [2] [9] [55] [58] ). As the Northern US Rockies continues to experience both population and economic growth, pressure on the region’s limited water resources― much of which supports the regional economy―will continue to increase [59] . Preparing for changes associated with continued warming and meltwater depletion in this region therefore requires prudent evaluation, analysis, and planning to minimize economic, societal, and environmental costs.
Acknowledgements
Student Research Funds were provided by SMU’s Institute for the Study of Earth and Man. We thank the staff at the Fort Harrison Army Reserve Base for providing access to the well site. M.J.H. thanks John and Catherine Schoellkopf for providing both housing and stimulating discussions that promoted much of this research.
Cite this paper
Matthew J. Hornbach,Maria Richards,David Blackwell,Cliff Mauroner,Casey Brokaw, (2016) 40 Years of Surface Warming in the Northern US Rocky Mountains: Implications for Snowpack Retreat. American Journal of Climate Change,05,275-295. doi: 10.4236/ajcc.2016.52023
References
- 1. Karl, T.R. and Trenberth, K.E. (2003) Modern Global Climate Change. Science, 302, 1719-1723.
http://dx.doi.org/10.1126/science.1090228 - 2. Hansen, J., Makiko S., Reto R., Lo, K., Lea, D.W. and Medina-Elizade, M. (2006) Global Temperature Change. Proceedings of the National Academy of Sciences of the United States, 103, 14288-14293.
http://dx.doi.org/10.1073/pnas.0606291103 - 3. NOAA (National Oceanic and Atmospheric Administration) (2015) National Climatic Data Center. www.ncdc.noaa.gov/oa/ncdc.html
- 4. Anwer, M. (2015) Nature of Centennial Global Climate Change from Observational Records. American Journal of Climate Change, 4, 337-354.
http://dx.doi.org/10.4236/ajcc.2015.44027 - 5. Gaffen, D.J. and Ross, R.J. (1999) Climatology and Trends of US Surface Humidity and Temperature. Journal of Climate, 12, 811-828.
http://dx.doi.org/10.1175/1520-0442(1999)012<0811:CATOUS>2.0.CO;2 - 6. Mote, P.W., Hamlet, A.F., Clark, M.P. and Lettenmaier, D.P. (2005) Declining Mountain Snowpack in Western North America. Bulletin of the American Meteorological Society, 86, 39-49.
http://dx.doi.org/10.1175/BAMS-86-1-39 - 7. Diaz, H.F. and Eischeid, J.K. (2007) Disappearing “Alpine Tundra” Koppen Climatic Type in the Western United States. Geophysical Research Letters, 34, L18707.
http://dx.doi.org/10.1029/2007gl031253 - 8. Stocker, T., Qin, D., Plattner, G.-K., Tignor, M., Allen, S.K., Boschung, J., Nauels, A., Xia, Y., Bex, V. and Midgley, P.M., Eds. (2014) Climate Change 2013: The Physical Science Basis. Cambridge University Press, Cambridge.
- 9. Cayan, D.R. (1996) Interannual Climate Variability and Snowpack in the Western United States. Journal of Climate, 9, 928-948.
http://dx.doi.org/10.1175/1520-0442(1996)009<0928:ICVASI>2.0.CO;2 - 10. Belmecheri, S., Babst, F., Wahl, E.R., Stahle, D.W. and Trouet, V. (2015) Multi-Century Evaluation of Sierra Nevada Snowpack. Nature Climate Change, 6, 2-3.
http://dx.doi.org/10.1038/nclimate2809 - 11. Hamlet, A.F., Mote, P.W., Clark M.P. and Lettenmaier, D.P. (2005) Effects of Temperature and Precipitation Variability on Snowpack Trends in the Western United States. Journal of Climate, 18, 4545-4561.
http://dx.doi.org/10.1175/JCLI3538.1 - 12. Stewart, I.T. (2009) Changes in Snowpack and Snowmelt Runoff for Key Mountain Regions. Hydrological Processes, 23, 78-94.
http://dx.doi.org/10.1002/hyp.7128 - 13. Pederson, G.T., Gray, S.T., Woodhouse, C.A., Betancourt, J.L., Fagre, D.B., Littell, J.S., Watson, E., Luckman, B.H. and Graumlich, L.J. (2011) The Unusual Nature of Recent Snowpack Declines in the North American Cordillera. Science, 333, 332-335.
http://dx.doi.org/10.1126/science.1201570 - 14. Barnett, T.P., Adam, J.C. and Lettenmaier, D.P. (2005) Potential Impacts of a Warming Climate on Water Availability in Snow-Dominated Regions. Nature, 438, 303-309.
http://dx.doi.org/10.1038/nature04141 - 15. Folland, C., Karl, T., Christy, J.R., Clarke, R.A., Gruza, G.V., Jouzel, J., Mann, M.E., Oerlemans, J., Salinger, M.J. and Wang, S.W. (2001) Chapter 2:Observed Climate Variability and Change. In: Houghton, J.T., et al. Eds., Climate Change 2001: The Physical Science Basis, Cambridge University Press, Cambridge, 101-181.
- 16. Higgins, R.W., Leetmaa, A. and Kousky, V.E. (2002) Relationships between Climate Variability and Winter Temperature Extremes in the United States. Journal of Climate, 15, 1555-1572.
http://dx.doi.org/10.1175/1520-0442(2002)015<1555:RBCVAW>2.0.CO;2 - 17. Mote, P.W. (2006) Climate-Driven variability And Trends in Mountain Snowpack in Western North America. Journal of Climate, 19, 6209-6220.
http://dx.doi.org/10.1175/JCLI3971.1 - 18. Regonda, S.K., Rajagopalan, B., Clark, M. and Pitlick, J. (2005) Seasonal Cycle Shifts in Hydroclimatology over the Western United States. Journal of Climate, 18, 372-384.
http://dx.doi.org/10.1175/JCLI-3272.1 - 19. Isaac, V. and Van Wijngaarden, W.A. (2012) Surface Water Vapor Pressure and Temperature Trends in North America during 1948-2010. Journal of Climate, 25, 3599-3609.
http://dx.doi.org/10.1175/JCLI-D-11-00003.1 - 20. Zhou, B., Rybski, D. and Kropp, J.P. (2013) On the Statistics of Urban Heat Island Intensity. Geophysical Research Letters, 40, 5486-5491.
http://dx.doi.org/10.1002/2013GL057320 - 21. Karl, T.R. and Williams Jr., C.N. (1987) An Approach to Adjusting Climatological Time Series for Discontinuous Inhomogeneities. Journal of Climate and Applied Meteorology, 26, 1744-1763.
http://dx.doi.org/10.1175/1520-0450(1987)026<1744:AATACT>2.0.CO;2 - 22. Karl, T.R., Diaz, H.F. and Kukla, G. (1988) Urbanization: Its Detection and Effect in the United States Climate Record. Journal of Climate, 1, 1099-1123.
http://dx.doi.org/10.1175/1520-0442(1988)001<1099:UIDAEI>2.0.CO;2 - 23. Karl, T.R. and Jones, P.D. (1989) Urban Bias in Area-Averaged Surface Air Temperature Trends. Bulletin of the American Meteorological Society, 70, 265-270.
http://dx.doi.org/10.1175/1520-0477(1989)070<0265:UBIAAS>2.0.CO;2 - 24. PielkeSr, R., Nielsen-Gammon, J., Davey, C., Angel, J., Bliss, O., Doesken, N., Cai, M., Fall, S., Niyogi, D., Gallo, K. and Hale, R. (2007) Documentation of Uncertainties and Biases Associated with Surface Temperature Measurement Sites for Climate Change Assessment. Bulletin of the American Meteorological Society, 88, 913-928.
http://dx.doi.org/10.1175/BAMS-88-6-913 - 25. Lachenbruch, A.H., Sass, J.H., Marshall, B.V. and Moses, T.H. (1982) Permafrost, Heat Flow, and the Geothermal Regime at Prudhoe Bay, Alaska. Journal of Geophysical Research: Solid Earth, 87, 9301-9316.
http://dx.doi.org/10.1029/JB087iB11p09301 - 26. Huang, S., Pollack, H.N. and Shen, P.Y. (2000) Temperature Trends over the Past Five Centuries Reconstructed from Borehole Temperatures. Nature, 403, 756-758.
http://dx.doi.org/10.1038/35001556 - 27. Harris, R.N. and Chapman, D.S. (1995) Climate Change on the Colorado Plateau of Eastern Utah Inferred from Borehole Temperatures. Journal of Geophysical Research: Solid Earth (1978-2012), 100, 6367-6381.
http://dx.doi.org/10.1029/94JB02165 - 28. Harris, R.N. and Chapman, D.S. (1997) Borehole Temperatures and a Baseline for 20th-Century Global Warming Estimates. Science, 275, 1618-1621.
http://dx.doi.org/10.1126/science.275.5306.1618 - 29. Harris, R.N. and Chapman, D.S. (2001) Mid-Latitude (30°-60° N) Climatic Warming Inferred by Combining Borehole Temperatures with Surface Air Temperatures. Geophysical Research Letters, 28, 747-750.
http://dx.doi.org/10.1029/2000GL012348 - 30. Harris, R.N. (2007) Variations in Air and Ground Temperature and the POM-SAT Model: Results from the Northern Hemisphere. Climate of the Past, European Geosciences Union (EGU), 3, 611-621.
http://dx.doi.org/10.5194/cp-3-611-2007 - 31. Beck, A.E. (1977) Climatically Perturbed Temperature Gradients and Their Effect on Regional and Continental Heat Flow Measurements. Tectonophysics, 41, 17-39.
http://dx.doi.org/10.1016/0040-1951(77)90178-0 - 32. Houghton, J.T., Ding, Y., Griggs, D.J., Noguer, M., vander Linden, P.J., Dai, X., Maskell, K. and Johnson, C.A., Eds. (2001) Climate Change 2001: The Scientific Basis. Intergovernmental Panel on Climate Change, Cambridge University Press, Cambridge.
- 33. Harris, R.N. and Chapman, D.S. (2005) Borehole Temperatures and Tree Rings: Seasonality and Estimates of Extratropical Northern Hemispheric Warming. Journal of Geophysical Research: Earth Surface, 110, F04003.
http://dx.doi.org/10.1029/2005jf000303 - 34. Hyndman, R.D. and Everett, J.E. (1968) Heat Flow Measurements in a Low Radioactivity Area of the Western Australian Precambrian Shield. Geophysics Journal, 14, 479-486.
http://dx.doi.org/10.1111/j.1365-246X.1967.tb06267.x - 35. Gosnold, W.D., Todhunter, P.E. and Schmidt, W. (1977) The Borehole Temperature Record of Climate Warming in the Mid-Continent of North America. Global and Planetary Change, 15, 33-45.
http://dx.doi.org/10.1017/CBO9780511606021 - 36. Beardsmore G.R. and Cull, J.P. (2001) Crustal Heat Flow: A Guide to Measurement and Modeling. Cambridge University Press, Cambridge.
http://dx.doi.org/10.1016/S0921-8181(97)00002-7 - 37. Blackwell, D.D., Steele, J.L. and Brott, C.A. (1980) The Terrain Effect on Terrestrial Heat Flow. Journal of Geophysical Research: Solid Earth, 85, 4757-4772.
http://dx.doi.org/10.1029/JB085iB09p04757 - 38. Bartlett, M.G., Chapman, D.S. and Harris, R.N. (2004) Snow and the Ground Temperature Record of Climate Change. Journal of Geophysical Research: Earth Surface, 109, F04008.
http://dx.doi.org/10.1029/2004jf000224 - 39. Bartlett, M.G., Chapman, D.S. and Harris, R.N. (2006) A Decade of Ground-Air Temperature Tracking at Emigrant Pass Observatory, Utah. Journal of Climate, 19, 3722-3731.
http://dx.doi.org/10.1175/JCLI3808.1 - 40. Blackwell, D.D. and Baag, C.-G. (1973) Heat Flow in a “Blind” Geothermal Area near Marysville, Montana. Geophysics, 38, 941-956.
http://dx.doi.org/10.1190/1.1440384 - 41. Bristow, K.L. (1998) Measurement of Thermal Properties and Water Content of Unsaturated Sandy Soil Using Dual-Probe Heat-Pulse Probes. Agricultural and Forest Meteorology, 89, 75-84.
http://dx.doi.org/10.1016/S0168-1923(97)00065-8 - 42. Schneider, S.H. (1972) Cloudiness as a Global Climatic Feedback Mechanism: The Effects on the Radiation Balance and Surface Temperature of Variations in Cloudiness. Journal of the Atmospheric Sciences, 29, 1413-1422.
http://dx.doi.org/10.1175/1520-0469(1972)029<1413:CAAGCF>2.0.CO;2 - 43. Karl, T.R., Jones, P.D., Knight, R.W., Kukla, G., Plummer, N., Razuvayev, V., Gallo, K.P., Lindseay, J., Charlson, R.J. and Peterson, T.C. (1993) Asymmetric Trends of Daily Maximum and Minimum Temperature. Papers in Natural Resources, Paper 185.
- 44. Mann, M.E. and Schmidt, G.A. (2003) Ground vs. Surface Air Temperature Trends: Implications for Borehole Surface Temperature Reconstructions. Geophysical Research Letters, 30, 1607
http://dx.doi.org/10.1029/2003gl017170 - 45. Bradley, R.S., Keimig, F.T. and Diaz, H.F. (2004) Projected Temperature Changes along the American Cordillera and the Planned GCOS Network. Geophysical Research Letters, 31, L16210.
http://dx.doi.org/10.1029/2004gl020229 - 46. Gallo, K.P. and Owen, T.W. (1999) Satellite-Based Adjustments for the Urban Heat Island Temperature Bias. Journal of Applied Meteorology, 38, 806-813.
http://dx.doi.org/10.1175/1520-0450(1999)038<0806:SBAFTU>2.0.CO;2 - 47. Streutker, D.R. (2003) Satellite-Measured Growth of the Urban Heat Island of Houston, Texas. Remote Sensing of Environment, 85, 282-289.
http://dx.doi.org/10.1016/S0034-4257(03)00007-5 - 48. Oke, T.R. (1981) Canyon Geometry and the Nocturnal Urban Heat Island: Comparison of Scale Model and Field Observations. Journal of Climatology, 1, 237-254.
http://dx.doi.org/10.1002/joc.3370010304 - 49. Baker, D.G. and Ruschy, D.L. (1993) The Recent Warming in Eastern Minnesota Shown by Ground Temperatures. Geophysical Research Letters, 20, 371-374.
http://dx.doi.org/10.1029/92GL02724 - 50. Danielson, E.W., Levin, J. and Abrams, E. (2003) Meteorology. McGraw-Hill, New York.
- 51. Palmer, P.L. (1988) The SCS Snow Survey Water Supply Forecasting Program: Current Operations and Future Directions. Proceeding of the Western Snow Conference, Kalispell, 19-21 April 1998, 43-51.
- 52. Leathers, D.J. and Robinson, D.A. (1993) The Association between Extremes in North American Snow Cover Extent and United States Temperatures. Journal of Climate, 6, 1345-1355.
http://dx.doi.org/10.1175/1520-0442(1993)006<1345:TABEIN>2.0.CO;2 - 53. Beitinger, T.L., Bennett, W.A. and McCauley, R.W. (2000) Temperature Tolerances of North American Freshwater Fishes Exposed to Dynamic Changes in Temperature. Environmental Biology of Fishes, 58, 237-275.
http://dx.doi.org/10.1023/A:1007676325825 - 54. Gooseff, M.N., Strzepek, K. and Chapra, S.C. (2005) Modeling the Potential Effects of Climate Change on Water Temperature Downstream of a Shallow Reservoir, Lower Madison River, MT. Climatic Change, 68, 331-353.
http://dx.doi.org/10.1007/s10584-005-9076-0 - 55. Isaak, D.J., Wollrab, S., Horan, D. and Chandler, G. (2012) Climate Change Effects on Stream and River Temperatures across the Northwest US from 1980-2009 and Implications for Salmonid Fishes. Climatic Change, 113, 499-524.
http://dx.doi.org/10.1007/s10584-011-0326-z - 56. Keleher, C.J. and Rahel, F.J. (1996) Thermal Limits to Salmonid Distributions in the Rocky Mountain Region and Potential Habitat Loss Due to Global Warming: A Geographic Information System (GIS) Approach. Transactions of the American Fisheries Society, 125, 1-13.
http://dx.doi.org/10.1577/1548-8659(1996)125<0001:TLTSDI>2.3.CO;2 - 57. Battin, J., Wiley, M.W., Ruckelshaus, M.H., Palmer, R.N., Korb, E., Bartz, K.K. and Imaki, H. (2007) Projected Impacts of Climate Change on Salmon Habitat Restoration. Proceedings of the National Academy of Sciences of the United States of America, 104, 6720-6725.
http://dx.doi.org/10.1073/pnas.0701685104 - 58. Pierce, D.W., Barnett, T.P., Hidalgo, H.G., Das, T., Bonfils, C., Santer, B.D., Bala, G., Dettinger, M.D., Cayan, D.R., Mirin, A. and Wood, A.W. (2008) Attribution of Declining Western US Snowpack to Human Effects. Journal of Climate, 21, 6425-6444.
http://dx.doi.org/10.1175/2008JCLI2405.1 - 59. Grau, K. (2014) 2013 Nonresident Visitation, Expenditures, and Economic Impact Estimates, Report: Institute for Tourism and Recreation, University of Montana, Missoula, 1-13.
NOTES

*Corresponding author.