American Journal of Analytical Chemistry
Vol. 3 No. 2 (2012) , Article ID: 17293 , 7 pages DOI:10.4236/ajac.2012.32023
Spectroscopic Discrimination of Bone Samples from Various Species
Department of Chemistry, University at Albany, State University of New York, Albany, USA
Email: *ilednev@albany.edu
Received November 7, 2011; revised December 13, 2011; accepted December 26, 2011
Keywords: Forensic Science; Bone Tissue; Raman Spectroscopy; Chemometrics
ABSTRACT
Determining the species of origin of skeletal remains is critical in a forensic and anthropologic context. However, there are very few methods that use a chemical approach to assist in this determination. In this study, Raman spectroscopy was used to discriminate bone samples originating from four different species (bovine, porcine, turkey and chicken). Spectra were obtained using a near infrared laser at 785-nm. All spectra were combined in a single matrix and processed using partial least squares discriminate analysis (PLS-DA) with leave-one-out cross-validation. Three components were found to adequately describe the system. The first two components which contributed over 85% of spectral data was seen to completely separate the four species of origin in a two dimensional scores plot. A 95% confidence interval was draw around score points of each species class with very slight overlap. The first two components were seen to have large contributions from bioapatite and collagen, the main components of bone. This study serves as a preliminary investigation to evaluate the effectiveness of Raman spectroscopy to discriminate the species of origin of bone tissue.
1. Introduction
Skeletal remains found at a suspected crime scene are of particular interest to forensic investigators. However, there is little forensic importance if the skeletal remains are in fact non-human. The critical determination of whether skeletal remains are human falls on the forensic anthropologist [1]. This is relatively simple task when analyzing a full skeleton or complete bone, but can be very difficult when only fragmentary remains are obtained.
Visual identification methods are well studied and accepted in the scientific community. So much is known about the skeletal features and morphology of human remains that the determination of human origin of a whole bone is considered relatively simple. However, these methods are complicated when only a fragment of bone is in question. Small bone fragments are common in mass disasters such as earth quakes, terrorist attacks, or military battles.
Bone fragments can be devoid of any species specific morphological characteristics. In these cases, a histological analysis is often employed [2]. This approach requires imbedding and cross sectioning of samples and is therefore a destructive process. This type of analysis is considerably destructive because of the processing involved to obtain a cross section of bone.
Metric analysis of Haversian canals in bones has been used with varying success in the verification of human remains. This type of analysis involves measurements the narrow channel in the center of the osteon substructure and comparing to known values and indexes. A recent study by Cattaneo et al. (2009) [3] has shown significant limits with this type of evaluation. Although they reported a success rate of 70% with adult long bones, this type of analysis was seen to be especially problematic in young human. Such samples had an error rates as high as 93% in the case of newborn long bones and 68% for newborn flat bones.
The field of forensic anthropology is highly specialized, making rapid identification practically impossible. There is an interest for a more rapid, high throughput, reliable and non-destructive technique to identify the species of origin of skeletal remains. A Raman spectroscopic approach offers several advantages. Foremost, this technique is non-destructive and highly flexible for other forensic identification tasks. If a robust, automated data treatment process is developed, an examiner can be minimally trained. This type of analysis could eliminate examiner bias because it is not dependent on subjective observations. Most importantly, using a microscopic Raman system, a spectrum can be obtained from an area in the scale of microns. While current methods are hindered when analyzing fragmentary remains, there would be no such impediment using this approach.
It is our hypothesis that a method for species discrimination based on chemical differences in bone can be established. Using Raman spectroscopy, it is possible that a non-destructive and rapid technique to distinguish human remains can provide a favorable alternative to the current methodology. A technique that avoids physical and chemical alterations is attractive in a forensic setting because evidence is suitable for further testing. The main objective of this study is to develop a method based on Raman spectroscopic data that can be used to discriminate species. The proposed methodology is potentially applicable to the fields of anthropology for cultural studies and forensic science for criminal investigations.
Raman spectroscopy is an extremely flexible analytical technique with a variety of forensic applications [4]. This technique is currently being explored for the identification and classification of drugs [5], gunshot residue [6], fibers [7], paint [8-10] and ink [11] samples. When a laser is applied to a sample, light will be scattered resulting in photons with an initial (elastic scattering) or changed energy. Inelastic scattering occurs when photons loose/gain energy to excite/deactivate molecular vibrations in the sample. A Raman spectrum is obtained by collecting and analyzing these inelastic photons. The intensity of the inelastic photons is plotted against the energy in wavenumbers. Chemical compounds will produce a unique and predictable spectrum that is a result of molecular vibrational modes. Raman spectroscopy is advantageous for the field of forensic science because of the limited sample preparation, rapid results and the in-field analysis possibilities with portable Raman instruments [12-14]. The laser light is typically non-destructive so further testing is not affected in any way.
Bone tissue is mainly composed of inorganic mineral imbedded in an organic protein matrix. The inorganic portion, bioapatite, is similar to the natural geologic mineral hydroxyapatite. Bioapatite is a carbonated form of this mineral. The organic portion consists mainly of type I collagen. By weight, the organic and inorganic portions of bone are roughly 30% and 70% respectively. The composition of bone tissue varies significantly between species. Aerssens et al. reports several measurable differences in cortical bone between human, pig, cow, dog, sheep, chicken, and rat [15]. Key interspecies bone composition differences noted were collagen content, dry ash weight and non-collagen protein content.
Virkler and Lednev have recently introduced a new approach based on the combination of Raman spectroscopy and advanced statistical analysis for identification of body fluid traces [4,16-21] for forensic purposes. The approach relies on the ability of Raman spectroscopy to probe and characterize intrinsically heterogeneous body fluid samples. Further research by Virkler and Lednev has led to the development of methodology to discriminate blood samples of different species [22] with the application of Raman spectroscopy. A recent publication in the Journal of Analytical Chemistry reports on this method of identification of species based on the Raman spectroscopic analysis of blood [22]. We have recently reported on potential application of Raman spectroscopy for determining the burial time based on bone remains [23]. Here we report on a preliminary investigation of species differentiation based on Raman spectroscopy of bones. Our hypothesis is based on the literature which demonstrates that vibrational spectroscopic analysis of bone components and mineralized tissue can discriminate species of origin [24-28]. Species discrimination using Raman spectroscopy of animal tusk has been previously investigated by several researchers. Animal tusk, or dentine, is a mineralized tissue very similar to bone. Dentine tends to be more mineralized and have less collagen than bone tissue. Shimoyama et al. (1997) reports that hard and soft mammoth dentine were discriminated using near infrared (NIR) FT-Raman spectroscopy [24]. Brody et al. (2001) report the discrimination of dentine from six mammalian species, with slight overlap, also using FT-Raman spectroscopy [26] and chemometeric processing. Edwards et al. report using a similar approach to discriminate between Asian and African elephant dentine in a forensic setting [28]. Discrimination in these studies is likely due to organic to inorganic ratio differences between species.
Considering the reported success of the studies of biological material conducted for the purposes of species discrimination, we intend to use similar methods for this study. The main purpose of this research is to prove the principle that bone can be spectroscopically discriminated according to species of origin. This has clear forensic applications, but could also be useful in the study of ancient cultures. For this preliminary investigation, various non-human species were used for practicality; a human bone was not requisite at this stage. If the developed methods prove successful, continued research will focus on the discrimination of human bone specimen from other animal bones.
2. Experimental Procedure
2.1. Samples
Chicken, turkey, cow and pig bone samples were collected from a grocery meat market. Each bone was cleaned of muscle, fat and soft tissue before Raman spectroscopic measurements.
2.2. Raman Microscope
A Renishaw in Via Raman microscope with attached Leica microscope with 20X objective was used. The wavelength of the laser used was 785 nm with approximately 11.5 mW power. Data was collected using Wire 2.0 software and analyzed using Grams v7.01. A small area of cortical bone was cut and placed on the lower plate of a Nanonics AFM MultiView 1000 automatic mapping stage. The automatic mapping stage was used to sample an arbitrary square area of cortical bone measuring approximately 75 μm × 75 μm. Within this square area, 36 points (6 × 6 square distribution) were sampled. Scans were set to 35 seconds with five accumulations and with a full range of 3200 - 100 cm–1.
2.3. Data Treatment
GRAMS v7.01 was used to remove cosmic rays and for baseline subtraction. The data was truncated between the range 3190 - 360 cm–1. The spectral data was then imported as a single matrix into MATLAB version 7.9.0. MATLAB PLS_Toolbox 5.5 by Eigenvector Research Inc. was used for pretreatment and partial least squares discriminant analysis (PLS-DA). The data was normalized about the most intense peak (~960 cm–1) and mean centered. The number of components was estimated using the root mean square error of the leave-one-out crossvalidation (RMSECV). Component analysis was performed using PLS-DA and a model was built based on the component loadings. MATLAB software was also used for spectral averaging.
3. Results and Discussion
3.1. Main Approach
Previous Raman studies of bone tissue have been limited because of strong fluorescence interference [29]. Golcuk et al. (2006) used photobleaching, a potentially destructtive process, prior to acquiring bone Raman spectra at 532-nm excitation [30]. In this study, to reduce the fluorescence interference we utilized a 785-nm near infrared light for excitation. Two, 60 second accumulations provides high quality Raman spectra with the signal-to-noise ratio of 50:1 or better.
Bone tissue is expected to be heterogeneous, meaning that no individual Raman spectrum measured at a single spot could fully represent a specific tissue. For this reason, we utilized a previously developed a mapping method for acquiring Raman spectra from multiple spots for further statistical analysis. In this study, 36 individual spectra were obtained for each species surveyed using the automatic mapping technique. PLS-DA was used because of the high discriminatory potential of this technique [31,32].
3.2. Spectral Analysis
The spectra were averaged for visual comparison and are shown in Figure 1. The averaged spectra between turkey, chicken, and pig bone samples are visually very similar. The peak count and position are identical between these species. There are, however, relative peak intensity variations that could be indicative of the variation in the bone tissue composition for various species. For example, the relative intensities of 1075 cm–1 and 1042 cm–1 Raman peaks vary (shaded portion of Figure 1). The Amide I peak at 1660 cm–1, which is attributed to the contribution from the collagen organic component [33], varies in intensity between samples. The intensity a small peak at 1003 cm–1 also changes in intensity between these spectra. This peak is assigned to the phenylalanine amino acid breathing mode.
The averaged spectrum from cow is most distinct from the other three as it appears to be missing several peaks, including three peaks in the 800 - 900 cm–1 range, attributed to δ CCH at 855 cm–1 (collagen), v C-C 875 cm–1 (proline) and v C-C 920 cm–1 (collagen) vibrational modes [34]. The peak pattern in the CH2 region at 2900 cm–1 for cow is comparably less intense than other species sampled. This is also seen in the Amide I, Amide III and δ NH bands. Excluding this irregularity, the Raman spectra between species are very similar.
3.3. Determining the Number of Components
Leave-one-out cross-validation was performed and the root mean square error of cross-validation (RMSECV) versus the component plot is shown in Figure 2. In this plot, a local minimum or a distinct change in slope will occur at the number of components which describe the system. There are such local minimums around n = 2 - 3. Between the four classes, either two or three components should adequately describe the system. It was seen that the first two components, which contributed over 85% of
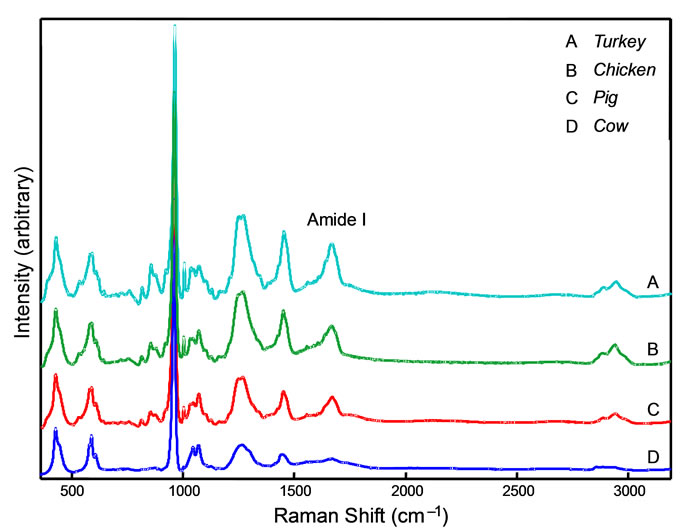
Figure 1. A stack plot showing the combined accumulations of Raman spectra for cow, pig, turkey and chicken. The shaded region is highlights peaks at 1075 and 1042 cm–1 which is discussed in Section 3.2. Raman spectra are baseline corrected to aid comparison.
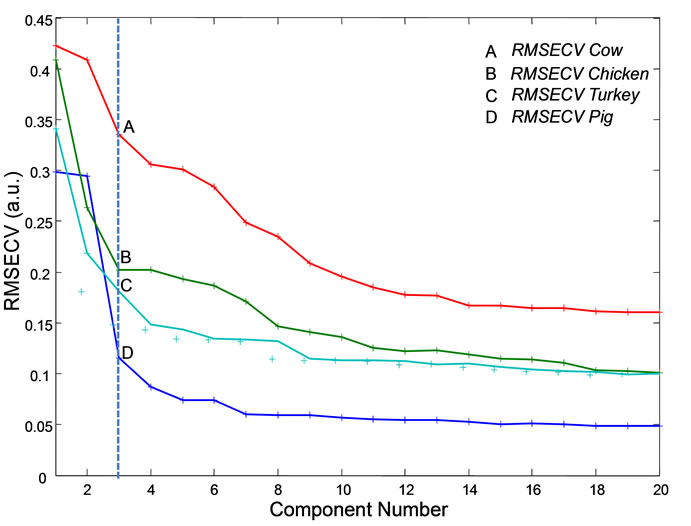
Figure 2. A root mean square error of cross-validation (RMSECV) plot versus the number of components. The break at n = 3 indicates that there are three components.
spectral data, were best at discriminating classes and other components did not vary much between classes. For the purposes of this study, a model built using the first two components is therefore sufficient.
3.4. Component Analysis
PCA is a multivariate data analysis method. This analysis describes a large data set with a small number of extracted components. These components have high variation which serves to highlight patterns in the dataset. This allows relationships in data to be efficiently described and represented by a few components. PLS-DA is an extension of PCA which accounts for class definitions and maximizes the separation of classes. In this case, the classes are the species identity i.e. cow, chicken, pig and turkey.
Component analysis is almost completely automated using MATLAB software and the Eigenvector PLS toolbox. First, the accumulated spectral data is combined into a single matrix. Normalization and mean centering preprocessing is performed on the data matrix to prepare the data for component analysis. When the PLS-DA algorithm is applied to this matrix, a number of components are extracted. The first component accounts for the majority of data variation within the matrix and is usually the most significant for discriminatory purposes. The following components progressively account for less data variance. The shape of a component is called its loading. Next, each individual spectrum is superimposed against the loading of a component to obtain a score. The more a given spectrum has features common to a component, the higher the score. A scores plot is usually displayed in two or three dimensions to graphically display the scores on multiple components. For example, a scores plot in two dimensions usually displays the scores on component one on the x-axis and the scores on component two on the yaxis. The actual numerical score of a given point is arbitrary because the zero, zero (0,0) point in a two dimensional scores plot is positioned at the total average score.
PLS-DA is very useful for discriminating samples that have similar chemical constituents. In the case of bone tissue, chemical constituents are essentially identical between species. All bone tissue is expected to be comprised of mostly bioapatite and type I collagen. However, the percent composition is expected to vary between species. Since the main components of bone, bioapatite and collagen, are detectable with Raman spectroscopy, PLS-DA analysis is appropriate for discriminatory purposes.
The components derived from this type of data analysis can often be chemically informative [35]. It is seen in this study that the components loadings reflect the spectral signatures of collagen and bioapatite. Raman signals from these materials have been previously separated and identified in a modern mouse bone. Freeman et al. (2002) reports the Raman spectrum from both organic and inorganic constituents [29]. A general rule is that the mineral phase of bone has a majority of Raman bands below 1000 cm–1 with a distinct sharp peak centered at 960 cm–1. Conversely, the organic phase contributes a majority of peaks towards higher wavenumbers than 1000 cm–1 and are generally broad. Component assignments were made by comparing loading patterns with previously published Raman spectrum of isolated bone constituents.
The loadings for components one and two are shown in Figure 3. For component one, there are major positive features in the 3000 - 2800 cm–1 range as well as a triplet which has peaks centered at around 1260 cm–1, 1450 cm–1 and 1670 cm–1. This positive triplet corresponds to the Amide III, δ NH and Amide I Raman bands respectively. Hence, this component is dominated by organic contributions.
Conversely, component two is dominated by inorganic features. The dominant peak centered at 960 cm–1 is the v1  vibrational mode. The two peaks at lower wavenumbers from this, centered around 430 cm–1 and 590 cm–1 correspond to v2
  and v4
  vibrational modes. The peak at 1070 cm-1 corresponds to the carbonate ion (v3
 ) vibrational mode. The broad hump centered around 1260 cm–1 corresponds to the Amide III vibrational mode.
These component loading features are in agreement with isolated spectra of collagen and bioapatite published by Freeman et al. (2002) Although there is slight mutual contribution, in general component one represents a collagen contribution, while component two is representative of bioapatite.
The first two components were used to create a scores plot to determine if spectra will group with respect to species of origin. A two dimensional component scores plot is shown in Figure 4. A 95% confidence interval
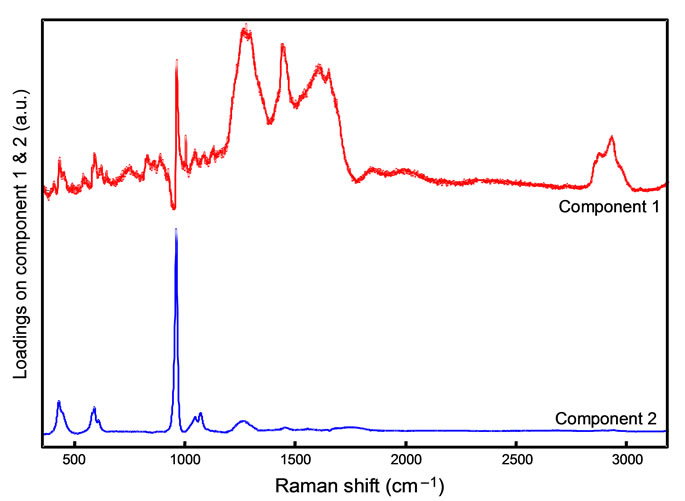
Figure 3. The component loading for spectral component one (top/red) and two (bottom/blue).
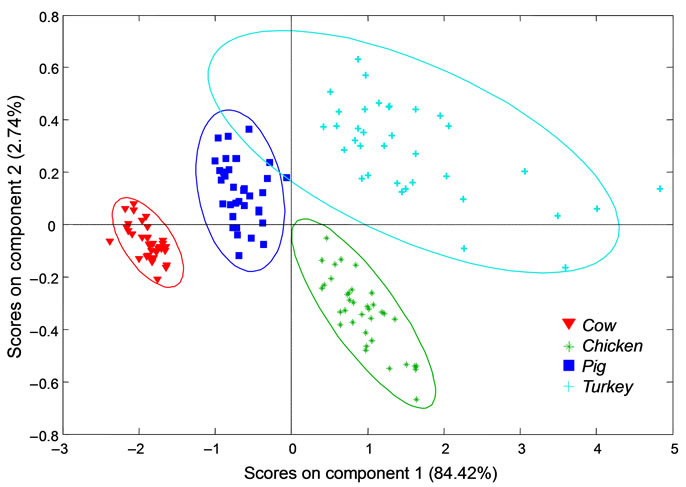
Figure 4. A two dimensional scores plot for cow, chicken, turkey and pig based on the first two spectral components. A 95% confidence ellipsoid encompasses each species class.
ellipsoid is drawn around each class. It is apparent that the classes are completely separated with respect to species of origin and there is only slight group overlap of the ellipsoid representing a 95% confidence interval.
4. Conclusion
The goal of this research project was to investigate the potential of Raman spectroscopy to discriminate between bone samples based on species of origin. Previous research demonstrates that the chemical composition of bone is measurably different in various mammalian species [15]. This approach is appropriate since components of bone are easily detected using Raman spectroscopy. PLS-DA was chosen for this purpose because of its powerful discrimination ability. Using this method, spectra from four species were successfully discriminated with no overlap. The model built for discrimination reflects the chemical composition of bone material. The separation of groups is likely due to the differences in bone composition that have been previously reported in different species. These positive results demonstrate that the species of origin determination of bone in a practical setting may be possible. This would be a substantial contribution to forensic anthropology, a field that is currently lacking in spectroscopic analysis.
Further research is necessary for a more complete representation of each species. Variables such as specimen age, bone type, and gender are known to affect bone composition and need to be controlled. In addition, degenerative factors that change the composition of bone after death need to be analyzed for this approach to have practical applications. To prove forensic applicability, a human bone also needs to be sampled.
REFERENCES
- M. Houck and J. Siegel, “Fundamentals of Forensic Science,” Academic Press, San Diego, 2006.
- A. Chamberlain, “Human Remains,” University of California Press, Los Angeles, 1994.
- C. Cattaneo, D. Porta, D. Gibelli and C. Gamba, “Histological Determination of the Human Origin of Bone Fragments,” Journal of Forensic Sciences, Vol. 54, No. 3, 2009, pp. 531-533. doi:10.1111/j.1556-4029.2009.01000.x
- K. Virkler and I. K. Lednev, “Analysis of Body Fluids for Forensic Purposes: From Laboratory Testing to Non-destructive Rapid Confirmatory Identification at a Crime Scene,” Forensic Science International, Vol. 188, No. 1-3, 2009, pp. 1-17. doi:10.1016/j.forsciint.2009.02.006
- C. M. Hodges and J. Akhavan, “The Use of FourierTransform Raman-Spectroscopy in the Forensic Identification of Illicit Drugs and Explosives,” Spectrochimica Acta Part A—Molecular and Biomolecular Spectroscopy, Vol. 46, 1990, pp. 303-307.
- E. M. A. Ali, H. G. M. Edwards and I. J. Scowen, “In-situ Detection of Single Particles of Explosive on Clothing with Confocal Raman Microscopy,” Talanta, Vol. 78, 2009, pp. 1201-1203. doi:10.1016/j.talanta.2008.12.038
- G. Jochem and R. J. Lehnert, “On the Potential of Raman Microscopy for the Forensic Analysis of Coloured Textile Fibres,” Science & Justice, Vol. 42, No. 2, 2002, pp. 215-221. doi:10.1016/S1355-0306(02)71831-5
- J. Zieba-Palus and R. Borusiewicz, “Examination of Multilayer Paint Coats by the use of Infrared, Raman and XRF Spectroscopy for Forensic Purposes,” Journal of Molecular Structure, Vol. 792-793, 2006, pp. 286-292. doi:10.1016/j.molstruc.2006.03.072
- S. E. J. Bell, L. A. Fido, S. J. Speers and J. Armstrong, “Raman Spectroscopy for Rapid, One-step Forensic Analysis of Paint,” Forensic Science International, Vol. 136, 2003, pp. 354-355.
- S. E. J. Bell, L. A. Fido, S. J. Speers, W. J. Armstrong and S. Spratt, “Forensic Analysis of Architectural Finishes using Fourier Transform Infrared and Raman Spectroscopy, Part II: White Paint,” Applied Spectroscopy, Vol. 59, No. 11, 2005, pp. 1340-1346. doi: 10.1366/0003702052940404
- J. Mania, B. Trzcinska, M. Kunicki and P. Kooecielniak, “Comparison of the CE method with FTIR and Raman Spectrometry in the Field of Forensic Ink Analysis,” Forensic Science International, Vol. 136, 2003, pp. 75-75.
- B. Eckenrode and E. Bartick, “Portable Raman Spectroscopy Systems for Field Analysis,” Forensic Science Communications, Vol. 3, 2001.
- M. D. Hargreaves, K. Page, T. Munshi, R. Tomsett, G. Lynch and H. G. M. Edwards, “Analysis of Seized Drugs using Portable Raman Spectroscopy in an Airport Environment—A Proof of Principle Study,” Journal of Raman Spectroscopy, Vol. 39, No. 7, 2008, pp. 873-880. doi:10.1002/jrs.1926
- M. Perez-Alonso, K. Castro, I. Martinez-Arkarazo, M. Angulo, M. A. Olazabal and J. M. Madariaga, “Analysis of Bulk and Inorganic Degradation Products of Stones, Mortars and Wall Paintings by Portable Raman Microprobe Spectroscopy,” Analytical and Bioanalytical Chemistry, Vol. 379, No. 1, 2004, pp. 42-50. doi:10.1007/s00216-004-2496-2
- J. Aerssens, S. Boonen, G. Lowet and J. Dequeker, “Interspecies Differences in Bone Composition, Density, and Quality: Potential Implications for In Vivo Bone Research,” Endocrinology, Vol. 139, No. 2, 1998, pp. 663- 670. doi: 10.1210/en.139.2.663
- K. Virkler and I. K. Lednev, “Raman Spectroscopy Offers Great Potential for the Nondestructive Confirmatory Identification of Body Fluids,” Forensic Science International, Vol. 181, No. 1-3, 2008, pp. e1-e5. doi:10.1016/j.forsciint.2008.08.004.
- K. Virkler and I. K. Lednev, “Raman Spectroscopic Signature of Semen and its Potential Application to Forensic Body Fluid Identification,” Forensic Science International, Vol. 193, No. 1-3, 2009, pp. 56-62. doi:10.1016/j.forsciint.2009.09.005
- K. Virkler and I. K. Lednev, “Raman Spectroscopic Signature of Blood and its Potential Application to Forensic Body Fluid Identification,” Analytical and Bioanalytical Chemistry, Vol. 396, No. 1, 2010, pp. 525-534. doi: 10.1007/s00216-009-3207-9
- K. Virkler and I. K. Lednev, “Forensic Body Fluid Identification: The Raman Spectroscopic Signature of Saliva,” Analyst, Vol. 135, 2010, pp. 512-517. doi:10.1039/b919393f
- V. Sikirzhytski, K. Virkler and I. K. Lednev, “Discriminant Analysis of Raman Spectra for Body Fluid Identification for Forensic Purposes,” Sensors, Vol. 10, No. 4, 2010, pp. 2869-2884. doi:10.3390/s100402869
- A. Sikirzhytskaya, V. Sikirzhytski and I. K. Lednev, “Raman Spectroscopic Signature of Vaginal Fluid and its Potential Application in Forensic Body Fluid Identification,” Forensic Science International, 2011, Article in Press. doi:10.1016/j.forsciint.2011.08.015
- K. Virkler and I. Lednev, “Blood Species Identification for Forensic Purposes Using Raman Spectroscopy Combined with Advanced Statistical Analysis,” Analytical Chemistry, Vol. 81, No. 18, 2009, pp. 7773-7777. doi:10.1021/ac901350a
- G. McLaughlin and I. K. Lednev, “Potential Application of Raman Spectroscopy for Determining Burial Duration of Skeletal Remains” Analytical and Bioanalytical Chemistry, Vol. 401, No. 8, 2011, pp. 2511-2518. doi:10.1007/s00216-011-5338-z
- M. Shimoyama, H. Maeda, H. Sato, T. Ninomiya and Y. Ozaki, “Nondestructive Discrimination of Biological Materials by Near-infrared Fourier Transform Raman Spectroscopy and Chemometrics: Discrimination Among Hard and Soft Ivories of African Elephants and Mammoth Tusks and Prediction of Specific Gravity of the Ivories,” Applied Spectroscopy, Vol. 51, No. 8, 1997, pp. 1154- 1158. doi:10.1366/0003702971941674
- M. Shimoyama, S. Morimoto, and Y. Ozaki, “Non-destructive Analysis of the Two Subspecies of African Elephants, Mammoth, Hippopotamus, and Sperm Whale Ivories by Visible and Short-wave Near Infrared Spectroscopy and Chemometrics,” Analyst, Vol. 129, 2004, pp. 559-563. doi:10.1039/b401003e
- R. H. Brody, H. G. M. Edwards, and A. M. Pollard, “Chemometric Methods Applied to the Differentiation of Fourier-Transform Raman Spectra of Ivories,” Analytica Chimica Acta, Vol. 427, 2001, pp. 223-232. doi:10.1016/S0003-2670(00)01206-X
- D. M. Hashim, Y. B. C. Man, R. Norakasha, M. Shuhaimi, Y. Salmah, and Z. A. Syahariza, “Potential Use of Fourier Transform Infrared Spectroscopy for Differentiation of Bovine and Porcine Gelatins,” Food Chemistry, Vol. 118, No. 3, 2009, pp. 856-860. doi:10.1016/j.foodchem.2009.05.049
- H. G. M. Edwards, N. F. N. Hassan and N. Arya, “Evaluation of Raman Spectroscopy and Application of Chemometric Methods for the Differentiation of Contemporary Ivory Specimens I: Elephant and Mammalian Species,” Journal of Raman Spectroscopy, Vol. 37, No. 1-3, 2006, pp. 353-360. doi:10.1002/jrs.1458
- J. J. Freeman and M. J. Silva, “Separation of the Raman Spectral Signatures of Bioapatite and Collagen in Compact Mouse Bone Bleached with Hydrogen Peroxide,” Applied Spectroscopy, Vol. 56, No. 6, 2002, pp. 770-775. doi:10.1366/000370202760077513
- K. Golcuk, G. S. Mandair, A. F. Callender, N. Sahar, D. H. Kohn and M. D. Morris, “Is Photobleaching Necessary for Raman Imaging of Bone Tissue using a Green Laser?” Biochimica Et Biophysica Acta-Biomembranes, Vol. 1758, No. 7, 2006, pp. 868-873. doi:10.1016/j.bbamem.2006.02.022
- S. Lars and W. Svante, “Partial Least Squares Analysis with Cross-Validation for the Two-Class Problem: A Monte Carlo Study,” Journal of Chemometrics, Vol. 1, 1987, pp. 185-196.
- M. Barker and W. Rayens, “Partial Least Squares for Discrimination,” Journal of Chemometrics, Vol. 17, No. 3, 2003, pp. 166-173. doi:10.1002/cem.785
- R. Smith and I. Rehman, “Fourier-Transform RamanSpectroscopic Studies of Human Bone,” Journal of Materials Science-Materials in Medicine, Vol. 5, 9-10, No. 1994, pp. 775-778. doi:10.1007/BF00120375
- A. Awonusi, M. D. Morris and M. M. Tecklenburg, “Carbonate Assignment and Calibration in the Raman Spectrum of Apatite,” Calcified Tissue International, Vol. 81, No. 1, 2007, pp. 46-52. doi:10.1007/s00223-007-9034-0
- H. Nocairi, E. M. Qannari, E. Vigneau and D. Bertrand, “Discrimination on Latent Components with Respect to Patterns. Application to Multicollinear Data,” Computational Statistics & Data Analysis, Vol. 48, No. 1, 2005, pp. 139-147. doi:10.1016/j.csda.2002.09.008
NOTES
*Corresponding author.