Journal of Geoscience and Environment Protection
Vol.06 No.09(2018), Article ID:87273,16 pages
10.4236/gep.2018.69011
Comparison of SRTM and ASTER Derived Digital Elevation Models of Inaouene River Watershed (North, Morocco)―Arc Hydro Modeling
Meriam Lahsaini1*, Hassan Tabyaoui1, Ahlam Mounadel1, Nouzha Bouderka2, Ferdaous Lakhili2
1Polydisciplinary Faculty of Taza, Natural Resources and Environment Laboratory, Sidi Mohamed Ben Abdellah University, Fez, Morocco
2Faculty of Sciences and Technology, Georesources and Environment Laboratory, Sidi Mohamed Ben Abdellah University, Fez, Morocco

Copyright © 2018 by authors and Scientific Research Publishing Inc.
This work is licensed under the Creative Commons Attribution International License (CC BY 4.0).
http://creativecommons.org/licenses/by/4.0/


Received: August 9, 2018; Accepted: September 10, 2018; Published: September 13, 2018
ABSTRACT
The purpose of this research is to define initial parameters of Inaouene river and its catchment areas using radar data and satellite data. The Inaouene river is situated at the east of Sebou basin in North-East of Morocco. The study has been done by two dataset: 1) Shuttle Radar Topography Mission (SRTM) at a horizontal spatial resolution of 90 meters, and 2) ASTER (Advanced Spaceborn Thermal Emissionand and Reflection Radiometer) of GDEM version 2 at a horizontal spatial resolution of 30 meters, using ArcHydro model. Several raster and vector products of the Inaouene river and its catchment area have been defined at the end of the model. Moreover, final results of the ArcHydro model were compared with each other and with the reality. The result of this study can be used in baseline and advanced hydrology and geomorphology research on the catchment area. Besides of that, the result can define a spatial boundary of study on Inaouene River and its catchment area. Moreover, it would have support for decision-making on ground and surface water resource, distribution and management.
Keywords:
SRTM, ASTER-GDEM V2, ArcHydro, Inaouene River, Morocco

1. Introduction
A hydrological model is a simplification of a complex system [1] . At each stage of modeling, approximations are made: perception of the phenomenon, formalization into a conceptual framework, translation into a programming language [2] . Hydrological modeling is an essential tool to understand the dynamics of a watershed, in the rational use of the water resources of this basin and in the combat against flood-related natural disasters [3] . GIS fusion and hydrology results from the synthesis of time series, geospatial data (GIS data), modeling and hydrological analysis [4] .
In this paper, we have based on various scientific studies using the topographic map at 1/50,000 to extract the morphometric indices (catchement area, drainage network, perimeter, shape, relief, and slope) of Inaouene River watershed using GIS tools. These morphometric indices are indispensable for characterizing the physical environment and their influences on the surface flow. The delineation of drainage networks and catchments from topographic maps have been widely replaced by the automatic extraction from Digital Elevation Model (DEM) [3] [5] [6] and [7] .
In recent times, DEM that was extracted from satellite image is widely applied to morphometric analysis of river basins. In Morocco, various studies where DEMs have been used to get various information such as terrain slope, gradient, aspect, contour line, estimation of soil loss, water resource evaluation and topographic characterization include [8] [9] [10] and [11] . Due to free access, SRTM and ASTER based DEM with 90 m and 30 m spatial resolution respectively are commonly used. Accurate delineation of watershed plays an extremely important role in the management of the watershed [12] .
Many studies have been conducted to estimate and compare the accuracy of ASTER GDEM and C-band SRTM elevation models. Horizontal and vertical accuracies of ASTER GDEM are estimated to be 30 m and 20 m RMSE respectively at the preproduction level at the 95% confidence level [13] . In a following study, Rexer and Hirt (2014) [14] compared the latest release of ASTER GDEM v2, SRTM3 USGS v2.1 with SRTM C-band CGIAR-CSI v4.1 and evaluated their accuracy against the ground truth dataset for Australia. They reported elevation accuracies to be RMSE 8.5 m, 6 m, and 4.5 m for ASTER GDEM v2, SRTM3 USGS v2.1, and SRTM CGIAR-CSI v4.1, respectively. Using validation points from Global Navigation Satellite Systems (GNSS), Athmania and Achour (2014) [15] assessed the vertical accuracy of the ASTER GDEM v2, CGIAR-CSI SRTM v4.1, and GMTED2010 at two test sites in Tunisia and Algeria. The RMSE of CGIARCSI SRTM v4.1 model (3.6 m) indicated a higher vertical accuracy than ASTER GDEM v2 (5.3 m) and GMTED2010 (4.5 m) for both sites. By using a reference DEM from a topographic map (1:5000 scale) to analyse the accuracy of ASTER DEM over Istanbul, Sertel (2010) [16] concluded that ASTER GDEM showed the main topographic features of the studied area. However, the absolute error in elevation was estimated to be 20 m in most of the studied region, and higher than 20 m in some parts.
In the Geographic Information System, many hydrological models are usually incorporated into distributed hydrological simulations [17] [18] [19] and [20] . Many GIS tools have been developed. The ArcHydro model in ArcGIS, developed by Esri [21] is used to calculate watersheds, drainage points, watersheds in raster and vector formats, and define and analyze the hydrogeometric network, manage historical data and export data to numerical models [22] .
A basic parameters of river and its catchment area have to be define by a modern method, and the different results of this research will be used in future studies to model the Inaouene river watershed, and will support for decision-making.
2. Study Area
The Inaouene watershed is situated between latitudes 33˚30'N and 35˚N, and longitudes 3˚30'W and 5˚W. It is located in the East of Sebou watershed (Figure 1) and is bounded on the East by the Moulouya watershed, on the Northwest by the Ouargha and Leben basins and on the south by the upper Sebou basin [23] . This situation gives it a position in a semi-arid zone; therefore like all basins of

Figure 1. (a) Position of Inaouene river basin in Morocco; (b) Elevation map of Inaouene river basin based on SRTM-DEM with the main cities (red dots) and the course of the river (blue line).
this type, it is subject to problems of water scarcity due to annual and interannual climate variability.
The Inaouene watershed covers an area of 3320 km2, and a perimeter of 359 Km, this surface is composed of several sub-secondary basins, where the runoff waters collect. The value of Gravelius compactness coefficient KG of Inaouene river watershed is about 1.3, greater than 1, and then reveals this basin is characterized by an elongated shape. The Inaouene River is a main tributary of the Sebou River, formed by the junction of the El Arbaa River coming from the North and Bou Lajraf River coming from the South. It receives as main tributaries, goes downstream: Taza River, on the left bank, and Lakhdar River on the right. Regarding the hydrographic slope, the Inaouene watershed is characterized by a steep slope that can be favoring the reduction of the concentration time.
The altitude of the Inaouene river watershed is between 1970 m at the top and 54 m at the outlet (Figure 2). The region is part of a semi-arid Mediterranean climate characterized by a wet winter and a hot, dry summer [24] . According to the stations measurement, the annual total is between 400 mm (Ain Boukellal) and 1200 mm (Bab Bou Idir). A very significant downward trend began in 1980, announcing an exceptional drought that has extended to the present day [24] [25] . Water offal is usually brutal and most rainfall is concentrated within a few weeks of the wet seasons [26] and [27] .
The physiographic characteristics of a watershed have a strong influence on its hydrological response, and in particular, the flow regime during flood and low water periods. The characteristics of the Inaouene watershed can easily be estimated from the topographic maps of Taza and Tahla of 1/50,000 by using digital GIS techniques.
Geomorphologically, the Inaouene watershed has a topography with significant elevation. It is bordered by two mountainous: the Rif, in the north, whose southern front extends a region of marly and clay hills. To the south, the Middle Atlas is presented in stepped plateaux, dominated by folded chains [28] . The watershed of Inaouene is characterized by a marly substratum more or less armed with limestone and sandstone benches, covering 60% of the total surface of the basin. These lithological formations are subjected to strong erosion, contrary to the carbonate formations in Tahla and Tazekka plateau [29] .
3. Materials and Methods
3.1. Datasets
The methodology followed in this study is based on the combination of radar and satellite images. In this study, ArcHydro Add-on/Extension, ArcHydro Groundwater, ArcScene and ArcGIS 10.2 software were used for the analysis [30] .
The Terrain Elevation Model (DEM), used by NASA, is the SRTM (Shuttle Radar Topography mission). The SRTM (Figure 3) covered approximately 80% of the earth’s surface with an overall resolution of 90 meters, while the GDEM
 (a)
(a)
 (b)
(b)
 (c)
(c)
 (d)
(d)
Figure 2. Some intermediate results of physiographic study. (a): Elevation map; (b): Geologic map; (c): Slop map; (d): Aspect map.
(Global Digital Elevation Model) can cover the planet from 83˚ North to 83˚ South, exceeding the SRTM that only covered 56˚S and 60˚N. For this reason, we have also opted using ASTER (Advanced Spaceborn Thermal Emission and Reflection Radiometer) satellite images of the GDEM version 2, available in October 2011, by NASA and METI-Japan (Figure 4). They have a much higher resolution (30 m) to repair errors observed in the field.
One versions of SRTM-DEM datasets, ID 36-06 was downloaded freely in Geotiff format from Consultative Group for International Agriculture Research Consortium for Spatial Information (CGIARCSI) (http://srtm.csi.cgiar.org). Columns and rows of the one raster data are 6001:6001, respectively.
Totally, 4 ASTER-DEM datasets, ID N33-34 W003-005 was downloaded from the Earth Remote Sensing Data Analysis Center (ERSDAC)
(http://www.jspacesystems.or.jp/library/archives/ersdac/eng/index.E.html). ASTER GDEM v2 is provided with a Geotiff file that records numbers (stack
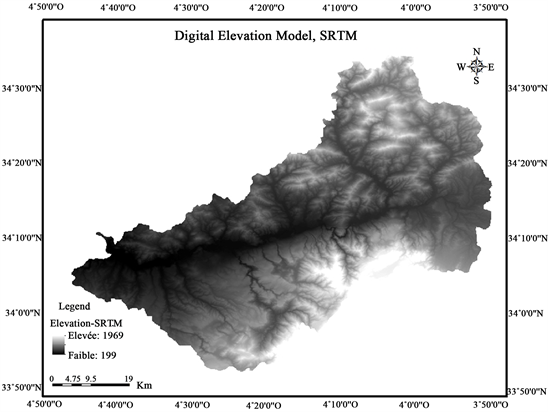
Figure 3. Digital elevation model, SRTM. Data source: [31] .

Figure 4. Digital elevation model, ASTER. Data source: [32] .
numbers) representing the number of individual scene DEMs that were stacked to create the final averaged DEM elevation value. Columns and rows of the one raster data are 3601:3601, respectively.
3.2. Methodologies
This research is ensured by the ArcHydro GIS model [30] using two DEM, the ASTER GDEM v2 in GeoTIFF format with 30-meter postings and SRTM at a horizontal resolution of 90 m. ArcHydro is a hydrologic information system that is a synthesis of geospatial and temporal data supporting hydrologic analysis and modeling [4] .
It is used to define the physiographic characteristics of Inaouene watershed according to flowchart of the model that is illustrated in Figure 5, based on “ArcHydro tools-Tutorial” handbook [21] .

Figure 5. Methodology of ArcHydro model [37] .
Several intermediate results such as flow direction, flow accumulation, stream definition, drainage line, catchment boundary, watershed point, drainage area centroid and longest flow path are produced while the models run.
To delineate the morphological characteristics of the Inaouene River watershed, we use the topographic map of Taza and Tahla of 1/50,000. We first identified the watershed boundaries by digitizing it on both topographic maps. We then compared and corrected it to delineate the watershed based on DEM. For this study, we used WGS-84 as Geographical coordinate system.
4. Results and Discussion
DEM based ArcHydro model was run on the both datasets SRTM-DEM and ASTER-DEM. The result is different depending on the types of data used. Several morphometric parameters of the Inaouene watershed have been defined at the end.
Some of the intermediate results are shown in Figure 6. The ArcHydro model provides some basic functionality often used in hydrological resource applications. The “Terrain pre-processing” and “watershed processing” functionalities make it possible to delineate a watershed, and to generate its hydrographic network, by using tools that are used to create a Raster showing the watersheds and the watercourse and watersheds flow.
The first step is to smooth the potential areas of water accumulation. The input parameter is the maximum area to smooth. This function must be applied to enable the following steps. The next step is to calculate the flow direction of each cell in the “filled” DEM (Figure 6). According to the altitudes of the 8 juxtaposed grid elements, the deterministic algorithm-8 [33] and [34] calculates the direction in which the fictitious drop starts. This direction is not expressed in degrees but varies between 1 and 255. The value 1 corresponds to the East. Elevated or stream-source cells have low values. On the other hand, the cells located at the mouths or confluences have high values since they receive all the water generated by the basins. Figure 6 illustrates this logic. The data obtained “flow accumulation” corresponds to a number of cells. The growing number follows the bed of a stream. From the flow accumulation grid, the “Stream Definition” function is used to select cells whose value is greater than a certain threshold. This function therefore requires as input the grid of the accumulation of flows and the minimum threshold. The grid obtained thus contains 2 values: 0 for the cells whose accumulation of flows is lower than the threshold, and otherwise 1 corresponds to a part of the hydrographic network.
The Flows assembly direction and the current definition makes it possible to differentiate the sections of the hydrographic network generated previously (Figure 6). All cells belonging to the same hydrographic section will have the same numerical value [35] .
Based on the result of the previous step, 57 watersheds were created from each hydrographic section previously calculated using the “Catchment Grid Delineation”
 Fil
Fil
 Fdr
Fdr
 Catchement
 Drainage Line
 Adjoint Catchment
 Drainage Point
 Watershed
 Longest Flow Path
Figure 6. Some intermediate results of ArcHydro model.
function. The basins previously calculated are in the form of grid and image. The “Catchment Polygon Processing” function makes it possible to vectorize them and transform them into polygons. The data obtained provide a base from which other related calculations can be made. The “Drainage Line Processing” tool is used to vectorize the stream segmentation grid, the map obtained allows us to better see the detail of the lines of drains in subwatersheds than the topographic map. From the drainage networks, the “Adjoint Catchment Processing” [36] function is used to aggregate adjoint catchment and create a map of independent watersheds. Location of the drainage point (exit point) for each watershed determined using the “Drainage Point Processing” function, using as input the flow accumulation grid and watersheds.
The next steps concern calculation of longest flow path and slope determination. The Longest Flow Path function relies on pre-processed data, and in particular the longest flow path adjoint to speed up the computation of the longest flow paths (Figure 6). This is necessary to speed up the generation of longer throughput paths. The new shapefile shows only the longest drains for a given basin. This function takes a lot of computing time.
Among the main geomorphological parameters of the Inaouene watershed is the drainage density. It is a reflection of the basin’s dynamics, the stability of the hydrographic network and the type of surface runoff.
As a result of all these steps, following an analysis to evaluate the drainage density of the Inaouene watershed, indeed the areas located in permeable rocks zones generally have low drainage densities, whereas the sectors of impervious rocks have higher densities.
Watershed processing functionality permits to delineate basins and subwatersheds. Each small catchment has Shape Length and Area attributes. These quantities are automatically computed and become part of a geodatabase. The Batch Point Generation function is used to interactively create the Batch Point feature class. The map (Figure 6) shows the outlet point on accumulation path. The exact position of these points was controlled by a topographic map. The Drainage Area Centroïd function generates the centroid of the drainage areas as the centers of gravity. It operates on a selected set of drainage areas in the surface drainage input class. Finally, the “Longest Flow Path” function identifies and calculates the length of the longest flow path in a drainage area.
The Network Tools are characterized by two functions, the “Hydro Network Generation” function that allows to convert the drainage characteristics into network characteristics, and to create an associated geometric network. And the “Node/Link Schema Generation” tool, this function is used to generate a node-link schema. The nodes are defined by the centers of the polygons representing the basins and by points that represent locations of interest in the model.
Final results of the model are mapped, and a result of SRTM-DEM data is shown in Figure 7; a result of ASTER-DEM data is shown in Figure 8.

Figure 7. ArcHydro model: A final result of SRTM-DEM.
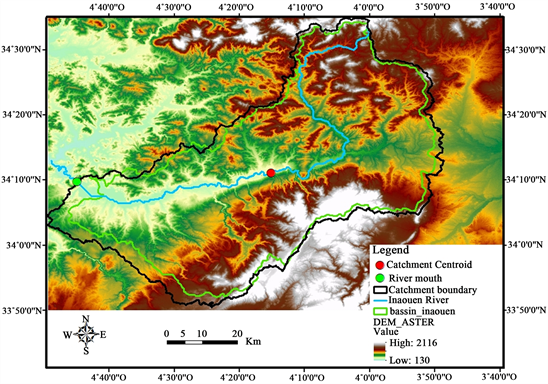
Figure 8. ArcHydro model: A final result of ASTER-DEM.
According to the final result of ArcHydro model, which SRTM-DEM was used, the geographic coordinate of the Inaouen River drainage mouth is 34˚9'40.1772''N, 4˚45'2.9227''W, length of the drainage is 161.91 km, perimeter of the catchment area is 451.16 km, area of the catchment is 3572.51 km2, location of the catchment centeris 34˚11'9.8853''N, 4˚14'58.7318''W.
According to the final result of ArcHydro model, which ASTER-DEM was applied (Table 1), the geographic coordinate of the Inaouen River drainage mouth is 34˚9'46.8000"N, 4˚45'0.0000"W, length of the drainage is 172.68 km, perimeter of the catchment area is 500 km, area of the catchment is 3550.014 km2, location of the catchment centeris 34˚11'20.4000''N, 4˚15'21.6000''W.
5. Conclusions
The methodology followed in this study has been carried out by two types DEM from remote sensing: 1) SRTM has a horizontal spatial resolution of 90 meters, 2) ASTER (Advanced Spaceborn Thermal Emission and Reflection Radiometer) GDEM version 2 at a horizontal spatial resolution of 30 meters. This model was applied to the Inaouene watershed using the ArcHydro model. It’s permitted to delineate and characterize the watershed in raster and vector formats, extract and modelling the stream networks.
During the ArcHydro model run, different morphometric parameters of the Inaouene watershed are defined (Table 1). If we compare between the results of the two datasets, a difference in the area of the watershed is noted, for the SRTM-DEM satellite image the area is 3572.51 by contrast ASTER-DEM satellite image, the area is 3550.014. The difference between the minimum and maximum value of the results of the catchment area is 22.49 km2, which equals to 0.01% of the maximum value. This difference is acceptable. For SRTM-DEM, the study area contains several lines of ridges that allow defining 51 catchments and 44 drainage points, by Contrast ASTER-DEM, we have 57 catchments and 44 drainage points. Furthermore, we were observed a difference of the river length is about 10.77 km, it needs to recheck. So, the river channel has been checked with the river line on the topographic map (Figure 9). From aforesaid three results, ArcHydro-SRTM result was approximately coincided with the map.

Table 1. Comparison of some results of Archydro model using tow the ASTER and SRTM datasets alongside with results from a topographic map.
1catchment was delineated by the traditional method using 1:50,000 scaled map. 2The catchment was defined by ArcHydro using SRTM 90 m data. 3The catchment was defined by ArcHydro using ASTER 30 m data.

Figure 9. Comparison between Topographic and satellite-based Inaouene River and its catchment area.
Finally, this work is considered as a first version of modeling results in the Inaouene river basin, using mainly geospatial data (altimetry, mapping). The adopted methodology is applied to all watersheds at the national level, using the results to conserve data on water resources. In addition, the results obtained can be used as a base for hydrological modeling and analysis. This “standardized” data model is important because it allows for “interoperability” between different water agencies, and it provides a framework around which future computational programs can be designed. As a result, many water agencies are now interested in converting their water resource data into a compatible ArcHydro form.
Conflicts of Interest
The authors declare no conflicts of interest regarding the publication of this paper.
Cite this paper
Lahsaini, M., Tabyaoui, H., Mounadel, A., Bouderka, N. and Lakhili, F. (2018) Comparison of SRTM and ASTER Derived Digital Elevation Models of Inaouene River Watershed (North, Morocco)―Arc Hydro Modeling. Journal of Geoscience and Environment Protection, 6, 141-156. https://doi.org/10.4236/gep.2018.69011
References
- 1. Payraudeau, S. (2002) Modélisation distribuée des flux d’azote sur des petits bassins versants méditerranéens. Sciences de la Terre, ENGREF (AgroParisTech), Français.
- 2. Ambroise, B. (1998) La dynamique du cycle de l’eau dans un bassin versant— Processus, Facteurs, Modèles. *H*G*A*, Bucarest, 200 p.
- 3. Medane, K. (2012) Hydrologie et modélisation Pluie-Débit: Cas du Bassin versant de l’Oeud Boumessaoud (TAFNA NW-ALGERIEN). Université Abou Bekr Belkaid Tlemcen, Chetouane.
- 4. Maidment, D. (2002) ArcHydro GIS for Water Resources. ESRI Press, Redlands, CA.
- 5. Ames, D., Rafn, E., Van Kirk, R. and Crosby, B. (2009) Estimation of Stream Channel Geometry in Idaho Using GIS-Derived Watershed Characteristics. Environmental Modelling & Software, 24, 444-448. https://doi.org/10.1016/j.envsoft.2008.08.008
- 6. Jenson, S.K. (1991) Applications of Hydrologic Information Automatically Extracted from Digital Elevation Models. Hydrological Processes, 5, 31-44. https://doi.org/10.1002/hyp.3360050104
- 7. Lacroix, M., Martz, L., Kite, G. and Garbrecht, J. (2002) Using Digital Terrain Analysis Modeling Techniques for the Parameterization of a Hydrologic Model. Environmental Modelling & Software, 17, 125-134. https://doi.org/10.1016/S1364-8152(01)00042-1
- 8. Lahsaini, M. and Tabyaoui, H. (2018) Modélisation hydraulique Mono dimensionnel par HEC-RAS, Application sur Oued Aggay (Ville de Sefrou).
- 9. Tahiri, M., Tabyaoui, H., El Hammichi, F., Tahiri, A. and El Haddi, H. (2014) Evaluation et Quantification de l’Erosion et la Sédimentation à Partir des Modèles RUSLE, MUSLE et Déposition Intégrés dans un SIG. Application au Sous-Bassin de l’Oued Sania (Bassin de Tahaddart, Rif nord occidental, Maroc). European Journal of Scientific Research, 125, 157-178.
- 10. Tahiri, M., Tabyaoui, H., Tahiri, A., El Haddi, H., El Hammichi, F. and Achab, M. (2016) Modelling Soil Erosion and Sedimentation in the Oued Haricha Sub-Basin (Tahaddart Watershed, Western Rif, Morocco): Risk Assessment. Journal of Geoscience and Environment Protection, 4, 107-119. https://doi.org/10.4236/gep.2016.41013
- 11. Deffontaines, B., Tabyaoui, H., El Hammichi, F., Chaouni, A., Mounadel, A., Lahsaini, M., Magalhaes, S. and Fortunato, G. (2015) Importance of Geological Map Updates in Engineering Geology, Application to the Rif-Chain and Its Foreland (Northern Morocco). Engineering Geology for Society and Territory, 6, 101-105.
- 12. Donia, N. (2009) Application of Remotely Sensed Imagery to Watershed Analysis; A Case Study of Lake Karoun Catchment, Egypt. Thirteenth International Water Technology Conference, IWTC, Hurghada, 12-15 March 2009, 1035-1049.
- 13. Arefi, H. and Reinartz, P. (2011) Accuracy Enhancement of ASTER Global Digital Elevation Models Using ICESat Data. Remote Sensing, 3, 1323-1343. https://doi.org/10.3390/rs3071323
- 14. Rexer, M. and Hirt, C. (2014) Comparison of Free High Resolution Digital Elevation Data Sets (ASTER GDEM2, SRTM v2.1/v4.1) and Validation against Accurate Heights from the Australian National Gravity Database. Australian Journal of Earth Sciences, 61, 213-226. https://doi.org/10.1080/08120099.2014.884983
- 15. Athmania, D. and Achour, H. (2014) External Validation of the ASTER GDEM2, GMTED2010 and CGIAR-CSI-SRTM v4.1 Free Access Digital Elevation Models (DEMs) in Tunisia and Algeria. Remote Sensing, 6, 4600-4620. https://doi.org/10.3390/rs6054600
- 16. Sertel, E. (2010) Accuracy Assessment of ASTER Global DEM over Turkey. Proceedings of a Special Joint Symposium of ISPRS Technical Commission IV & AutoCarto, Orlando, 15-19 November 2010, 5.
- 17. Wu, S., Li, J. and Huang, G. (2008) A Study on DEM-Derived Primary Topographic Attributes for Hydrologic Applications: Sensitivity to Elevation Data Resolution. Applied Geography, 28, 210-223. https://doi.org/10.1016/j.apgeog.2008.02.006
- 18. Fairfield, J. and Leymarie, P. (1991) Drainage Networks from Grid Digital Elevation Models. Water Resources Research, 27, 709-717. https://doi.org/10.1029/90WR02658
- 19. Konadu, D. and Fosu, C. (2009) Digital Elevation Models and GIS for Watershed Modelling and Flood Prediction—A Case Study of Accra Ghana. In: Yanful, E.K., Ed., Appropriate Technologies for Environmental Protection in the Developing World, Springer, Berlin, 325-332. https://doi.org/10.1007/978-1-4020-9139-1_31
- 20. Moharana, P. and Kar, A. (2002) Watershed Simulation in a Sandy Terrain of the Thar Desert Using GIS. Journal of Arid Environments, 51, 489-500. https://doi.org/10.1016/S0140-1963(01)90937-1
- 21. ESRI (2009) ArcHydro Tools and Tutorial. ESRI, New York.
- 22. Merkel, W., Kaushika, R. and Gorman, E. (2008) NRCS GeoHydro—A GIS Interface for Hydrologic Modeling. Computers & Geosciences, 34, 918-930. https://doi.org/10.1016/j.cageo.2007.05.020
- 23. Naoura, J. and Benaabidate, L. (2014) Etude du régime hydrologique du fleuve Inaouène, Maroc septentrional. European Scientific Journal, 10, 143-153.
- 24. Afkir, E. (1985) Le bassin versant de l’Inaouène: Caractéristique climatique et comportement hydrologique. Thèse 3éme Cycle, University of Toulouse, Toulouse, France.
- 25. Obda, K. (2004) Indigences extrêmes des écoulements des Oueds méditerranéens cas des oueds Nekor, et du haut Sebou. Thèse d’état, Université Sidi Mohamed Ben Abdellah, Fès, Maroc.
- 26. Sibari, H., Haida, S. and Fora, A. (2001) Etude du fonctionnement hydrologique d’un bassin versant méditerranéen (exemple du bassin versant de l’Inaouène: Maroc). Revue Marocaine de Génie Civil 95, Septembre-Octobre.
- 27. Sibari, H. (2002) Etude hydrologique et hydrochimiques des crues du bassin versant d’Inaouène (Maroc). Thèse de doctorat, Kenitra, Maroc.
- 28. Martin, J. (1981) Le moyen Atlas Central. Etude Géomorphologique. Notes et Mémoires du Service Géologique, 258, 445 p.
- 29. Sibari, H., Haida, S. and Ait Fora, A. (2001) Typologie des crues et érosion mécanique dans un bassin versant de zone semiaride: Bassin versant de l’Inaouène, Maroc. Revue Science et Changements Planétaires/Sécheresse, 12, 187-193.
- 30. ESRI (2008) ESRI ArcMap 9.3. Redlands, USA.
- 31. Jarvis, A., et al. (2008) Hole-Filled Seamless SRTM Data V4. International Centre for Tropical Agriculture (CIAT).
- 32. NASA (2001) Land Processes Distributed Active Archive Center (LPDAAC)-ASTER GDEM L1B, USGS/Earth Resources Observation and Sciences (EROS) Center.
- 33. Nascimento, N.O. (1995) Appréciation à l’aide d’un modèle empirique des effets d'action anthropiques sur la relation pluie-débit à l’échelle du bassin versant. Thèse de doctorat, CERGRENE/ENPC, Paris, 550 p.
- 34. Michel, C. (1989) Hydrologie appliquée aux petits bassins versants ruraux. Antony, Cemagref, 528 p.
- 35. Refsgaard, J.C. and Knudsen, J. (1996) Operational Validation and Intercomparison of Different Types of Hydrological Models. Water Resources Research, 32, 2189-2202. https://doi.org/10.1029/96WR00896
- 36. ESRI (2004) Arc Hydro Tools Overview. ESRI, USA.
- 37. Altansukh, O. (2012) Tuul River and Its Catchment Area Delineation from Satellite Image. Computational Water, Energy, and Environmental Engineering, 1, 9-23. https://doi.org/10.4236/cweee.2012.12002