Journal of Geoscience and Environment Protection
Vol.04 No.05(2016), Article ID:66556,11 pages
10.4236/gep.2016.45011
Use of GIS Based Maps for Preliminary Assessment of Subsoil of Guwahati City
Binu Sharma, Shaffi Kamal Rahman
Department of Civil Engineering, Assam Engineering College, Guwahati, India

Copyright © 2016 by authors and Scientific Research Publishing Inc.
This work is licensed under the Creative Commons Attribution International License (CC BY).
http://creativecommons.org/licenses/by/4.0/


Received 16 March 2016; accepted 16 May 2016; published 19 May 2016
ABSTRACT
Guwahati, the major city in the North Eastern region of India is growing rapidly in every aspect with major infrastructures like sports complex, educational institutions, hospitals, flyovers, multiplex halls, etc. Knowledge of the subsurface soil condition is necessary to ensure the structural safety and serviceability of the above mentioned structures before any construction. Therefore, contour maps of Standard penetration test N value, ground water table and shear wave velocity map using Geographical Information System (GIS) platform will be of great help to the foundation designers at the initial stage for site selection and preliminary foundation design under static and seismic condition. Contour maps of Standard penetration test N value at different depth and average contour map of N value of Guwahati city have been prepared. Standard penetration Test N values and depth of water table were taken from a data base of 200 boreholes up to 30 meter depth to prepare N value contour map of Guwahati city. A regression equation between shear wave velocity Vs and Standard penetration test N value based on twenty seven previous similar correlations was also developed. This regression equation was used to determine shear wave velocity of Guwahati city. The average shear wave velocities for 30 m depth for all locations had been determined and used to generate map on (GIS) platform. Other subsurface geotechnical information of Guwahati city like soil classification and depth to water level from ground surface is also presented in the form of GIS based maps in order to form a data base.
Keywords:
Standard Penetration Test, Shear Wave Velocity, Contour Map, GIS Based Maps, Subsurface Investigation

1. Introduction
Geotechnical subsurface information is a fundamental step towards the proper design, construction and performance of all types of geotechnical projects, ranging from foundation, earth dams, embankments, excavation, and seismic hazards. Therefore, geotechnical subsurface information like N value of the soil, soil classification and water table is prepared in the form of GIS based map and contour maps. Again for the analysis of geotechnical earthquake engineering problems like site specific amplification factor and ground response study, standard penetration test (SPT) N value and shear wave velocity are important input parameters. Borehole logging is generally considered the standard method for obtaining shear wave velocity (Vs) data, but drilling and logging to the depths generally required for earthquake ground motion investigations is very expensive, and it is problematic in heavily built up areas. In view of this, several researchers have developed correlations between the SPT N value and shear wave velocity Vs, which are useful for determining the dynamic soil properties. In this paper, a regression equation between Vs and SPT N value based on previous similar correlations had been developed. This regression equation was used to determine shear wave velocity of Guwahati city. The shear wave velocities so determined were then compared with the shear wave velocities as determined according to the method suggested by Rao (2012) [1] . The average shear wave velocities for 30 m depth for all locations had been determined and used to generate map on Geographical Information System (GIS) platform. Using GIS, geospatial contour maps of shear wave velocity profile for Guwahati city, contour maps of standard penetration test N value and contour map of ground water table were also prepared in this study.
A soil database from 200 boreholes of Guwahati city was used for geotechnical subsurface investigation for this purpose. The soil database was from a project funded by the Department of Science and Technology, India for microzonation of Guwahati City.
2. Brief Review of Literature
Phukan et al. (2004) [2] studied the Guwahati city areas for multi criteria evaluation in GIS environment for ground water resource mapping in Guwahati city areas. Matsuoka et al. (2005) [3] studied the soil of Japan and prepared average shear-wave velocity mapping using Japan engineering geomorphologic classification map. Maheshwari et al. (2010) [4] studied the soil of Chennai and developed an empirical correlation between shear wave velocity and standard penetration test N value for the soil of Chennai city. Ribeiro et al. (2007) [5] studied the soil of Brazilian port site for geotechnical mapping and reports about N value contour mapping at Brazilian port. Humyra et al. (2012) [6] studied the soil of Rajshahi for the preparation of SPT N value contour map of Rajshahi city area. In the study they used 21 soil reports of Rajshahi city prepared by civil engineering department of Rajshahi University of engineering and Technology. Ayothiraman et al. (2012) [7] also developed average N value (15m) contour map of Guwahati city. Rao (2012) [1] studied and estimated shear wave velocity from soil indices. In the study, in situ Vs measured by cross-hole technique at six sites have been compared with those evaluated using an existing empirical relation between N value, soil indices and shear wave velocities. A new, modified empirical relation for predicting Vs from N values and other soil indices has been proposed. Other research workers in this direction are Imai and Yoshimura (1970) [8] , Sykora and Stokoe (1983) [9] , Jafari et al. (2002) [10] and Ismet, K. A. et al. (2006) [11] .
3. The Study Area
The Guwahati city area lying between latitude 26.1833˚N and longitude 91.733˚E measures about 229.94 sq. km, encompassing southern part of Kamrup (Urban) district of Assam. The mighty river Brahmaputra flows to the north of Guwahati city, the south and the eastern sides are surrounded by two rows of semi-circular hillocks. The city is extended more in an E-W trend occupying the position between the Brahmaputra River towards north and Precambrian hills of Shillong Plateau towards south.
Geomorphologic and Geologic Setting
It has a population of over 814,575 (Census 2001) occupying mostly the narrow tracts of alluvium and sediment filled low lands interspersed with Precambrian residual hills. Intensified anthropogenic activities particularly in and around the hills has led to high rate of aggradations in the low lying areas clogging the city drainage system. Alluvial soil is found in the valleys and low lying areas of the city. They are typically brown and grey coloured silty clays or clayey silts. At present most of the ancient alluvial soils are overlain by artificially transported soil and overburden material brought about by anthropogenic activities. They are visible only in excavations and borings. The hills surrounding Guwahati city are primarily composed of Porphyritic Granites and Quartzo Feldspathic Gneiss which are cross-cut by amphibolite intrusives and quartz veins. Sandy soils which are produced by weathering of porphyritic granites are found in many areas of the city. The sandy soils are rich in unsorted coarse fragments of quartz together with associated clay and minor amounts of mica flakes. These soils are pale brown in colour and have a low degree of cohesion. Localities underlain by Quartzo-feldspathic Gneisses are covered by red coloured soils rich in clay minerals.
In order to study the engineering soil properties of Guwahati City soil, bore holes of 30m depth were made in 200 locations covering an area of 262 sqkm. The bore hole location map along with the river Brahmaputra in Guwahati city is shown in Figure 1.
From the bore holes it is seen soils in Guwahati city mostly consists of alternating layers of both fined grained and coarse grained soils. There is a great deal of variation in the thickness of these layers. The fine grained fraction mostly consists of soils of classification CL, CI and CH according to the Indian standard soil classification. In a few locations inorganic silt of classification ML and CL-ML and non plastic inorganic silts were also encountered. The coarse grained fraction is mostly of classification SP, SW, SC, SM, SP-SC. Gravel deposits were also encountered in certain bore holes. The soil classification map at a depth of 6m is shown in Figure 2. The soil classification map can be used for seismic site effect evaluation.
4. N-Value Contour Maps
Standard penetration test was done at every 1.5 m interval up to 30 m depth to determine the N value of the soil in the 200 bore holes. At some locations, SPT has been done to depths less than 30 m due to refusal been encountered. Uncorrected N value of the soils varied from 4 to > 50 (refusal). The data available from SPT were corrected for overburden pressure and dilatancy for the development of SPT N value contour maps. The N value contour maps for 3 m, 6 m and 10.5 m from the ground surface are shown in Figures 3-5 respectively.
The average standard penetration resistance at all the bore holes can be computed by the following expression as suggested by International Building Code [IBC, 2003] [12] .
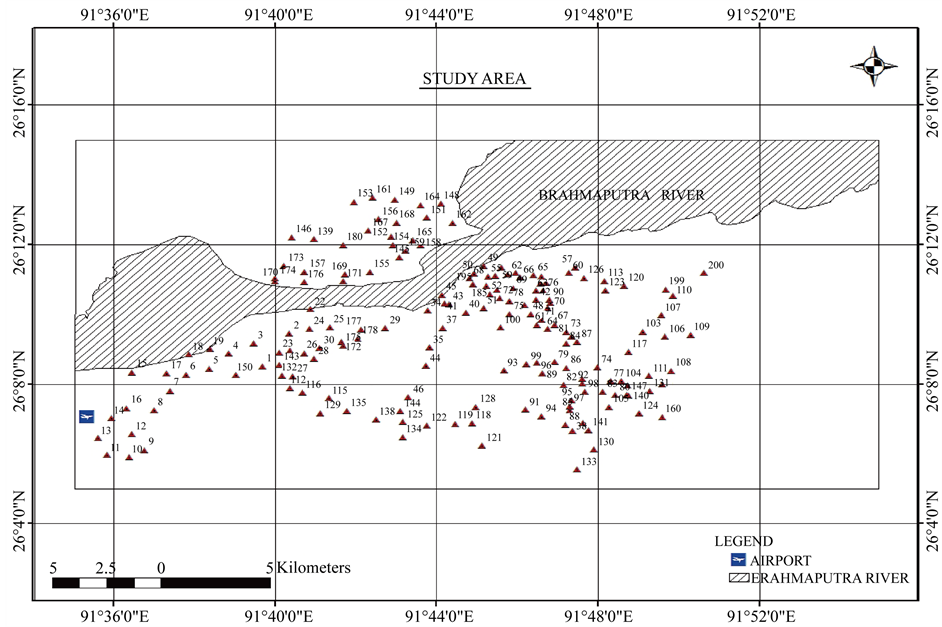
Figure 1. Locations of bore holes in Guwahati city.
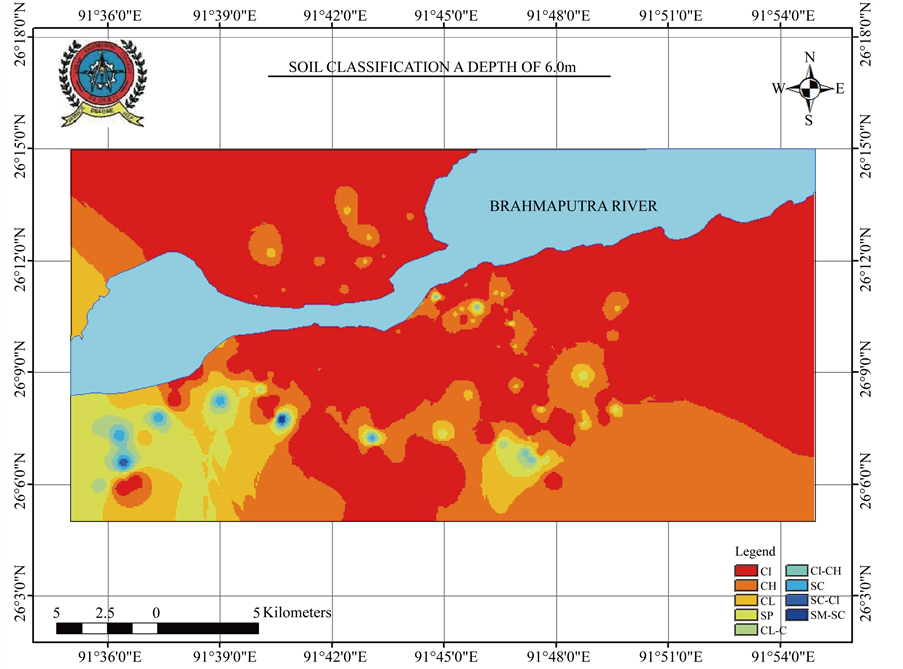
Figure 2. Soil classification map at a depth of 6m in Guwahati city.
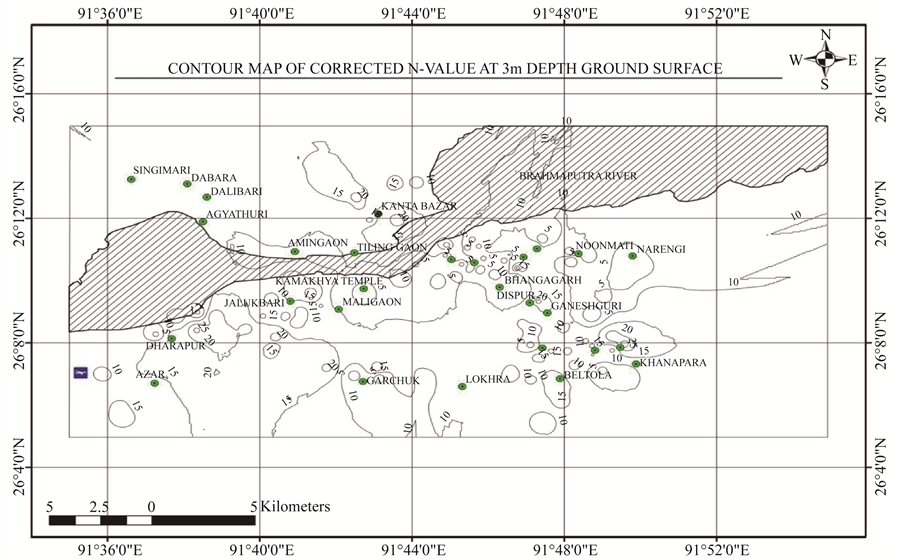
Figure 3. Contour map of corrected N value at 3 m depth.
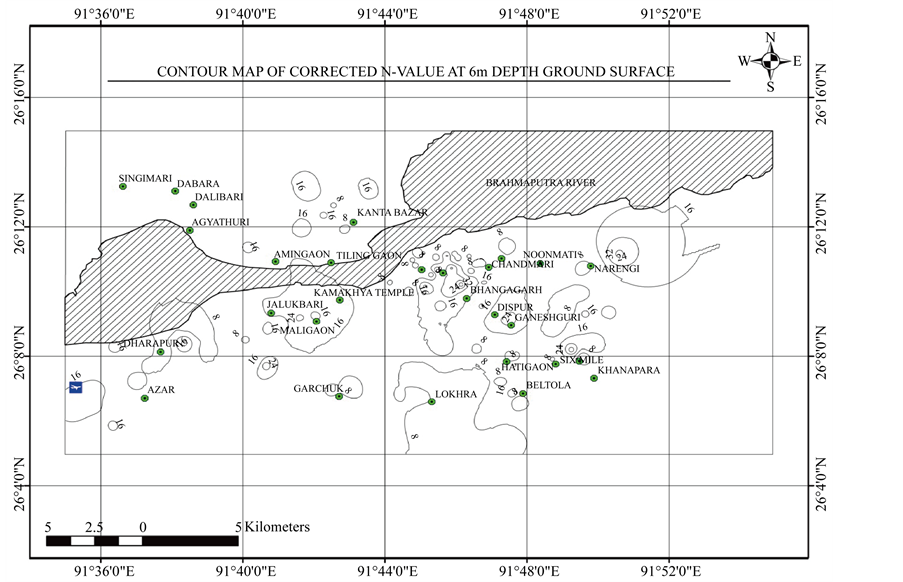
Figure 4. Contour map of corrected N value at 6 m depth.
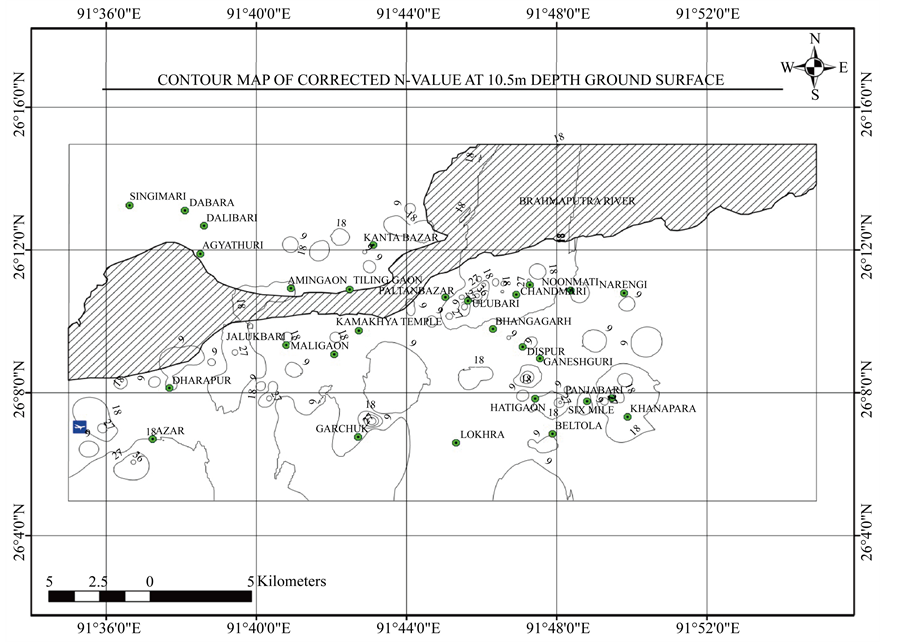
Figure 5. Contour map of corrected N-value at 10.5 m depth.
 (1)
(1)
where di = thickness of each layer.
Ni = SPT N value at ith layer.
n = total no layers.
The spatial distribution of average N value up to 30 m depth is shown in Figure 6.
Many building codes use Nave for classifying a site for purposes of incorporating local site conditions in estimation of design ground motion. In IBC (2000) [13] the site classification based on average N value is given and is presented in Table 1. As per IBC (2000), E-type sites with low Nave are susceptible to liquefaction.
According to the above classification out of 200 bore holes of Guwahati city 89 boreholes are classified as E type and rest of 111 boreholes belong to class D.
5. Map of Water Table
The contour map of depth to ground water level in Guwahati city is shown in Figure 7. The map in Figure 7 in-
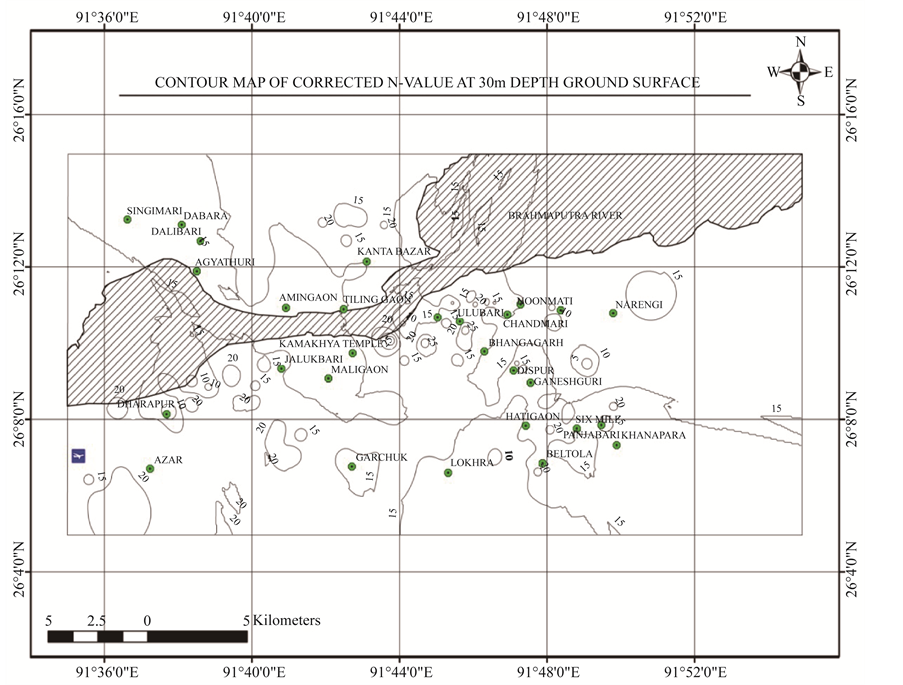
Figure 6. Spatial distribution of average N value up to 30 m.

Table 1. Soil site classification based on Navg.
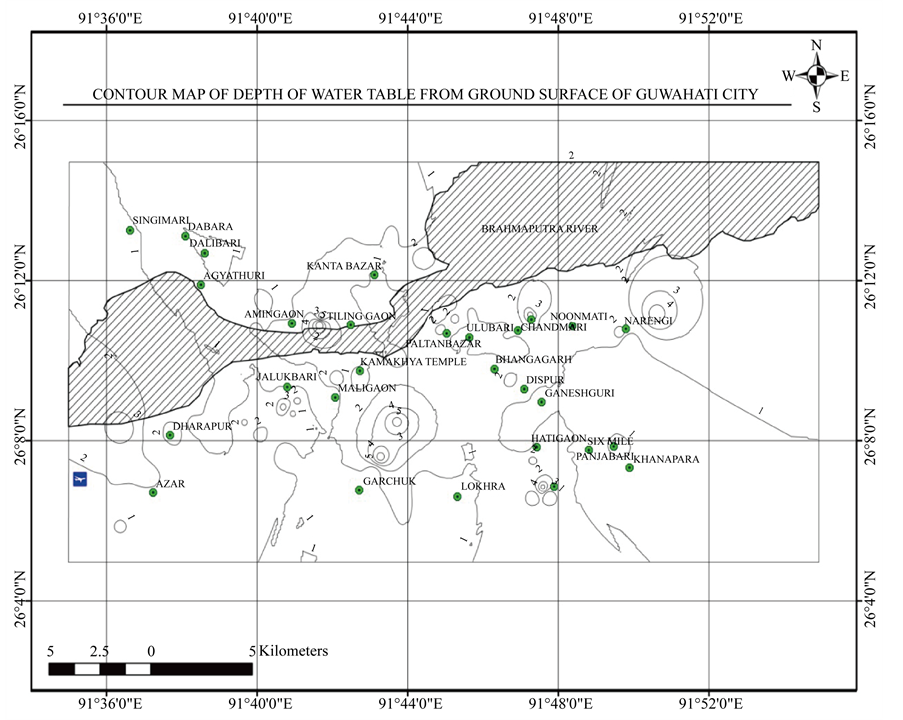
Figure 7. Contour map of depth to ground water table in Guwahati city.
dicates that in most of the locations in Guwahati city the water table is at a shallow depth. Depth to the water table in the 200 bore logs was found to be within 0m to 6m meter of the ground surface.
6. Shear Wave Velocity Based on N Value
Shear wave velocity can be measured either by invasive or non-invasive methods. Invasive methods mainly include down hole, up hole and cross hole method. Non-invasive method includes seismic refraction, Multichannel Analysis of Surface Waves (MASW) and Spectral Analysis of Surface Waves (SASW). However, both these methods are very expensive and require expert supervision. Many empirical relations now exists connecting Vs and soil indices. Most of these equations are based on the relation between Vs and N value. Table 2 shows 27 such empirical correlations as reported in Marto, A. et al. (2013) [14] . These empirical relations are used mainly for convenience, efficiency and cost saving.
By using the above 26 correlations, simple linear power regression analysis was done by averaging shear wave velocities at different N values. The resulting equation from above analysis is given as
 (2)
(2)
for which R2 = 0.9996
Rao (2012) [1] has given a relation between shear wave velocity and N value in the form.
 (3)
(3)
where, H = thickness of soil strata.
The coefficient for soil type according to Rao is given in Table 3.
Table 2. Correlations of SPT N-value and shear wave velocity.
Table 3. Coefficient of soil type.
In this study, shear wave velocity is determined from Equation (2) and Equation (3) from the uncorrected N values obtained from the 200 bore holes. Shear wave velocity is also computed from the uncorrected N values using Equation (3) because this equation incorporates thickness of the soil strata and also type of soil. Most of the researchers utilized uncorrected SPT N value in establishing relationship with shear wave velocity values. Maheswari et al. (2010) [4] reported that the corrected and uncorrected N values predicted Vs with equal accuracy. Mhaske and Choudhury (2011) [15] also concluded that correlation of uncorrected SPT N value and shear wave velocity Vs can give reasonably good estimate of value of shear wave velocity for typical soil of Mumbai city. In view of this, shear wave velocity is determined from the uncorrected N values.
The shear wave velocity averaged over the top 30 m of soil is referred to as VS30 and is computed by dividing 30 m with the shear wave velocity from the surface to 30 m as given in following equation.
 (4)
(4)
where ∑di = cumulative depth in m.
Vi = Shear wave velocity at ith layer.
Modern seismic codes like NEHRP [16] , IBC2000 [13] and Eurocode 8 [17] use VS30 for doing the site characterization. GIS based map of VS30 by Equation (2) is shown in Figure 8 and map by Equation (3) of Rao (2012) [1] is shown Figure 9.
According to NEHRP (National Earthquake Hazard Reduction Programme) [16] site classes of soil profile based on VS30 are shown in Table 4.
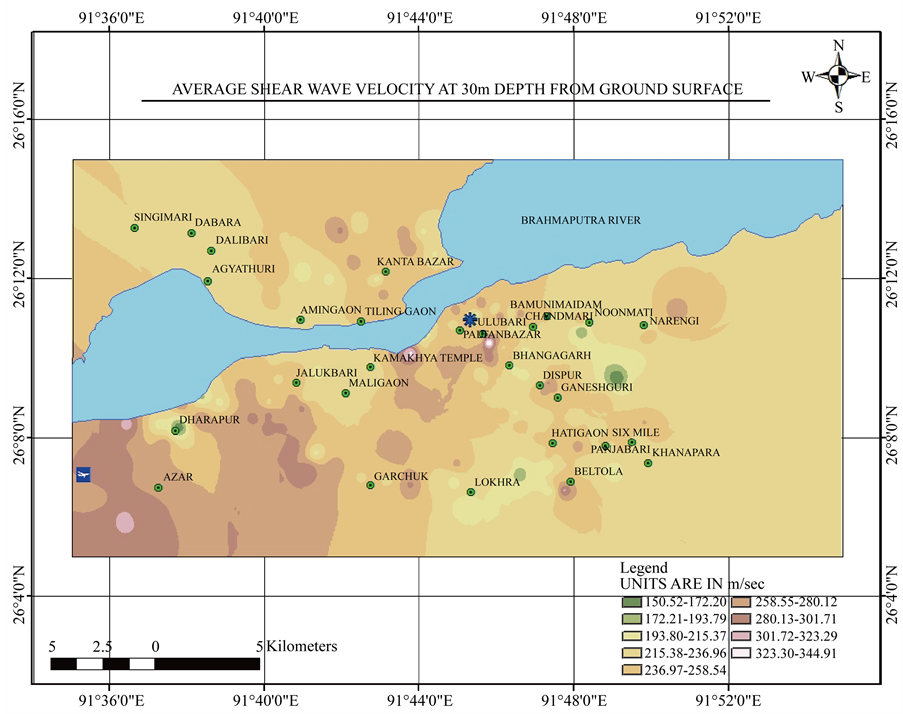
Figure 8. Mapping of average shear wave velocity (VS30) of Guwahati city (map developed by Equation (2)).
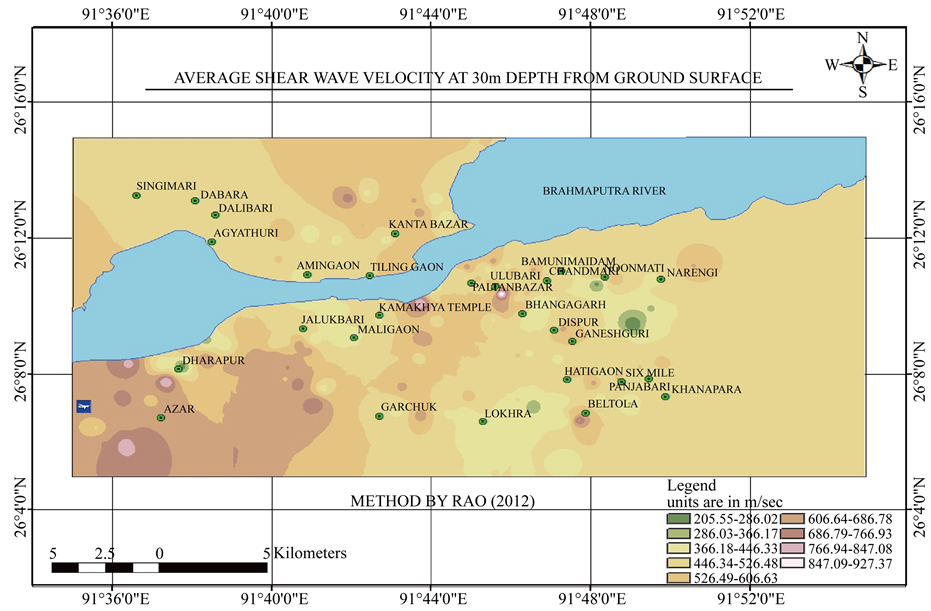
Figure 9. Mapping of average shear wave velocity (VS30) for Guwahati city (map developed by Equation (3)).
Table 4. Site classification of soil based on VS30.
It is seen that the Shear wave velocities according to Rao (2012 [1] is found to be higher than that obtained by Equation (2) with the percentage variation between the two methods varying from 38% to 61%. This high percentage variation is because Equation (2) is a correlation between Vs and N value obtained from various correlations throughout the world which are site specific whereas Equation (3) incorporates the thickness of the soil strata and soil indices which are not incorporated in Equation (2).
When average shear wave velocities of Guwahati city are calculated by Equation (2), then out of 200 boreholes in Guwahati city 6 sites belongs to class E and 194 borehole sites comes under class D. According to Rao (2012) [1] , out of 200 boreholes 11 site belongs to class D, 183 sites belongs to class C and 6 site comes under class B. On going through the bore logs of the 200 bore holes it is seen that Guwahati soil consists of alternating layers of both fined grained and coarsed grained soils with N-value ranging from 4 to >50 (refusal). Ninety seven number of bore holes showed existence of very dense sand strata from depth ranging from 12 m to 22.5 m up to 30 m showing N-value as refusal. Again seven number of bore holes have gravel deposits from depth ranging from 17 m to 22 m up to 30 m. Bed rock was not encountered in any of the 200 borings in Guwahati city. This gives the impression that Equation (3) according to Rao (2012) [1] is overestimating the shear wave velocity and Equation (2) is underestimating the shear wave velocity of Guwahati city.
7. Conclusion
This paper presents subsurface geotechnical information of Guwahati city in the form of GIS based maps and contour maps in order to provide the database for preliminary assessment of subsoil of Guwahati city. For this purpose, GIS based map of average shear wave velocity VS30 and contour maps of N- value, average N-value, depths to ground water table were generated to characterize subsurface conditions in Guwahati city. Though these, GIS based maps have many inherent shortcomings yet these maps will be of use to the foundation designers at the initial stage for site selection and preliminary foundation design under static and seismic condition. Further, it can be used for low cost housing construction where generally subsurface investigations are not done. Shear wave velocities determined according to Rao (2012) [1] are found to be higher than that obtained by using the regression equation developed in this paper with the percentage variation between the two methods varying from 38% to 61%. This indicates that further study is needed in this direction.
Cite this paper
Binu Sharma,Shaffi Kamal Rahman, (2016) Use of GIS Based Maps for Preliminary Assessment of Subsoil of Guwahati City. Journal of Geoscience and Environment Protection,04,106-116. doi: 10.4236/gep.2016.45011
References
- 1. Rao, S.Ch. (2012) Estimation of Shear Wave Velocity from Soil Indices. Indian Geotechnical Journal, 42, 267-273.
- 2. Phukon, P., Phukan, S., Das, P. and Sarma, B. (2004) Multicriteria Evaluation in GIS Environment for Groundwater Resource Mapping in Guwahati City Areas, Assam. Map India Conference, Delhi, 28-30 January 2004.
- 3. Matsuoka, M., Wakamatsu, K., Fujimoto, K. and Midorikawa, S. (2005) Average Shear-Wave Velocity Mapping Using Japan Engineering Geomorphologic Classification Map. Structural Engineering/Earthquake Engineering, JSCE, 23, 57s-68s.
- 4. Maheswari, U.R., Boominathan, A. and Dodagoudar, G.R. (2010) Use of Surface Waves in Statistical Correlations of Shear Wave Velocity and Penetration Resistance of Chennai Soils. Geotechnical and Geology Engineering, 28, 119-137.
http://dx.doi.org/10.1007/s10706-009-9285-9 - 5. Riberio, E.P., Dyminski, A.S. and Kormann, M. (2007) Evaluation of Local and Global Interpolation Using Neural Networks for Geotechnical Mapping of Brazilian Port Site. CMNE/CILAMCE 2007, Porto, 13-15 Junho 2007, 1-9.
- 6. Humyra, T., Awall, Md.R., Mofiz, S.A. and Sobhan, Md.A. (2012) Preparation of SPT Contour Map of Rajshahi City Area and Its Application to Foundation Design. International Journal of Civil & Environmental Engineering, 12, 11-17.
- 7. Ayothiraman, R., Raghukanth, S.T.G. and Sreelatha, S. (2012) Evaluation of Liquefaction Potential of Guwahati: Gateway City to Northeastern India. Natural Hazards, 63, 449-460.
http://dx.doi.org/10.1007/s11069-012-0158-9 - 8. Imai, T. and Yoshimura, Y. (1970) Elastic Wave Velocity and Soil Properties in Soft Soil (in Japanese). Tsuchi-ToKiso, 18, 17-22.
- 9. Sykora, D.E. and Stokoe, K.H. (1983) Correlations of In-Situ Measurements in Sands of Shear Wave Velocity. Soil Dynamics and Earthquake Engineering, 20, 125-136.
- 10. Jafari, M.K., Shafiee, A. and Razmkhah, A. (2002) Dynamic Properties of Fine Grained Soils in South of Tehran. Journal of Seismological Earthquake Engineering, 4, 25-35.
- 11. Ismet, K.A., Tildy, P., Pronay, Z., Pinar, A. and Hermann, L. (2006) VS30 Mapping and Soil Classification for Seismic Site Effect Evaluation in Dinar Region, SW Turkey. Geophysical Journal International, 165, 223-235.
- 12. IBC (2003) The International Building Code. International Code Council, Inc., USA.
- 13. IBC (2000) The International Building Code. International Code Council, Inc., USA.
- 14. Marto, A., Soon, T.C. and Kasim, F. (2013) A Correlation of Shear Wave Velocity and Standard Penetration Resistance. Electronic Journal of Geotechnical Engineering, 18, 463-471.
- 15. Mahaske, S.Y. and Choudhury, D. (2011) Geospatial Contour Mapping of Shear Wave Velocity for Mumbai City. Natural Hazards, 59, 317-327.
http://dx.doi.org/10.1007/s11069-011-9758-z - 16. National Earthquake Hazards Reduction Program (NEHRP) (2009) Recommended Provisions for Seismic Regulations for New Buildings and Other Structures. FEMA P-750, Building Seismic Safety Council, Federal Emergency Management Agency, Washington DC.
- 17. Eurocode 8 (1998) Geotechnical Design. JRC Scientific and Policy Reports, European Commission, Ispra.