Open Journal of Civil Engineering
Vol.05 No.01(2015), Article ID:54585,8 pages
10.4236/ojce.2015.51011
Influence Analysis of a New Building to the Bridge Pile Foundation Construction
Jing Ma
School of Civil Engineering & Architecture, Chongqing Jiaotong University, Chongqing, China
Email: 530425412@qq.com
Copyright © 2015 by author and Scientific Research Publishing Inc.
This work is licensed under the Creative Commons Attribution International License (CC BY).
http://creativecommons.org/licenses/by/4.0/


Received 16 February 2015; accepted 6 March 2015; published 12 March 2015
ABSTRACT
This paper is based on the analysis of an industrial factory building to the bridge pile foundation construction stability, and it researches the influence of a new building to the bridge pile foundation internal force by the finite element analysis software ANSYS. By calculating the changes of displacement and internal force of the bridge pile foundation, the deformation can be better controlled. Furthermore, comparing the data of numerical analysis with one of monitor measurements, we conclude that a new building has a small influence on the deformation under load action and the stress variation of a bridge pile foundation. That is to say, the bridge pile foundation is safe and stable under load action.
Keywords:
Bridge Pile Foundation, Numerical Simulation, Monitoring, Relative Analysis

1. Introduction
Since the capital construction increasingly develops and improves in China, more and more new buildings are built on their neighboring existing buildings [1] [2] , which have a certain influence on existing buildings. All these situations, including a foreign-style house on the shallow tunnel, a tunnel under high-rise construction, or a deep foundation ditch around the bridge [3] , require a strict computational analysis to provide reliable data for the influence extent of new buildings to existing ones and estimate the force change of building structure.
2. Engineering Situation
The new industrial factory is located on a high slope, part of the tectonic denudation hilly topography. According to the original relief map, the terrain is flat in the lows, with a gradient of 35. And the slope is a little steep, with a gradient of 15 or 20. Due to a consequent bedding rock landslide, a 25-meter-high and 30-meter-long fill slope is formed on the section of 10'-10' - 15'-15', whose interface obliquity is about 20 degree, consistent with the dip angle of rock stratum.
Currently, a support reinforcement has been applied to the slope by a pile sheet wall. The length of the slope retaining wall is 587.54 meters. Fifty piles are arranged in the middle of the slope, including the bridge pile foundation support and bolt structure beam protection. Specific plans are shown in Figure 1.
3. Analysis of the Finite Element Model
3.1. Computation Module
To reduce the boundary effect and guarantee the accuracy in computation, the model size is that: length along slope to the factory building (X-direction) is 120 m. Width along slope to Y-direction is 50 m. Height from the lower boundary to the surface (Y-direction) is 58 m.
The whole computation module is simulated with a total of 56,326 planar units and 10,659 nodes in the finite element grid. And the finite element grid is divided as Figure 2.
3.2. Design Conditions
The model is calculated and analyzed by using Drucker-Prager Yield Criterion in ANSYS [4] , and material parameters are determined based on data from geological survey report. The results are shown in Table 1.
The finite element simulation is computed under the load of self-weight stress and additional stress respectively. We divide the jump into two phases:

Figure 1. Master plan.
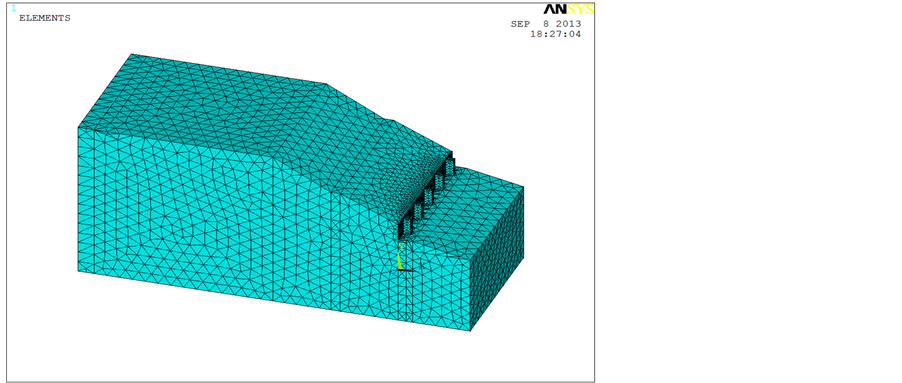
Figure 2. The finite element computation and analysis module.
Step 1: self-weight stress loading;
Step 2: factory loading.
Because the factory loading in process is subject to banded model, these loads are equivalently applied to the whole area of industrial buildings in the worst situation, and the force is 250 KN/M3. Results are shown in Figure 3.
3.3. Results
3.3.1. Simulation of the Results of Self-Weight Stress to the Bridge Pile Foundation
Maximum displacement and stress values in all directions of the bridge pile foundation under self-weight stress are shown in Table 2.
The nephogram of maximum displacement and stress values in all directions of the bridge pile foundation under self-weight stress are shown in Figures 4-9.
Under self-weight stress, the displacement and stress values of the bridge pile foundation are both small. The maximum values of displacement and stress of the bridge pile foundation are both in Y-direction, while the ones are small in Z-direction.
3.3.2. Simulation of the Results of Load Action to the Bridge Pile Foundation
Maximum displacement and stress values in all directions of the bridge pile foundation under load action are shown in Table 3.
The nephogram of maximum displacement and stress values in all directions of the bridge pile foundation under load action are shown in Figures 10-15.
Under load action, the values of displacement and stress in each direction increase, especially in Y-direction, which is consistent with reality. The results verify the correctness of the simulation.
Then, the stresses of bridge pile foundation are less than concrete compression strength in each direction, and

Figure 3. The loading model.

Table 1. Physical property parameter of material.

Figure 4. Displacement diagram under self-weight stress in X-direction.

Figure 5. Stress diagram under self-weight stress in X-direction.
Table 2. Bridge pile foundation displacement and stress values under self-weight stress.
the displacements under load action all meet the load bearing requirements, which makes it reasonable and feasible to an build an industrial factory near this bridge pile foundation.
4. Relative Analysis of the Numerical Computation and Monitor Measurement
Since the only data we can measure is the bridge pile foundation deformation, we set up three stations along the
Table 3. Bridge pile foundation displacement and stress values under load action.
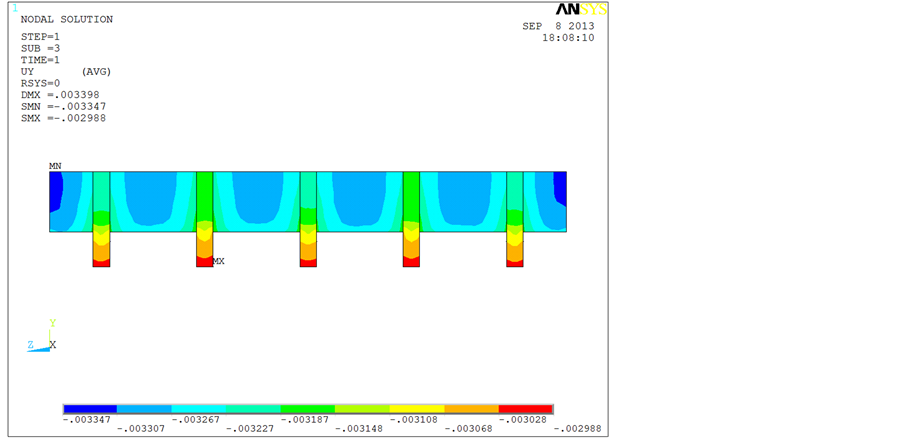
Figure 6. Displacement diagram under self-weight stress in Y-direction.

Figure 7. stress diagram under self-weight stress in Y-direction.
bridge pile foundation and conducted a long-term monitoring. We got primary data and current data of the bridge pile foundation, before and after setting up the industrial factory respectively. And the average value of three stations is chose as computed displacement value increment [5] . We compare the data of numerical simulation with that of monitor measurement to verify the reliability of the numerical simulation. Computed and measured values are shown in Table 4.

Figure 8. Displacement diagram under self-weight stress in Z-direction.

Figure 9. Stress diagram under self-weight stress in Z-direction.
Table 4. Bridge pile foundation displacement and stress values under load action.
The main displacement is that in X-direction (horizontal direction) under load action, and it differs by 0.003 m. The maximum stress change of the bridge pile foundation is 0.65 MPa in Y-direction (vertical direction), which differs by 0.002 m between computed and measured values. The value in Z-direction is perpendicular to the horizontal direction, which differs by 0.009 m between computed and measured values.

Figure 10. Displacement diagram under load action in X-direction.

Figure 11. Stress diagram under load action in X-direction.

Figure 12. Displacement diagram under load action in Y-direction.

Figure 13. Stress diagram under load action in Y-direction.

Figure 14. Displacement diagram under load action in Z-direction.

Figure 15. Stress diagram under load action in Z-direction.
5. Conclusions
Stress and displacement values of supporting structure are computed and analyzed by the finite element software ANSYS. The comparisons between computed and measured values are illustrated as below.
1) There is little difference between computed and measured values in all directions of the bridge pile foundation under load action, particularly in the main displacement (X-direction), which differs by 0.003 m. It shows that the load we applied about 250 c is rational and the computed values are reliable.
2) The maximum stress change of bridge pile foundation under load action is 0.46 MPa in Z-direction, less than concrete compression strength. Hence the bridge pile foundation meets the load bearing requirements.
3) The maximum tensile stress change of bridge pile foundation under load action is 0.65 MPa in Y-direction (vertical direction), less than tensile strength of concrete. Hence the bridge pile foundation meets the load bearing requirements.
Analysis above illustrates that the impact on the displacement and stress change of bridge pile foundation under load action is small. The bridge pile foundation structure under load action is safe and stable.
References
- Liu, J.H. (2002) Several Theories and Calculated Methods of Underground Engineer Construction Mechanics. Railway Standard Design.
- Hu, B. (2013) Application of Reinforced Concrete Filling Pile Technology in Deep Foundation Pit Supporting. Shandong Metallurgy, 35, 74-75.
- Wang, Y.G., Li, D.J. and Ye, K.P. (2005) Application of Steel-Tube Supporting Prestressed Technology in Deep Foundation Pit Project in Shanghai Xianlesi Square. Construction Technology, 35, 45-48.
- Mo, H.O., Crèpe, H.X. and Lai, A.P. (2001) Optimization Design in Foundation Pit Supporting Pile Structure. Rock Mechanics and Engineering, 23, 23-25.
- Paw-paw, H.Y. and Huang, J.Z. (2001) 3D Finite Element Analysis and Simulation of Deep Foundation Pit Supporting Structure. Shanghai Jiaotong University, 35, 610-613.