Advances in Materials Physics and Chemistry
Vol.3 No.1A(2013), Article ID:30385,11 pages DOI:10.4236/ampc.2013.31A011
Phase Transformation in the Ball Milled Fe31Co31Nb8B30 Powders
1Laboratoire de Magnétisme et Spectroscopie des Solides (LM2S), Département de Physique, Faculté des Sciences, Université Badji Mokhtar, Annaba, Algérie
2Department de Fisica, Universitat de Girona, Girona, Spain
Email: *safia_alleg@yahoo.fr, *alleg.safia@univ-annaba.org
Copyright © 2013 S. Azzaza et al. This is an open access article distributed under the Creative Commons Attribution License, which permits unrestricted use, distribution, and reproduction in any medium, provided the original work is properly cited.
Received January 21, 2013; revised March 9, 2013; accepted April 16, 2013
Keywords: Nanomaterials; Mechanical Alloying; X-Ray Diffraction; Fe-Co-Nb-B System; Amorphization Kinetics
ABSTRACT
The mechanical alloying process has been used to prepare nanostructured Fe31Co31Nb8B30 (wt%) alloy from pure elemental powders in a high energy planetary ball-mill Retsch PM400. Microstructural changes, phase transformation and kinetics were studied by X-ray diffraction, differential scanning calorimetry and Mössbauer spectrometry. The crystallite size reduction down the nanometer scale (~8 nm) is accompanied by the introduction of internal strains up to 1.8% (root-mean square strain, rms). Further milling time leads to the formation of partially paramagnetic amorphous structure in which bcc FeCo nanograins are embedded. The kinetics of amorphization during the milling process can be described by two regimes characterized by different values of the Avrami parameter n1 = 1.41 and n2 = 0.34. The excess enthalpy due to the high density of defects is released at temperatures below 300˚C. The glass transition temperature increases with increasing milling time.
1. Introduction
Mechanical alloying (MA) is a non-equilibrium process tool which allows the elaboration of stable and/or metastable materials such as supersaturated solid solution, amorphous alloys, nanocomposite and intermetallic compounds [1-3]. Amorphization by MA has been suggested to be similar to that of solid-state amorphization (SSA) in alternate layered structures [4]. In fact, during the milling process, a similar layered structure develops in which a SSA reaction could occur, although the layers are not perfectly planar and uniform. The progressive increase in density of lattice defects (vacancies, grain boundaries, etc.) might influence the thermodynamic and kinetics of the amorphization reaction. It is observed that a nanoscale layered structure containing nanoscale grain size and a high density of dislocations develops prior to the amorphization reaction [5]. This observation suggests that a numerous high speed diffusion paths such as subgrain boundaries and dislocation networks is necessary to permit a high diffusion rate at low temperature and, therefore, allows the amorphization reaction to take place. Moreover, the introduction of lattice defects raises the free energy of the crystalline system and thus, destabilizes it with respect to the amorphous state.
FeCo-based nanocrystalline (NC) alloys produced generally by devitrification of amorphous ribbons exhibit excellent soft magnetic properties. The presence of Nb in the parent amorphous alloy causes inhibition of grain growth resulting in a NC structure [6]. In these materials and contrary to conventional granular materials, the matrix is magnetic and its properties can be changed either by increasing the annealing temperature or by modifying the chemical composition of the parent alloy. The addition of B has been found to favour the development of amorphous and NC structures by being introduced in solid solution into the bcc-Fe phase [7]. Crystallization study of Fe52Co10Nb8B30 alloy at 980 and 1000 K revealed the formation of fcc-(Fe,Co) solid solution and fcc-(Fe,Co)23B6 phase [8]. The heat treatment of the melt spun Fe31Co31Nb8B30 (wt%) alloy at 1343 K led to the crystallization of FeB, Fe2B, Fe23B6 and bcc FeCo phases [9].
The purpose of this paper is to prepare the nanocomposite Fe31Co31Nb8B30 powder mixtures by MA, at room temperature, and to study the thermal stability and phase transformation kinetics as a function of milling time. To achieve this objective, emphasis has been given on microstructure characterization of ball-milled samples in terms of lattice imperfections (variation of lattice parameter, grain size, internal strains, etc.) and relative abundances of individual phases by analysing X-ray diffraction (XRD) profiles using the Rietveld refinement [10]. In this later, the background and peak profiles for all phases present in the sample are evaluated. Background is usually described by a polynomial function. For each reflection, the profile is defined by the angular position, the intensity and the peak shape. The position and the intensity are evaluated from the crystal structure and phase composition. The methodology include residual stresses, texture and microstructure contributions, i.e. crystallite size, microstrain and defect concentrations. Indeed, the stress field modifies the peak positions, the texture of the sample affects the integrated intensities of the reflections and the microstructure changes the shape of the profiles.
The Marquardt least-squares procedure was adopted for minimizing the difference between the observed and simulated powder diffraction patterns and the minimization was carried out by using the reliability index parameter, Rwp (weighted residual error), RB (Bragg factor) and Rexp (expected error). This leads to the value of goodness of fit, GoF [10,11]:
 (1)
(1)
Refinement continue still convergence is reached with the value of the quality factor, GoF approaching 1. To simulate the theoretical XRD patterns containing boride phases and solid solutions, some considerations were taken into account as indicated in Table 1.
2. Experimental Details
Pure elemental powders of iron (particle size 6 - 8 µm>99%), cobalt (particle size 45 µm, 99.8%), niobium (particle size 74 µm, 99.85%) and amorphous boron (>99%) were mixed to give a nominal composition of Fe31Co31Nb8B30 (wt%). The milling process wa performed in a planetary ball-mill Retsch PM400, at room temperature, under argon atmosphere with a ball-to powder weight ratio of about 8:1. The rotation speed was 350 rpm. XRD measurements were performed by means of a Bruker D8 Advance diffractometer with Cu-Kα radiation (λCu = 0.15406 nm). The XRD patterns were refined using the Maud program [11] which is based on the Rietveld method combined with Fourier analysis, well adapted for broadened diffraction peaks. Differential scanning calorimetry (DSC) was performed in a DSC822 apparatus of Mettler Toledo under argon atmosphere, in the temperature range 298 - 993 K, at a heating rate of 10 K/min. The Mössbauer spectra were taken, at room temperature, in a transmission geometry using a 57Co source diffused into a Rh matrix. The Mössbauer spectra were computer fitted with a least-square iteration Mosfit program [12].
3. Results and Discussions
3.1. Microstructure
The induced heavy plastic deformation into the powder particles during the milling process gives rise to the creation of a great amount of crystal defects such as dislocations, vacancies, interstitials and grain boundaries which promote solid state reaction at ambient temperature. Depending on the initial mixture, changes in structure of mechanically alloyed powders can occur as follows: grain refinement, solid solution diffusion and/or formation of new phases [1]. Figure 1 shows the evolution of XRD patterns of the Fe31Co31Nb8B30 powders as a function of milling time. The initial mixture (0 h) exhibits the diffraction peaks of pure α-Fe, fcc Co, hcp Co and fcc Nb. The B cannot be detected due to its amorphous state and/ or its low shape factor. The progressive broadening of the diffraction peaks and the decrease of their intensities with increasing milling time can be related to the grain size refinement and the accumulation of internal strains. Furthermore, the appearance and the disappearance of some diffraction peaks are assigned to the formation of new phases. The increase of the baseline, above 5 h of milling, can be assigned to the non-coherent diffraction domains, as those characteristics of grain boundaries which exhibit an amorphous like structure [13]. The XRD patterns were thus analyzed assuming the presence of a supplementary component due to the disordered part: ultrafine coherent crystalline structural domains (<1 nm) were considered.
Table 1. Crystallographic data of boride phases.

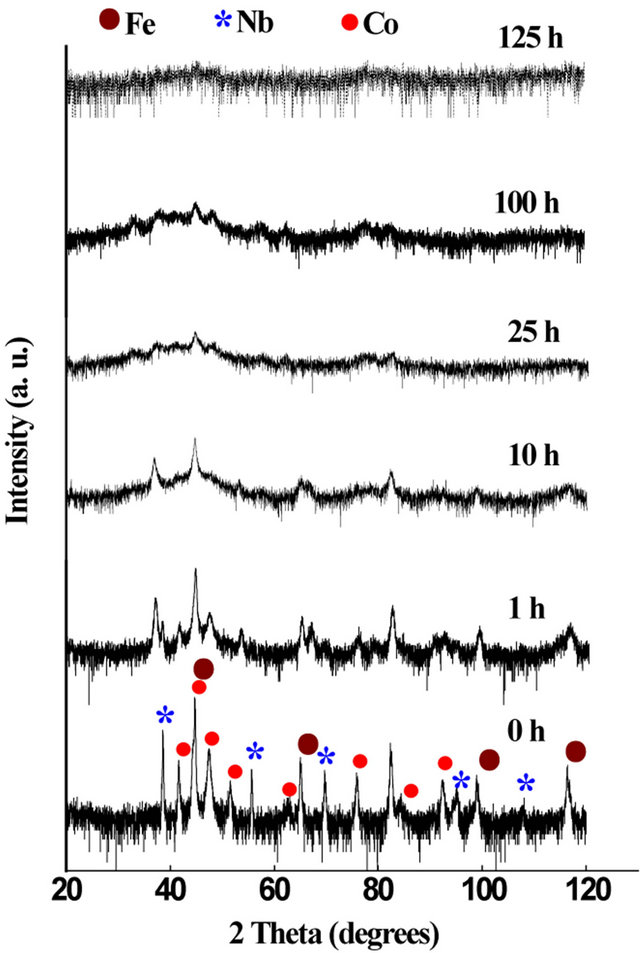
Figure 1. XRD patterns of the Fe31Co31Nb8B30 powders as a function of milling time.
The disappearance of the fcc Co peaks in the early stage of milling (5 h) can be related to the allotropic transformation from fcc to hcp form. Indeed, fcc Co phase is metastable at room temperature and becomes unstable when an external mechanical or thermal energy is introduced [14,15]. It has been reported that the fcc → hcp Co allotropic transformation is faster for the high milling speed and short milling times. The fcc → hcp allotropic transformation can be confirmed by the decrease of the fcc Co volume fraction and the increase of the hcp Co one after 1 h of milling (Figure 2).
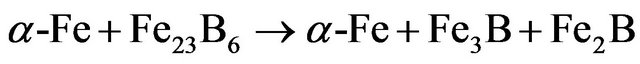
After 10 h of milling, one observes the increase of bcc α-Fe and orthorhombic Fe3B-type peaks intensity (see inset in Figure 3) and the formation of tetragonal Fe2Btype phase (Figure 3). This might be due to the decom-
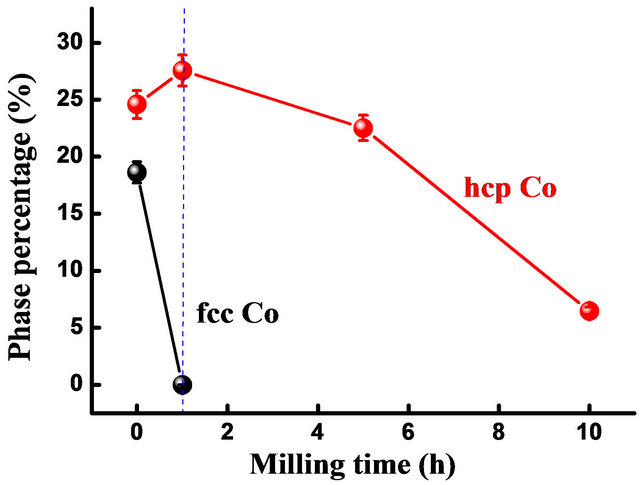
Figure 2. Evolution of hcp and fcc Co percentage as a function of milling time.
position of metastable Fe23B6 phase into orthorhombic Fe3B, tetragonal Fe2B and bcc α-Fe (Figure 4) according to the following reaction:
After 25 h of milling, the diffraction peaks of NC bcc FeCo and disordered FeB-type phases are superimposed to a broad halo typical of highly disordered like amorphous phase. Above this milling time, the XRD patterns present the same phases. An amorphous structure is achieved after 125 h of milling. The early investigators of the amorphization mechanism assumed that the powder particles melted because of the very high rate of plastic deformation and consequent rise in the powder temperature [1]. However, in MA process, destabilization of the crystalline phase is thought to occur by the accumulation of structural defects such as vacancies, dislocations, grain boundaries and anti-phase boundaries [1]. The continuous decrease in grain size and consequent increase in grain boundary area as well as the lattice expansion would also contribute to the increase in free energy of the system and leads to a disorder in atomic arrangement.
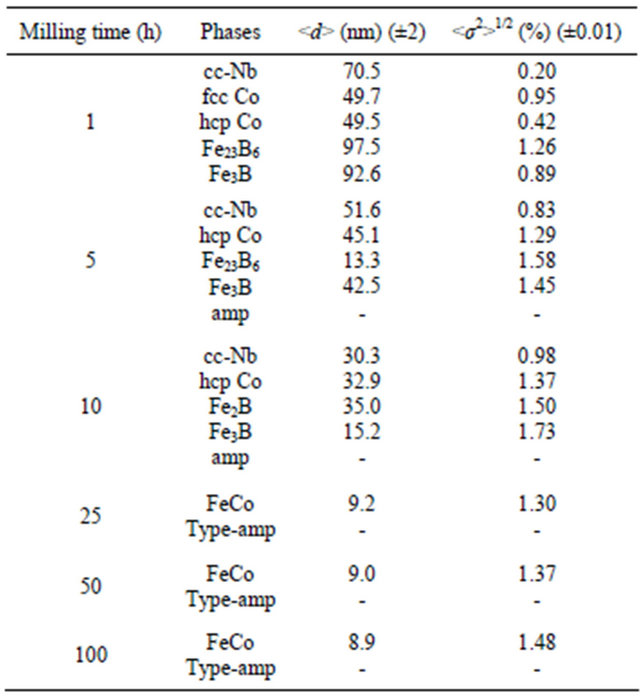
In the NC materials, the crystallite size and lattice strain are very important since the phase constitution and transformation characteristics are dependent on them. High density of defects can be generated with prolonged milling duration leading to an increase in micro-hardness of the powder particles as well as to an increase of internal micro strains (Table 2).
The average crystallite size of α-Fe decreases rapidly to about 18 nm after 25 h, and remains rather milling time independent (Figure 5). Simultaneously, the internal strain increases continuously with increasing milling time to about 1.48% after 100 h. The linear fit of crystallite size gives a slope of −0.376 for short milling times (I) and −0.026 for extended milling times (II). According to the model proposed by Li et al. which describes the evolution of nanostructured grain size during mechanical

Figure 3. Rietveld refinement of the XRD pattern of the powder milled for 10 h. Experimental (dots) and calculated (full line) patterns are shown. Difference is given below (GoF = 1.31; Rwp (%) = 7.05; RB (%) = 4.652; Rexp (%) = 5.38).
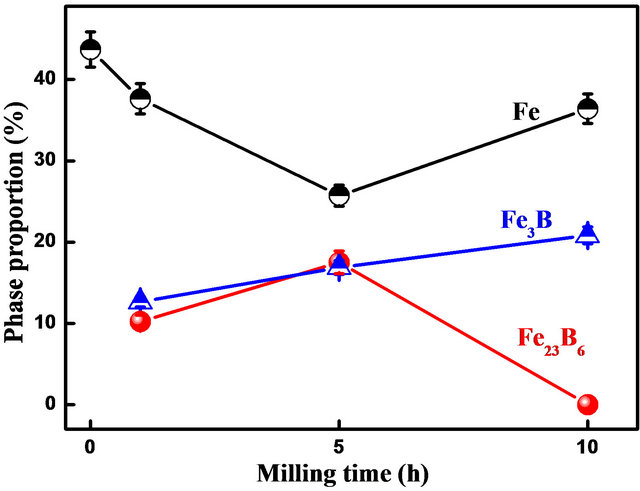
Figure 4. Evolution of the α-Fe, Fe3B-type and Fe23B6-type phase proportions as a function of milling time.
deformation [16], the critical grain size is about d* = 9 nm.
The evolution of α-Fe lattice parameter during the milling process increases up to 10 h, decreases between 10 and 25 h, then remains nearly constant on further milling time (Figure 6). The increase of the lattice parameter may be due to the introduction of internal strains through the heavy plastic deformation and/or to the diffusion of Nb and B in the Fe matrix. The decrease of the lattice parameter between 10 and 25 h of milling can be explained by the increase of the Co content into the α-Fe lattice [17]. Indeed, above 25 h of milling, the lattice parameter value (a = 0.2857 nm) is close to that of bccFeCo phase.
The lattice distortion is also confirmed by the DebyeWaller factor changes during the milling process. The Debye-Waller parameter (DWP) is a measure of the dis
Table 2. Average crystallite size,
placement of atoms from their ideal positions. It consists of static (BS) and thermal (BT) components. According to the diffraction theory derived by Krivoglas [18], BS is related to the static displacement of the atom from the equilibrium position caused by defects such as vacancies, interstitials and dislocations. However, BT is the contribution from the thermal vibrations of the atom around the equilibrium lattice site and is grain size independent [19]. Since all XRD patterns were taken at ambient tempera-
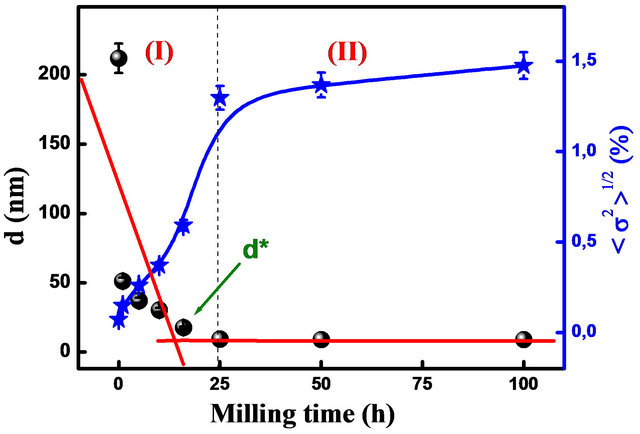
Figure 5. Evolution of crystallite size and internal strain of Fe in Fe31Co31Nb8B30 mixture on several milling times.
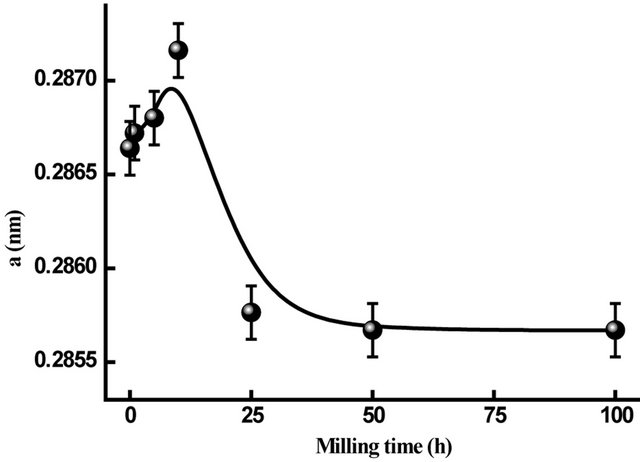
Figure 6. Evolution of the lattice parameter of α-Fe in Fe31Co31Nb8B30 vs. milling time.
ture, the BT of the Fe is fixed to 0.35 Å2 [20,21]. BS increases with microstrain (Figure 7), reaches 1.207 ± 0.06 Ǻ2 after 25 h of milling. This value is higher than those observed for ball milled pure Fe [22], Fe-30Co [23] and Finement-type powders [24]. It was reported that the static DWP in various NC samples increases by l00% - 900% compared to the equilibrium values [22] due to the existence of the lattice distortion in the nanocrystallite lattice.
For milled samples subjected to severe plastic deformation by impacts of balls, dislocations are the main defects besides grain boundaries of which density ρD can be represented in terms of d and  by [25]:
 (2)
(2)
where b is the Burgers vector of dislocations and is equal to 0.24824 nm for Fe. The dislocations density, ρD, increases from 0.051 × 10¹⁶/m2 to about 1.52 × 10¹⁶/m2 after 40 h of milling (Figure 8). The ρD values are comparable to the dislocation densities limit in metal achieved by plastic deformation (1016/m2 for edge dislocations)
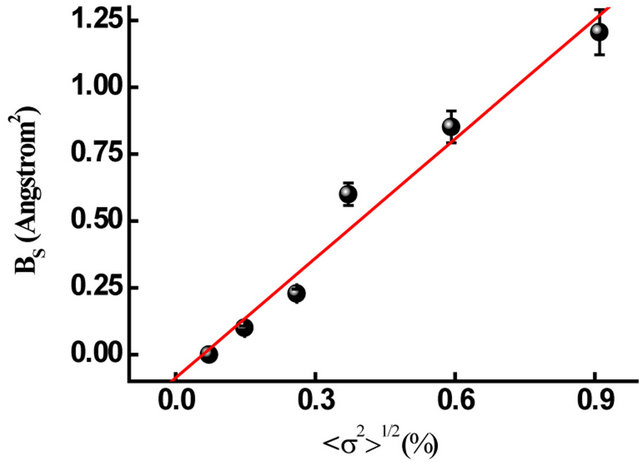
Figure 7. Static Debye-Waller parameter versus microstrains.
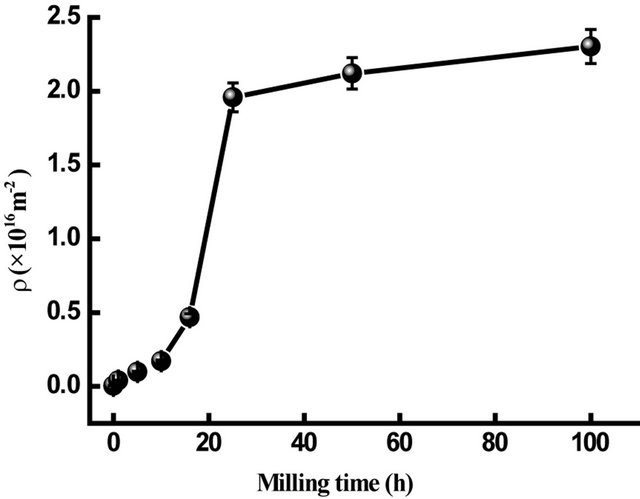
Figure 8. Dislocation density of α-Fe in Fe31Co31Nb8B30 vs. milling time.
[26].
In the case of Co where the Burgers vector is equal to  for the
  direction of the hcp structure and
  for the
  direction of the fcc structure, the dislocations density, ρD, increases from 0.025 × 10¹⁶/m2 to about 0.812 × 10¹⁶/m2 after 16 h of milling for the hcp structure (Figure 9). In both hcp and fcc structures, two different type of stacking faults can be found namely, deformation and twin stacking faults. The stacking fault probability (SFP) deduced from the Rietveld refinement of the XRD patterns for the hcp and fcc Co is shown in Figure 10. For the hcp Co, the SFP increases with increasing milling time to about 0.075 ± 0.002 after 16 h of milling. This value is lower than that obtained in the milled pure Co for 45 h with a rotation speed of 500 rpm and a powder-to-ball weight ratio of 1/10 where the SFP was 0.20 for a crystallite size of about 10 nm [14, 27]. It has been shown that twining and deformation stress depend on the crystallite size and milling intensity [28]. According to Warren’s formulae, 1/(sfp) indicates the average number of hcp compacted layers between two stacking faults (either deformation or twin-type) [14]. Indeed, it is observed the presence of 32 and 16 ordered planes between the two consecutive stacking faults after
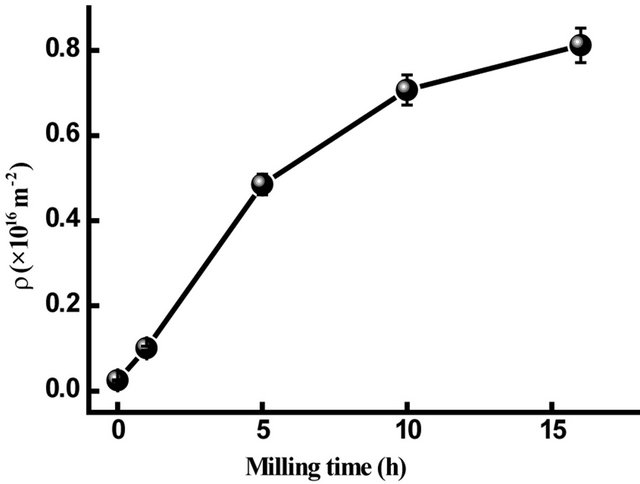
Figure 9. Dislocation density of hcp Co in Fe31Co31Nb8B30 vs. milling times.

Figure 10. Milling time dependence of the stacking fault probability for the hcp-Co and fcc-Co.
5 and 10 h of milling, respectively. Stacking faults are so abundant and the hcp phase can be described as a random sequence of close packed stacking planes.
The increase of the Nb lattice parameter to about 0.3432 nm after 5 h of milling (Figure 11) can be attributed to the plastic deformation and the diffusion of B into the Nb lattice which leads to the formation of Nb(B) solid solution. The reaction between Nb and B is usually observed in the early stage of milling [24,29] because of the negative mixing enthalpy (ΔHmix = −39 kJ/mole). Above 5 h of milling, the lattice parameter remains rather milling time independent suggesting the solubility limit of B in Nb lattice.
The lattice parameter a of the Fe2B boride phase increases to about 0.5604 nm while c remains constant and close to that of the pure phase, c0 = 0.4250 nm. The same behaviour was observed in the FeAlB alloy where the lattice parameter a of the Fe2B phase increases from 0.5110 to 0.5150 nm [30]. The lattice parameter of metastable fcc Fe23B6 phase increases from 1.076 nm to about 1.106 nm between 1 and 5 h of milling, respectively.

Figure 11. Evolution of the lattice parameter of Nb in the Fe31Co31Nb8B30 mixture against milling time.
3.2. Transformation Kinetics
The phase transformation kinetics can be followed by the evolution of the volume fraction of the amorphous phase as a function of milling time. The transformed fraction variation as a function of milling time can be described by the Johnson-Mehl-Avrami (JMA) kinetics formalism since the milling process occurs at a constant temperature:
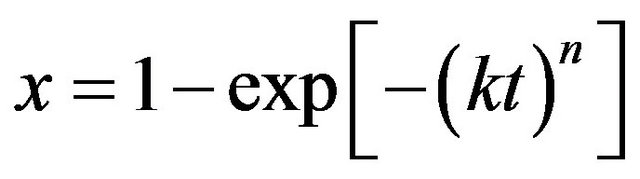 (3)
(3)
where n is a power law exponent that can be used to distinguish the dimensionality of the growth process; x is the transformed fraction of the highly disordered phase (amp-type); t is the milling time and k is the rate constant. The kinetics parameter values, n and k, can be deduced from the double logarithmic plot  versus lnt. Two regimes can be clearly observed as shown in Figure 12 with Avrami parameters of n1 = 1.41 and n2 = 0.34 for the first and the second stage, respectively. The Avrami exponent n1 = 1.41 is comparable to those reported for Finemet and Nanoperm alloys [31]. This value is close to that expected for diffusion controlled growth after immediate nucleation (n = 3/2) [32] and it is higher than that obtained for the primary crystallization of the FeCoNbB alloy prepared by melt spinning where nanostructured α-(Fe,Co) with a mean grain size of ~15 nm is embedded into the amorphous matrix [33]. Those discrepancies may be related to the elaboration process and/ or to the size and morphology dependent growth rate [34]. For the second stage, n2 is rather small (n < 1) and differ significantly from those usually obtained for the nucleation and growth during the crystallization process. Such a low value can be explained by the fact that the presence of large surface area of the mechanically milled powder particles implies a large amount of energy being stored in the milled particles which drives the structural changes in the materials to minimize their internal energy level. The
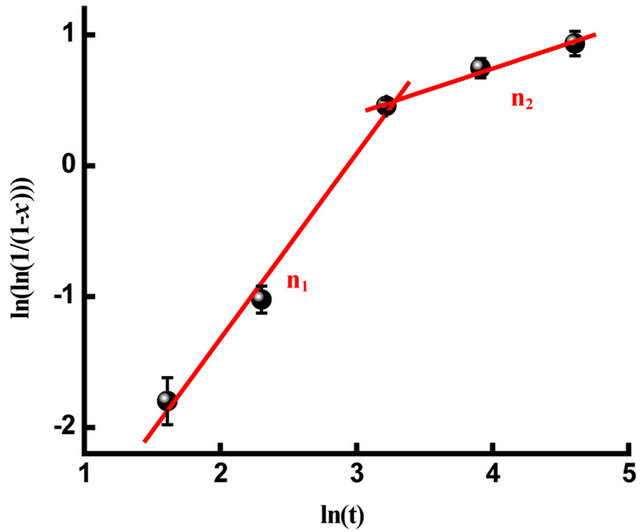
Figure 12. JMA plot as a function of milling time.
diffusion process in the MA process is controlled by both the thermal and mechanical energies. Repeated fracturing and cold welding during MA enable different particles to be always in contact with each other with fresh surfaces. The diffused layers between the powder particles are continuously fractured leading to the minimization of the diffusion distance. With the progress of the milling process, the effective diffusivity can be increased by decreasing crystallite size. The heavy plastic deformation induces a local fusion which supports the formation of alloys by a mechanism of fusion and/or diffusion at relatively high temperatures. This might explain somewhat the low value of the Avrami parameter (n2 = 0.34). This later is comparable to those obtained in the spinodal decomposition mechanism of the solid solution [35].
3.3. Thermal Stability
Thermal analysis is widely used in the reaction study of the mechanically alloyed powder particles because of the obtained metastable disordered structures. Hence, thermal annealing leads to the relaxation of the introduced stresses during the milling process.
The DSC scans of nanostructured Fe31Co31Nb8B30 powders milled for 50, 100 and 125 h are shown in Figure 13. One observes several exothermic and endothermic peaks indicating different thermal effects. The observed endothermic peak at the beginning of heating for the powders milled for 50 h may be due to the ferromagnetic-paramagnetic transition of the amorphous matrix. The fact that this transition was not observed for the powders milled for 100 and 125 h indicate that the amorphous matrix is paramagnetic at room temperature. This result is confirmed by the room temperature Mössbauer spectrum (Figure 14). For all DSC curves, a broad exothermic reaction occurs in the temperature range 360 - 530 K. This behaviour originates from recovery and strain relaxation. Since the transition heats evolving in
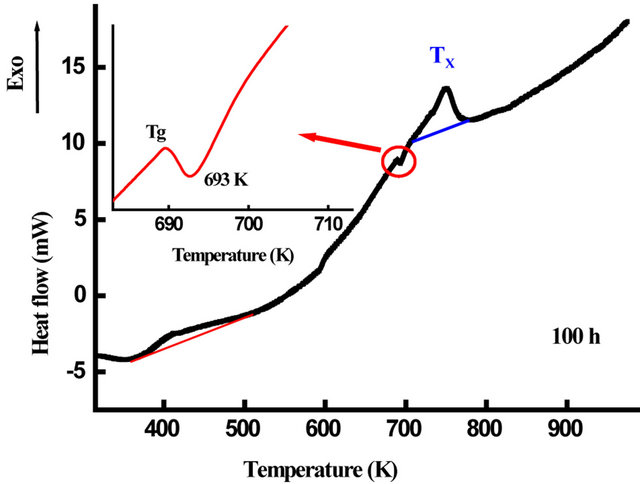
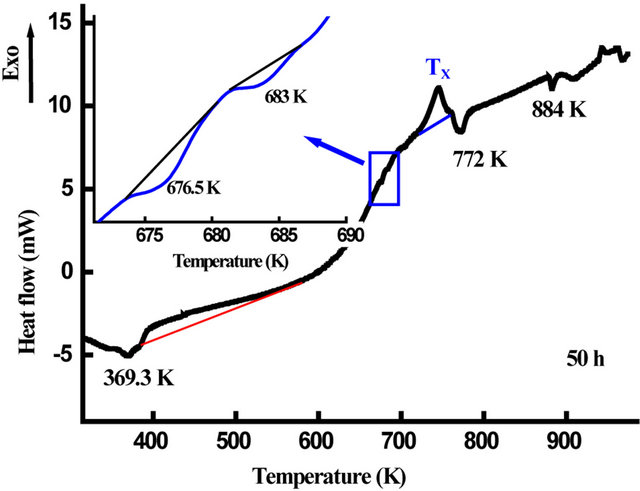
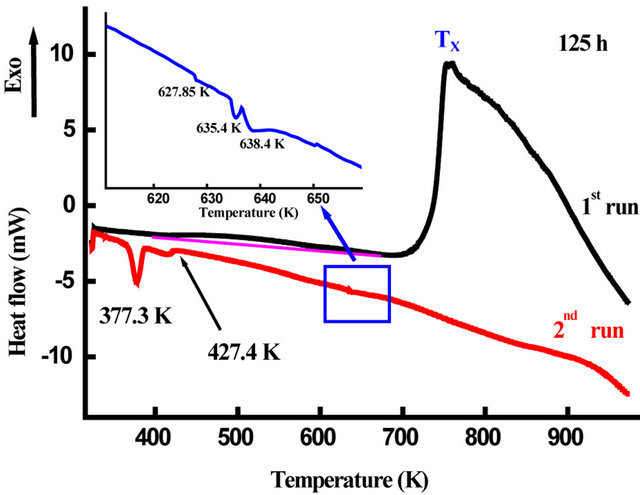
Figure 13. DSC scans of the ball milled Fe31Co31Nb8B30 powders for 50, 100 and 125 h.
the atomic reordering and in the grain growth are comparable in value [36], both atomic disorder and nanocrystallite boundaries are thus major sources of mechanical energy storage. The observed endothermic peak at 693 K after 100 h of milling that can be attributed to the glass transition temperature, Tg, gives evidence of the amorphous state formation. Whereas, the second exothermic peak at Tx can be ascribed to the nanocrystallisation of α-Fe(Co) phase [9].
The glass transition temperature, Tg, of the ball-milled
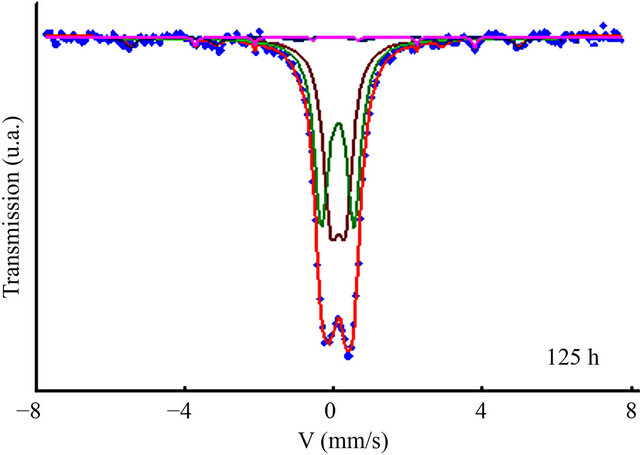
Figure 14. Room temperature Mössbauer spectrum of the Fe31Co31Nb8B30 powders milled for 125 h.
powders, deduced from the DSC scans, is plotted versus milling time in Figure 15. One observes that Tg increases rapidly between 1 and 25 h and slightly on further milling time. The obtained value of about 693 K after 100 h of milling is lower than that of the melt spun alloys with the same composition (Tg = 876 K) [9]. This may be due to the lower nanograins volume fraction and/ or to the heterogeneity of the ball-milled samples. The glass transition is not a first order phase transition but a kinetic event dependent on the rearrangement of the system and experimental time scales. Therefore, the transition would be a purely dynamic phenomenon.
Figure 16 shows the evolution of Curie temperature, Tc, of the amorphous phase in the Fe31Co31Nb8B30 powders against milling time. Since Tc of the amorphous phase is very sensitive to the chemical composition, therefore the progressive decrease of Tc with increasing milling time can be attributed to the increase of B and/or Nb content in the amorphous matrix. It has been reported that the Curie temperature of the FeCoNbB amorphous alloys increases with the B content in the amorphous matrix [37]. Both the first and the second DSC scans of the powders milled for 50 and 125 h, respectively, display many endothermic peaks (see the inset in Figure 13) that can be attributed to Curie temperatures of different Fe-boride phases and the residual matrix (t = 125 h). For example, the endothermic peak at T = 772 K can be related to the Curie temperature of Fe3B [38]. In FeNbBtype alloys, the Fe23B6-type phase which appear after heating above 898 K, has a Tc close to that of metastable Fe3B [39].
The XRD pattern of of the powders milled for 125 h and heated at 1023 K (Figure 17) contains several overlapping peaks arising from the partial crystallization of the amorphous matrix into crystalline phases such as borides. Hence, the best Rietveld refinement is obtained by the introduction of FeCo, Fe3B, Fe23B6 and Nb3B2
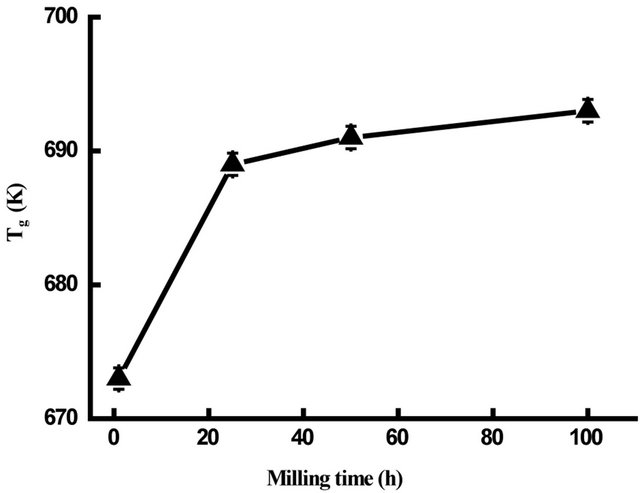
Figure 15. Variation of Tg versus milling time.
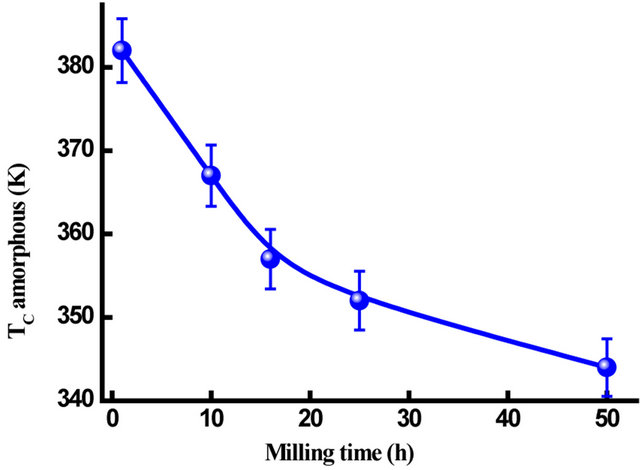
Figure 16. Variation of Tc versus milling time.
phases, in addition to the residual amorphous phase (~12%). The microstructural parameters are listed in Table 3. Shapaan et al. have obtained only two phases: Fe(Co) and Fe23B6 for the amorphous (Fe100 − xCox)62Nb8B30 (x = 33, 50) bulk metallic glasses when heated at 1023 K [9]. The difference may be due to the heterogeneity and/or to the chemical composition of the amorphous phase.
4. Conclusion
During the first 10 h of milling, the Fe31Co31Nb8B30 powders are subject to heavy plastic deformation accompanied by lattice defects, resulting in an enhancement in the solid state reaction between the diffusion couples of the reactant materials leading to the formation of metastable Fe-borides. On further milling, the Feborides are subjected to continuous defects that lead to a gradual change in the free energy. Hence, the powder mixture is completely transformed into an amorphous structure after 125 h of milling which is confirmed by the
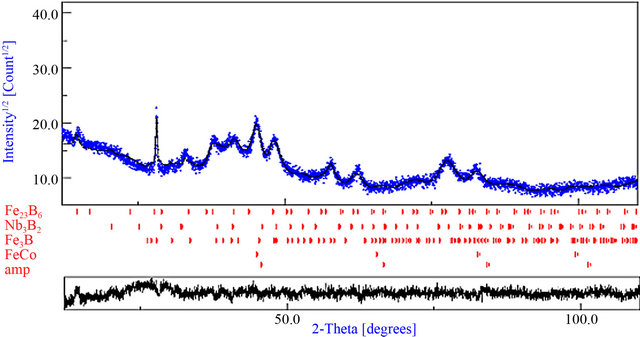
Figure 17. Rietveld refinement of the XRD pattern of the powder milled for 125 h and heated at 1023 K. Experimental (dots) and calculated (full line) patterns are shown. Difference is given below (GoF = 1.051; Rwp (%) = 8.01; RB (%) = 4.201; Rexp (%) = 7.62).
Table 3. Microstructural parameters of the sample milled for 125 h and heated at 1023 K.

appearance of the glass transition temperature at about 693 K.
REFERENCES
- C. Suryanarayana, “Mechanical Alloying and Milling,” Progress in Materials Science, Vol. 46, No. 1-2, 2001, pp. 1-184.
- E. Ma and M. Atzmon, “Phase-Transformations Induced by Mechanical Alloying in Binary-Systems,” Materials Chemistry and Physics, Vol. 39, No. 4, 1995, pp. 249- 267. doi:10.1016/0254-0584(94)01446-N
- C. C. Koch, “Materials Science and Technology: A Comprehensive Treatment,” VCH, New York, Vol. 15, 1991, p. 195.
- R. B. Schwartz, “Metastable and Nanocrystalline Materials,” In: M. D. Barò and S. Surinach, Eds., Mechanically Alloyed, Materials Science Forum, Trans Tech Publications, Zürich, Vol. 269-272, 1998, p. 665.
- Y. H. Zhao, “Thermodynamic Model for Solid-State Amorphization of Pure Elements by Mechanical-Milling” Journal of Non-Crystalline Solids, Vol. 352, No. 52-54, 2006, pp. 5578-5585.
- M. Muller and N. Mattern, “The Influence of Refractory Element Additions on the Magnetic Properties and on the Crystallization Behaviour of Nanocrystalline Soft Magnetic Fe-B-Si-Cu Alloys,” Journal of Magnetism and Magnetic Materials, Vol. 136, No. 1-2, 1994, pp. 79-87.
- J. J. Suňol, A. González, J. Saurina, L. Escoda and P. Bruna, “Thermal and Structural Changes Induced by Mechanical Alloying in Melt-Spun Fe-Ni Based Amorphous Alloys,” Materials Science and Engineering A, Vol. 375- 377, 2004, pp. 874-880. doi:10.1016/j.msea.2003.10.194
- T. Gloriant, S. Suriňach and M. D. Barŏ, “Crystallization versus Magnetization of Fe-Co-Nb-B Amorphous Alloys,” Journal of Non-Crystalline Solids, Vol. 333, No. 3, 2004, pp. 320-326. doi:10.1016/j.jnoncrysol.2003.10.007
- M. Shapaan, J. Gubicza, J. Lendvai and L. K. Varga, “Crystallization Behaviour of (Fe100−xCox)62Nb8B30 Bulk Amorphous Alloy,” Materials Science and Engineering A, Vol. 375-377, 2004, pp. 785-788.
- H. M. Rietveld, “A Profile Refinement Method for Nuclear and Magnetic Structures,” Journal of Applied Crystallography, Vol. 2, 1969, pp. 65-71.
- L. Lutterotti, MAUD CPD Newsletter (IUCr), No. 24, 2000.
- F. Varret and J. Teillet, “Unpublished Mosfit Program,” Université du Maine, France.
- H. Guérault and J. M. Greneche, “Microstructural Modelling of Nanostructured Fluoride Powders Prepared by Mechanical Milling,” Journal of Physics: Condensed Matter, Vol. 12, No. 22, 2000, pp. 4791-4798. doi:10.1088/0953-8984/12/22/311
- J. Sort, J. Noguès, S. Suriňach, J. S. Munoz and M. D. Barò, “Correlation between Stacking Fault Formation, Allotropic Phase Transformations and Magnetic Properties of Ball-Milled Cobalt,” Material Science and Engineering A, Vol. 375-377, 2004, pp. 869-873. doi:10.1016/j.msea.2003.10.186
- F. Cardellini and G. Mazzone, “Thermal and Structural Study of the h.c.p.-to-f.c.c. Transformation in Cobalt,” Philosophical Magazine A, Vol. 67, No. 6, 1993, pp. 1289-1300. doi:10.1080/01418619308225355
- S. Li, K. Wang, L. Sun and Z. Wang, “Simple Model for the Refinement of Nanocrystalline Grain Size during Ball Milling,” Scipta Metallurgica et Materialia, Vol. 27, No. 4, 1992, pp. 437-442. doi:10.1016/0956-716X(92)90207-U
- H. Moumeni, S. Alleg and J. M. Greneche, “Structural Properties of Fe50Co50 Nanostructured Powder Prepared by Mechanical Alloying,” Journal of Alloys and Compound, Vol. 386, No. 1-2, 2005, pp. 12-19.
- M. Krivoglaz, “Theory of X-Ray and Thermal-Neutron Scattering by Real Crystals,” Plenum Press, New York, 1969.
- H. Qian, S. C. Wang, Y. H. Zhao and K. Lu, “Microstrain Effect on Thermal Properties of Nanocrystalline Cu,” Acta Materialia, Vol. 50, No. 13, 2002, pp. 3425-3434. doi:10.1016/S1359-6454(02)00155-6
- N. M. Butt, J. Bashir, B. T. M. Willis and G. Heger, “Compilation of Temperature Factors of Cubic Elements,” Acta Crystallographica A, Vol. 44, 1988, pp. 396-399. doi:10.1107/S0108767387011929
- L. S. Dubrovinsky, N. A. Dubrovinskaia, S. K. Saxena, S. Rekhi and T. Le Bihan, “Aggregate Shear Moduli of Iron up to 90 GPa and 1100 K,” Journal of Alloys and Compounds, Vol. 297, No. 1-2, 2000, pp. 156-161.
- K. Lu and Y. H. Zhao, “Experimental Evidences of Lattice Distortion in Nanocrystalline Materials,” Nanostructured Materials, Vol. 12, No. 1, 1999, pp. 559-562. doi:10.1016/S0965-9773(99)00183-X
- H. Laala-Bouali, F.-Z. Bentayeb, S. Louidi, X. Guo, S. Tria, J. J. Suñol and L. Escoda, “X-Ray Line Profile Analysis of the Ball-Milled Fe-30Co Alloy,” Advanced Powder Technology, Vol. 24, No. 1, 2013, pp. 168-174. doi:10.1016/j.apt.2012.04.007
- S. Alleg, S. Kartout, M. Ibrir, S. Azzaza, N. Fenineche and J. J. Suňol, “Magnetic, Structural and Thermal Properties of the FINEMET-Type Powders Prepared by Mechanical Alloying,” Journal of Physics and Chemistry of Solids, Vol. 74, No. 4, 2013, pp. 550-557. doi:10.1016/j.jpcs.2012.12.002
- G. K. Williamson and R. E. Smallman, “Dislocation Densities in Some Annealed and Cold-Worked Metals from Measurements on the X-Ray Debye-Scherrer Spectrum,” Philosophical Magazine, Vol. 1, No. 1, 1956, pp. 34-45. doi:10.1080/14786435608238074
- J. Eckert, J. C. Holzer, C. E. Krill III and W. L. Johnson, “Structural and Thermodynamic Properties of Nanocrystalline fcc Metals Prepared by Mechanical Attrition,” Journal of Materials Research, Vol. 7, No. 7, 1992, pp. 1751-1761. doi:10.1557/JMR.1992.1751
- J. Sort, A. Zhilayer, M. Zielinska, J. Noguès, S. Suriňach, J. Thibault and M. D. Barò, “Microstructural Effects and Large Microhardness in Cobalt Processed by High Pressure Torsion Consolidation of Ball Milled Powders,” Acta Materialia, Vol. 51, No. 20, 2003, pp. 6385-6393. doi:10.1016/j.actamat.2003.08.006
- M. A. Meyers, O. Vöhringer and A. A. Lubarda, “The Onset of Twinning in Metals: A Constitutive Description,” Acta Materialia, Vol. 49, No. 19, 2001, pp. 4025-4039. doi:10.1016/S1359-6454(01)00300-7
- S. Alleg, S. Souilah, R. Bensalem, A. Younes, S. Azzaza and J. J. Suñol, “Structural Characterization of the Mechanically Alloyed Fe57Co21Nb7B15 Powders,” International Journal of Nanoparticles, Vol. 3, No. 3, 2010, pp. 246-256. doi:10.1504/IJNP.2010.035880
- M. M. Rico, J. M. Greneche and G. A. Pérez Alcázar, “Effect of Boron on Structural and Magnetic Properties of the Fe60Al40 System Prepared by Mechanical Alloying,” Journal of Alloys and Compounds, Vol. 398, No. 1-2, 2005, pp. 26-32.
- M. E. McHenry, M. A. Willard and D. E. Laughlin, “Amorphous and Nanocrystalline Materials for Applications as Soft Magnets,” Progress in Materials Science, Vol. 44, No. 4, 1999, pp. 291-433. doi:10.1016/S0079-6425(99)00002-X
- J. Bigot, N. Lecaude, J. C. Perron, C. Milan, C. Ramiarinjaona and J. F. Rialland, “Influence of Annealing Conditions on Nanocrystallization and Magnetic Properties in Fe73.5Cu1Nb3Si13.5B9 Alloy,” Journal of Magnetism and Magnetic Materials, Vol. 133, No. 1-3, 1994, pp. 299- 302.
- J. S. Blazquez, C. F. Conde and A. Conde, “Crystallization Process in (FeCo)78Nb6(BCu)16 Alloys,” Journal of Non-Crystalline Solids, Vol. 287, No. 1-3, 2001, pp. 187- 192. doi:10.1016/S0022-3093(01)00562-2
- K. Suzuki and J. M. Cadogan, “The Effect of the Spontaneous Magnetization in the Grain Boundary Region on the Magnetic Softness of Nanocrystalline Materials,” Journal of Applied Physics, Vol. 85, No. 8, 1999, pp. 4400-4402. doi:10.1063/1.369797
- S. Alleg, B. Bouzabata and J. M. Greneche, “Kinetics Study of the Spinodal Decomposition in the Fe-30.8Cr- 12.2Co Alloy by Mössbauer Spectrometry,” Journal of Alloys and Compounds, Vol. 282, No. 1-2, 1999, pp. 206- 212.
- S. Azzaza, S. Alleg, H. Moumeni, A. R. Nemamcha, J. L. Rehspringer and J. M. Greneche, “Magnetic Properties of Nanostructured Ball-Milled Fe and Fe50Co50 Alloy,” Journal of Physics: Condensed Matter, Vol. 18, No. 31, 2006, pp. 7257-7272. doi:10.1088/0953-8984/18/31/020
- K. Suzuki, J. M. Cadogan, V. Sahajwalla, A. Inoue and T. Masumoto, “Fe91Zr7B2 Soft Magnetic Alloy,” Journal of Applied Physics, Vol. 79, No. 8, 1996, pp. 5149-5151. doi:10.1063/1.361536
- H. H. Liebermann, J. Marti, R. J. Martis and C. P. Wong, “The Effect of Microstructure on Properties and Behaviours of Annealed Fe78B13Si9 Amorphous Alloy Ribbon,” Metallurgical Transactions A, Vol. 20, No. 1, 1989, pp. 63-70.
- P. Gorria, J. S. Garitaonandia and J. M. Baran “Structural and Magnetic Changes in FeNbCuSiB Amorphous Alloys during the Crystallization Process,” Journal of Physics: Condensed Matter, Vol. 8, No. 32, 1996, pp. 5925-5939. doi:10.1088/0953-8984/8/32/012
NOTES
*Corresponding author.