Open Journal of Psychiatry
Vol.4 No.3(2014), Article ID:47983,10 pages
DOI:10.4236/ojpsych.2014.43031
A Study of Visual Recognition of Facial Emotional Expressions in a Normal Aging Population in the Absence of Cognitive Disorders
Philippe Granato1,2, Shreekumar Vinekar3*, Olivier Godefroy4, Jean-Pierre Vangansberghe5#, Raymond Bruyer6
1Department of Psychiatry, Centre Hospitalier Sambre Avesnois (CHSA), Maubeuge, France
2Fédération régionale de Recherche en santé Mentale de Lille, Lille, France
3Department of Psychiatry and Behavioral Sciences, University of Oklahoma Health Sciences Center, Oklahoma City, Oklahoma, USA
4Department of Neurology North Hospital, Centre Hospitalier Régional d’Amiens, Amiens, France
5Data Processing Consultant, Brussels, Belgium
6University of Louvain-la-Neuve, Institute of Psychological Science (IPSY), Center of Neuroscience, Cognition and Systems (NEUROCS), Louvain-la-Neuve, Belgium
Email: *shreevinekar@yahoo.com
Copyright © 2014 by authors and Scientific Research Publishing Inc.
This work is licensed under the Creative Commons Attribution International License (CC BY).
http://creativecommons.org/licenses/by/4.0/


Received 18 May 2014; revised 20 June 2014; accepted 15 July 2014
ABSTRACT
Objective: To examine and measure the decision-making processes involved in Visual Recognition of Facial Emotional Expressions (VRFEE) and to study the effects of demographic factors on this process. Method: We evaluated a newly designed software application (M.A.R.I.E.) that permits computerized metric measurement of VRFEE. We administered it to 204 cognitively normal participants ranging in age from 20 to 70 years. Results: We established normative values for the recognition of anger, disgust, joy, fear, surprise and sadness expressed on the faces of three individuals. There was a significant difference in the: 1) measurement (F (8.189) = 3896, p = 0.0001); 2) education level ((2(12) = 28.4, p = 0.005); 3) face (F(2.195) = 10, p = 0.0001); 4)series (F (8.189)=28, p = 0.0001); 5) interaction between the identity and recognition of emotions (F (16, 181 =11, p = 0.0001). However, performance did not differ according to: 1) age (F (6.19669) = 1.35, p = 0.2) or 2) level of education (F (1, 1587) = 0.6, p = 0.4). Conclusions: In healthy participants, the VRFEE remains stable throughout the lifespan when cognitive functions remain optimal. Disgust, sadness, fear, and joy seem to be the four most easily recognized facial emotions, while anger and surprise are not easily recognized. Visual recognition of disgust and fear is independent of aging. The characteristics of a face have a significant influence on the ease with which people recognize expressed emotions (idiosyncrasy). Perception and recognition of emotions is categorical, even when the facial images are integrated in a spectrum of morphs reflecting two different emotions on either side.
Keywords:Recognition, Emotions, M.A.R.I.E., Aging, Healthy Participants, Emotion Stimulus (ES), Emotion Set (ESet), Emotion Series (ESr), VRFEE, Emotion Recognition (ER), Canonical Emotions (CE), Intermediate Emotions (IE)

1. Introduction
Visual Recognition of Facial Emotional Expressions (VRFEE) precedes language development. It may even be an innate skill [1] [2] . Throughout life, social interactions are associated with meaningful emotional expressions and proper recognition of facial emotions [3] [4] . Many authors have explored the effects of aging on VRFEE [5] -[12] . According to Calder and Lambrecht [13] [14] , aging causes a decrease in the recognition of fear and, to a lesser extent, sadness and anger.
Advancing age leads to social isolation, athymhormia, and, in extreme situations, self-engendered virtual confinement, all of which are associated with declining cognitive [5] [6] and emotional skills [7] [8] . All areas of the brain diminish in volume during aging, even in the absence of dementia. The frontal lobe is the most affected [15] -[17] . Phillips et al. [18] state that the ventromedial part of the frontal lobe is involved in the recognition of emotions and shows signs of malfunction starting at 70 years of age. The prefrontal region supports cognitive functions: malfunctions in this region begin to appear at 30 years of age [18] .
It is difficult to compare and contrast the existing literature surrounding the recognition of emotions for reasons including the heterogeneity of the populations studied, the number and types of emotions studied, the measuring tools used, and variations in experimental settings [19] -[21] . Until recently, quantitative measurement and objective assessment of VFREE seemed impossible. To address these challenges, we developed a computer program that uses morphing software to provide images of faces portraying a continuum of emotions. We named the new program Method for the Analysis and Research on the Integration of Emotions (M.A.R.I.E.) [22] -[25] . Using M.A.R.I.E., we measured VRFEE in healthy participants between the ages of 20 and 70 years. Our aims were to 1) examine and quantitatively measure the decision making processes involved in VRFEE, 2) study the effects of demographic factors on those processes, and 3) determine the existence of a VRFEE disorder manifested during normal aging uncomplicated by impairments of cognitive functions.
2. Method
2.1. Participants
Before beginning the study, we obtained approval from the National Commission of Data Processing and Freedom (CNIL) and the Advisory Committee on Protection of Persons in Biomedical Research (CPPRB), which are France’s equivalents of the Institutional Review Board. Participants were volunteers and signed an informed consent to participate, after the study had been explained to them. Participants were grouped by age as follows: 20 - 30, 31 - 40, 41 - 50, 51 - 55, 56 - 60, 61 - 65, and 66 - 70 years. In order to be able to perform multivariate analysis, 30 participants were recruited for each age group. Due to the specificity of the inclusion and exclusion criteria, only 24 participants were included in the 66 - 70 age group.
Participants were residents of the city of Lille in northern France. All were Caucasian, right-handed, and spoke French as their native language. All participants received a medical consultation and psychiatric evaluation to determine current medication usage, neurological diseases, diabetes, hypertension, and/or psychiatric disorders. Visual acuity was required to be equal to Snellen’s 20/20 with or without correction for distant vision, with a normal reading ability at 12 to 18 inches from the eyes, with or without correction.
Exclusion criteria included: presence of drug or alcohol dependency and abuse, dementia, recognizable neurological disorders, diabetes, hypertension, or recognizable psychiatric or neurological disorders. We excluded 362 participants, for a final sample of 204 participants (50% female). Participant characteristics are described in Table1
All participants completed the Hamilton Anxiety Scale (HAMA) [26] -[33] and the Hamilton Depression Rating Scale (HDRS) [34] . We administered a standardized structured clinical interview using the International Neuropsychiatric Interview (MINI) [31] . No participants had taken psychotropic drugs or other drugs for at least 6 months before the study began (Table 1). All participants underwent assessment with M.A.R.I.E. Participants older than 50 years of age also underwent a cognitive assessment, which included the administration of the Mini Mental Status Examination (MMSE) [35] , the Mattis Dementia Rating Scale [36] , and the Grober and Buschke Scale [37] , which measures verbal episodic memory.
2.2. Computer Software and Tests
Tests were constructed using the previously mentioned software developed specifically for this study,Method for the Analysis and Research on the Integration of Emotions (M.A.R.I.E.) [22] -[25] . M.A.R.I.E. is based on a methodology already in use [26] -[29] . The program uses computer morphing to transform images of faces expressing one “Canonical Emotion” (CE) “A” into another, different CE “B”. For example, M.A.R.I.E. can be used to transform images of joy “A” into sadness “B”. This process creates a visual continuum of “Intermediate Emotions” (IE) (Figure 1). CEs incorporated in our program include anger, disgust, fear, joy, neutral, sadness, and surprise [30] .
We produced nine Emotion Series (ESrs): anger-fear, anger-sadness, joy-sadness, neutral-anger, neutral-disgust, neutral-joy, fear-neutral, neutral-surprise, and neutral-sadness. In ESrs, M.A.R.I.E. changes images of Emotion A, gradually and imperceptibly, into images of Emotion B. Participants viewed a continuum of images showing various emotions expressed by one of three possible faces (of a blonde female, a brunette female, and a male). They then associated the image of one IE with one of two possible CE. For each new IE that appears on the screen, the participant must press one of the two mouse buttons so that the next IE will appear on the screen. The participant chooses to press the left or right mouse button to select the emotion stimulus that they associated with CE “A” or CE “B”. This forced-choice test examines binary decision-making (Figure 2).
M.A.R.I.E. was developed with ICON AUTHOR® Version 5 [22] [24] [25] [29] . It records a participant’s response to a black and white photograph of an emotion stimulus that expresses a CE or IE. The use of 3 different faces allows us to increase the number of measurements taken, increases reliability, and enhances statistical power. This also permits us to account for specific facial characteristics potentially influencing the recognition of emotions, which can be described as “idiosyncrasy”. Idiosyncrasy is the frame of mind that enables a person

Table 1 . Participants’ characteristics, n: number; M/F: sex ratio; age (mean and standard deviation); level of education: (1) less than 12 years of schooling, (2) between 12 and 15 years of schooling, (3) more than 15 years of schooling; Hamilton’s scale of depression: HDRS (mean and standard deviation); Hamilton’s scale of anxiety: HAMA (mean and standard deviation); the MMSE (mean and standard deviation); the Grober and Buschke scale: immediate recall (mean and standard deviation)/total recall 1 (mean and standard deviation)/total recall 2 (mean and standard deviation)/total recall 3 (mean and standard deviation)/deferred total recall (mean and standard deviation).

Figure 1. (ESr) Series joy and sadness (joy-sadness) based on the principle of intermediate emotion (IE) images, going from canonical emotion Images 1 (CE - joy) to 19 (CE - sadness).
1 2 3 4 5 6 7 8 9 10 11 12 13 14 15 16 17 18 19


Figure 2. Experimental setting: The participant faces the computer monitor. He/she must associate the emotion stimulus (central, unlabeled image) with one of the two flanking images. The set of three images is collectively termed an Emotion Set (Eset), by clicking on the right or left button of the computer mouse with his middle or index finger of the right hand.
JOY SADNESS
to give a personal opinion that is different from that of most other people in the group, based on a unique response to exteroceptive sensory impressions. Images of the blonde female face were taken from “Pictures of Facial Affect” [30] with permission from Paul Ekman, who also kindly contributed the other images.
2.3. Construction of Stimuli
A pixel is an elementary point of an image represented in digital form. The digital photograph of a face expressing a given emotion consists of a large number of pixels. M.A.R.I.E. can individually modify or replace these with pixels from a second image. The inversion is done using the same topographic features. An IE is a controlled, computer-generated “mixture” of 2 CEs, using a proportional inverse of pixels from 2 CEs, “A” and “B”. The result of this combination is called an emotion stimulus (ES). Each image of an emotion stimulus (ES) was defined by a progressive increase in pixels of emotion “B”: 0%, 10%, 20%, 30%, 35%, 38%, 41%, 44%, 47%, 50%, 53%, 56%, 59%, 62%, 65%, 70%, 80%, 90%, and 100%, assigned to images #1 to #19 comprising an ESr (Figure 1).
The mixed emotion stimulus (ES) image was presented at the center of the screen, between an image of the CE “A” on the left and the CE “B” on the right. The name of each CE was displayed under the corresponding image of the CE “A” at an angle of 5˚. We called this set of three pictures an “emotion set” (ESet). The presentation was identical for images using a blonde female face and a brunette female face. For images using the male face, CE images were omitted, but the CE names were included in order to mimic the conditions of meeting an individual in person.
The order of presentation of each ESet was the same for each participant and for each of the 513 ESs (9 ESr × (2 CE + 17 IE) × 3 different faces = 513). The two last ESs for each ESr, #1 and #19, were shown in the penultimate and last positions. The remaining 17 IE were presented in random order. This random order was the same for each ESr. Participants were not required to memorize or verbally label emotions as this could contaminate the test.
The task was a binary forced-choice. The ES remained displayed until the subject responded. The order of presentation of ESrs was: anger-fear, anger-sadness, joy-sadness, anger-neutral, neutral-disgust, neutral-joy, neutral-fear, neutral-surprise, and neutral-sadness. The first 3 combinations were bipolar ESrs, with a CE in the first and the last image. The last 6 combinations were unipolar ESrs, due to the presence of neutrality or lack of a CE in the first image. The faces were presented in the following order: 1) blonde female, 2) brunette female, and 3) male. In all nine ESrs displaying images of the male face, the CE images “A” and “B” were absent from both sides of ESet, in order to mimic meeting a person in real life. When we meet a person, we must quickly identify the expression that is expressed on his/her face. The goal of this test was to find out if our memory stores archetypes of facial emotions.
The participant pressed the left or right button of the mouse with the index or middle finger (right hand), to select the emotion stimulus that they associated with CE “A” or CE “B”. For each ES, we counted the number of participants in each age group who actually recognized emotion “B”. Then, we divided this number by the number of participants in each group. This gave us a response rate of recognition of the ES “B”. For each of the 19 ES’s of each ESr, we compared the percentage of recognition of the “B” picture by the participants to the percentage of pixels from the CE “B” in each ES. We chose several “measures”. Measures #1 (0%), #2 (10%), #8 (90%), and #9 (100%) correspond to pixels of CE “B” to emotion stimuli #1 (0%), #2 (10%), #18 (90%), and #19 (100%). Measures #3 (28.3%), #4 (41%), #5 (50%), #6 (59%), and #7 (71.7%) correspond respectively to the average saturation of emotion “B” to emotion stimuli #3 (20%), #4 (30%), #5 (35%); #6 (38%), #7 (41%), #8 (44%); #9 (47%), #10 (50%), #11 (53%); #12 (56%), #13 (59%), #14 (62%); #15 (65%), #16 (70%), and #17 (80%).
All participants were required to first succeed at a control task. This control task used the same binary forcedchoice decision-making process, but used a series of images from an intermediate geometric continuum between a square and a circle. The task did not require emotion processing.
2.4. Data Analysis
We analyzed the data using SPSS software v. 11 (SYSTAT Software, Inc. “SPSS.com”). Analysis of variance (ANOVA) was performed with the inter-subject factors of “age” (n = 7), “face” (n = 3), number of emotions (n = 9), and measurement (n = 9). Post hoc analysis was performed using the Bonferroni test to assess inter-subject variability, and using contrasts to assess repeated measures, Wilks’ lambda statistic was calculated for the multivariate analysis. The alpha risk was set at 5%.
Comparison of qualitative variables was performed using the chi-square test. The dependent variable was the rate of “B” responses of the participants. We analyzed the “performance” (percentage of “B” answers for each image) in recognition of facial emotions by multivariate analysis. We conducted an analysis of covariance with the level of education as a covariate, the inter-subject factor of age (n = 7) and intra-subject factors of “face” (n = 3), emotion series (n = 9), measurement (n = 9), and gender (n = 2). The Wilks’ lambda multivariate test was used, and subsequent analyses were performed by the Bonferroni test with a p level of 0.001.
3. Results
There was a significant difference in education level among the seven age groups (c2(12) = 28.4, p = 0.005). There were no significant differences for the remaining parameters: each group was fairly homogeneous within itself. Performance did not differ according to age (F (6.19669) = 1.35, p = 0.2) or by level of education (F (1, 1587) = 0.6, p = 0.4). Effects for measurement {F (8.189) = 3896, p = 0.0001), face (F (2.195) = 10, p = 0.0001}, and series {F (8.189) = 28, p = 0.0001} were significant. Figure 3 depicts the percentage of the sample that correctly identified each emotion. For each ESr, the CE “A” and “B” were rarely recognized by 100% of participants in each group.
The interaction between the identity of the face and recognition of emotions in the series was significant (F (16, 181 = 11, p = 0.0001) (Figure 4). In ESrs using images of the blonde female face, participants were less able to recognize sadness in the joy-sadness and the anger-sadness ranges. More participants accurately recognized joy in the neutral-joy continuum and fear in the neutral-fear continuum. In contrast, for ESrs using the brunette female face, participants were least able to accurately recognize anger in the neutral-anger series and surprise in the neutral-surprise series, but were most accurate in identifying sadness in the neutral-sadness series and joy in the neutral-joy ESrs. Finally, participants were least able to accurately identify anger in the neutralanger and fear in the anger-fear ESrs when viewing images of the male face, but were most accurate in recognizing joy in the neutral-joy and fear in the neutral-fear ESrs.
The most accurate scores for joy, fear, and disgust could be explained by greater expressiveness of emotions portrayed by some faces, or increased sensitivity of the participant population to some faces and some emotions. Performance for bipolar ESrs was inconsistent, except for the ESr for anger-fear. For the unipolar ESrs, surprise was poorly recognized by participants when looking at all three faces (blonde female: 61.6%, brunette female: 47.9%, male: 65.2%). Disgust, sadness, fear, and joy were the four most easily recognized facial emotions, with
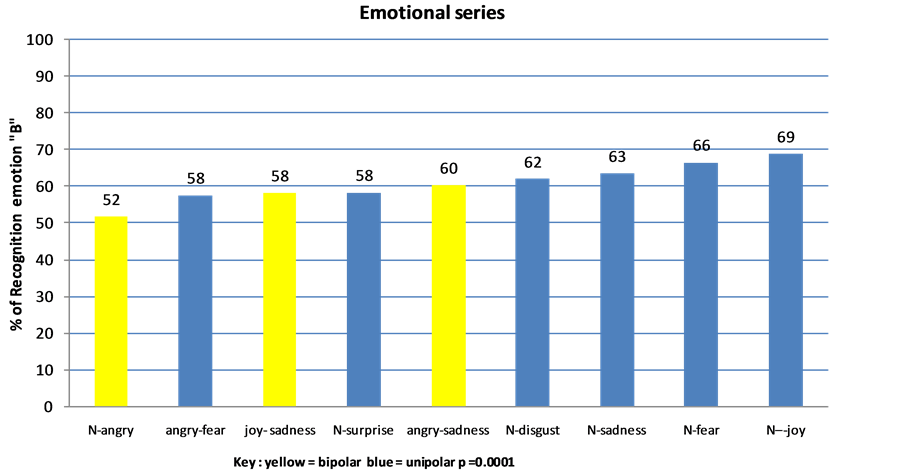
Figure 3. Response rate “B” for each emotional series (F (8,189) = 28; p = 0.0001).
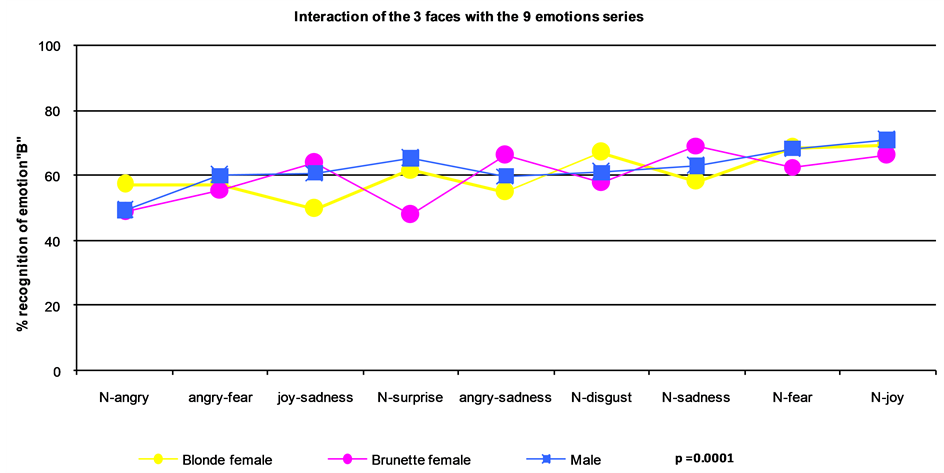
Figure 4. Emotion profile or idiosyncratic effect (F (16, 181) = 11; p = 0.0001).
similar scores regardless of the face in the image. Anger was the most difficult emotion to recognize. Each face seemed to have a specific “emotional profile within the study sample (Figure 4).
4. Discussion
Strict inclusion and exclusion criteria led us to select a “hyper normal” sample. This sample is not representative of the population studied. However, this sample was cognitively homogeneous. Control of cognitive factors allowed better appreciation of the interactions of gender, age, and face, with the emotion series influencing measures of the VRFEE. Despite higher cognitive functions and homogeneity, 0.7% to 1.2% of participants did not accurately recognize the CE “A” and “B” in the ESRrs. Assuming a correlation between cognition and VRFEE, this percentage could increase in a “normal” population with cognitive heterogeneity, and could be a reflection of the universal Bell Curve distribution of this ability in all samples of participants. A correlation between cognition and VRFEE could explain some social and interpersonal dysfunction. Additional studies using M.A.R.I.E. to examine recognition of emotions with samples of people who have different cognitive levels could be helpful in understanding specific aspects of some behavior disorders.
Our “hyper normal” sample does not establish a link between aging and emotion recognition, because VRFEE scores were optimal across all age groups. These results concur with the work of Phillips et al. [18] , but do not agree with the findings of Pasupathi, Sze, and West [28] [38] [39] . The latter noted that age has the greatest impact on the recognition of expression of sadness, with the greatest age effect seen at the 50% level of presentation across the adult life span [39] . Calder and Lambrecht [13] [14] reported that VRFEE decreases from the age of 40 years onward. The persistence of proper recognition of joy during aging seems a more consensually verified outcome when our results are compared with those reported in the literature [40] . Recognition of fear and disgust seem uninfluenced by aging in the absence of cognitive impairment. For other emotions, however, there were non-significant variations with aging. It cannot be overstated that during aging in the absence of dementia, the presence of neurocognitive impairment from other etiologies is “acquired”. Our results are only generalizable to cognitively intact populations.
CE images “A” and “B” were absent from the ESet of the male face, presenting a more difficult task with the ESets of the blonde and brunette women’ faces. The results for recognition of emotions expressed by the man are almost similar to the recognition of emotions expressed by the two women. This is counterintuitive, as one would expect the scores to fall. This could be explained by the presence of archetypal emotional images in the brain, learning effects, or both. To distinguish between these two hypotheses referring to innate ability versus acquired learned ability, we could have started the test using the man’s face without the images A and B first, and later we could have compared the findings with those of blonde and brunette women’s ESets which included the images A and B.
Our results suggest that new learning was not required for a good VRFEE score. If such were the case, participants’ scores using the brunette images would have been equal to or higher than their scores using blonde images, and lower than those using male images. This hypothesis, though strongly supported by our findings, may not hold due to the small number of faces used in this study.
The paradoxical aspect of these results could be explained by the presence of archetypal images of facial emotions in the human brain. Ascertaining whether these archetypal images are innate or acquired would involve studies in age ranges from birth to age 20. Recognition of anger, surprise, sadness, and even joy depend on the face. This variation in the results can be explained by the effect of idiosyncrasy rather than learning effects. The choice of the three different faces was aimed at identifying and confirming this hypothesis. Visual idiosyncrasy could also explain inconsistent comparative results between authors, despite identical study methodologies.
The profile of VRFEE appears to be specific to the combination of “face-emotion-sample”. In the event of a consistently identical profile of results, despite the different samples from different populations tested, the findings would confirm the universality of emotion recognition. The current study suggests that the opposite is true, perhaps reflecting that there is variability due to idiosyncrasy. This hypothesis should be investigated in future studies.
The pictorial representation of recognition scores for each ESet of each face is a curve, specific to each face. The identity of faces is the most important variable that distinguishes the three curves. This implies that every face has an original profile of emotional recognition which is specific and unique for each individual. In other words, a face has a single emotional recognition profile. A parallel can be drawn with a person’s fingerprints. However, the question arises whether this hypothesis of an “emotional fingerprint” applies equally to different populations, different age groups, and different developmental levels of cognition.
This work provides an objective and quantified understanding of the neurocognitive underpinnings of recognition of emotional expressions. Known to be necessary components of emotional intelligence, these skills develop prior to the emergence of verbal intelligence. The advent of tools such as M.A.R.I.E. can help us to better understand the interaction of these emotion recognition skills in the development of emotional intelligence and in mastering social skills. The origin of these skills is in the preverbal developmental period and may also have a critical period, making it impossible to learn or master these basic skills past a certain stage or age in human development, like acquiring the first language skills.
The bipolar emotional ESrs had adequate recognition percentages. Studying the difficulty in recognizing emotions on these bipolar ESrs should lead to deeper inquiry into discrete and differentiated organic substrata for these recognition systems. Functional neuroimaging (fMRI) could be used to monitor and differentially reflect on the neuronal activity associated with these systems.
Normal aging without cognitive impairment does not lead to disorders of emotional recognition. This is a monumental finding which could foster emotional wellness and maturity in aging populations. Joy is the most recognized emotion, followed by fear, sadness, and disgust. This could be the basis for psychological wellness or even robust general health in the less stressed aging population. Thus, one could postulate a positive feedback loop between “joy” and emotional-physical wellness. Enhancing experience of “joy” either through play, humor, meditation or meaningful social relationships will foster wellness.
The numerical measure of visual recognition of facial emotions proposed in this paper could help in resolving and reconciling the heterogeneity of the results in the literature.
Finally, we draw attention to the neurocognitive disorder of visual recognition of facial emotions by describing it as “PERCEPTIVE AGNOSOTHYMIA” [22] . Insofar as it affects the sensory modality of vision, we may describe this phenomenon as “visual agnosothymia”. This type of agnosothymia can affect other senses, mainly hearing. The M.A.R.I.E. principle can easily be modified to design a continuum in these other sensory modalities and to allow for recording binary type responses.
This preliminary work raises the question of a standard methodology for measuring VRFEE to compare results between different researchers. The study of combinations of different population samples and faces with different expressive abilities or from different socio-cultural backgrounds would be useful. This could allow for a more contemporary approach to the universality of VRFEE and its application in the field of medicine, especially in the early diagnosis leading to early treatment of a variety of disorders.
Disclosures and Acknowledgements
This work was supported by the grant 1998/1954 of the Programme hospitalier de recherché clinique of the French government. Thanks are due to Paul Ekman who gave permission to use photographs from “Unmasking the faces” (Ekman & Friesen, 1975) and to Olivier Lecherf who designed the computer program for processing and displaying the pictures. Our thanks go to Professor Libersa Christian who hosted us at the research laboratory of the University Hospital of Lille CIC. We thank Kathy Kylerfor her help and her availability in the correction and guidance of this article.
References
- Darwin, C. (1872) The Expression of the Emotions in Man and Animals. John Murray, London. http://dx.doi.org/10.1037/10001-000
- Ekman, P. (1994) Strong Evidence for Universals in Facial Expressions: A Reply to Russell’s Mistaken Critique. Psychological Bulletin, 115, 268-287 http://dx.doi.org/10.1037/0033-2909.115.2.268
- Bruyer, R. (1987) Les mécanismes de reconnaissance des visages. Presses Universitaires de Grenoble, Grenoble.
- Lockard, J. (1980) Studies of Human Social Signals/Theory, Methods and Data. In: Lockard, J., Ed., Evolution of Human Social Behavior, Elsevier, Amsterdam, 1-30
- Orgeta, V. and Phillips, L.H. (2007) Effects of Age and Emotional Intensity on the Recognition of Facial Emotion. Experimental Aging Research, 34, 63-79.
- Burk, D.M. and Mackay, D.G. (1997) Memory, Language, and Aging. Philosophical Transactions of the Royal Society of London, Biological Sciences, 352, 1845-1856.
- Charles, S.T. and Carstensen, L.L. (2010) Social and Emotional Aging. Annual Review of Psychology, 61, 383-409. http://dx.doi.org/10.1146/annurev.psych.093008.100448
- Isaacowitz, D.M., Charles, S.T. and Carstensen, L.L. (2000) Emotion and Cognition. In: Salthouse, T.A., Ed., The Handbook of Aging and Cognition, Lawrence Erlbaum Associates Inc., Mahwah, 593-631.
- Sullivan, S., Ruffman, T. and Hutton, S.B. (2007) Age Differences in Emotion Recognition Skills and the Visual Scanning of Emotion Faces. The Journals of Gerontology Series B: Psychological Sciences and Social Sciences, 62, P53-P60.
- Orgeta, V. and Phillips, L.H. (2008) Effects of Age and Emotional Intensity on the Recognition of Facial Emotion. Experimental Aging Research, 34, 63-79. http://dx.doi.org/10.1080/03610730701762047
-
Moreno, C., Borod, J.C., Welkowitz, J. and Alpert, M. (1993) The Perception of Facial
Emotion across the Adult Life-Span. Developmental Neuropsychology, 9, 305-314.
http://dx.doi.org/10.1080/87565649309540559 - Malatesta, C.Z., Izard, C., Culver, C. and Nicolich, M. (1987) Emotion Communication Skills in Young, Middle-Aged, and Older Women. Psychology and Aging, 2, 193-203. http://dx.doi.org/10.1037/0882-7974.2.2.193
- Calder, A.J., Keane, J., Manly, T., Sprengelmeyer, R., Scott, S., Nimmo-Smith, I. and Young, A.W. (2003) Facialexpression Recognition across the Adult Life Span. Neuropsychologia, 41, 195-202. http://dx.doi.org/10.1016/S0028-3932(02)00149-5
- Lambrecht, L., Kreifelts,
B. and Wildgruber, D. (2012) Age-Related Decrease in Recognition of Emotional Facial
and Prosodic Expressions. Emotion, 12, 529-539.
http://dx.doi.org/10.1037/a0026827 - Raz, N., Rodrigue, K.M. and Haacke, E.M. (2007) Brain Aging and Its Modifiers: Insights from in Vivo Neuromorphometry and Susceptibility Weighted Imaging. Annals of the New York Academy of Sciences, 1097, 84-93. http://dx.doi.org/10.1196/annals.1379.018
- Raz, N. (2000) Aging of the Brain and Its Impact on Cognitive Performance: Integration of Structural and Functional Findings. In: Salthouse, T.A., Ed., The Handbook of Aging and Cognition, Lawrence Erlbaum Associates Inc., Mahwah, 1-90.
- Schneider, B.A. and Pichora-Fuller, M.K. (2000) Implications of Perceptual Deterioration for Cognitive Aging Research. In: Salthouse, T.A., Ed., The Handbook of Aging and Cognition, Lawrence Erlbaum Associates Inc., Mahwah.
- Phillips, L.H., MacLean, R.D. and Allen, R. (2002) Age and the Understanding of Emotions: Neuropsychological and Sociocognitive Perspectives. Journals of Gerontology Series B Psychological Sciences, 57, 526-530. http://dx.doi.org/10.1093/geronb/57.6.P526
- Mienaltowski, A., Johnson, E.R., Wittman, R., Wilson, A.T., Sturycz, C. and Farley, N.J. (2013) The Visual Discrimination of Negative Facial Expressions by Younger and Older Adults. Vision Research, 81, 12-17. http://dx.doi.org/10.1016/j.visres.2013.01.006
-
Fairbairn, C.E., Sayette, M.A., Levine, J.M., Cohn, J.F. and Creswell, K.G. (2013)
The Effects of Alcohol on the Emotional Displays of Whites in Interracial Groups.
Emotion, 13, 468-477.
http://dx.doi.org/10.1037/a0030934 - Yu, S.H., Zhu, J.P., Xu, Y., Zheng, L.L., Chai, H., He, W., Liu, W.B., Li, H.C. and Wang, W. (2012) Processing Environmental Stimuli in Paranoid Schizophrenia: Recognizing Facial Emotions and Performing Executive Functions. Biomedical and Environmental Sciences, 25, 697-705.
- Granato, P., Vinekar, S., Van Gansberghe, J.P. and Bruyer,
R. (2012) Evidence of Impaired Facial Emotion Recognition in Mild Alzheimer’s Disease:
A Mathematical Approach and Application. Open Journal of Psychiatry, 2, 171-186.
http://dx.doi.org/10.4236/ojpsych.2012.23023 - Hamm, J., Kohler, C.G., Gur, R.C. and Vermaa, R. (2011) Automated Facial Action Coding System for Dynamic Analysis of Facial Expressions in Neuropsychiatric Disorders. Journal of Neuroscience Methods, 200, 237-256. http://dx.doi.org/10.1016/j.jneumeth.2011.06.023
- Granato, P. and Bruyer, R. (2002) Measurement of Facially Expressed Emotions by a Computerized Study: Method of Study and Analysis of Integration of Emotions (MARIE). European Psychiatry, 17, 339-348. http://dx.doi.org/10.1016/S0924-9338(02)00684-3
- Bruyer, R. and Granato, P. (1999) Categorical Effects in the Perception of Facial Expressions: M.A.R.I.E. a Simple and Discriminating Clinical Tool. European Review of Applied Psychology, 49, 3-10.
- Poirier, F.J. and Faubert, J. (2012) Optimal
Faces for Gender and Expression: A New Technique for Measuring Dynamic Templates
Used in Face Perception. Journal of Vision, 12, 28.
http://dx.doi.org/10.1167/12.6.28 - Pontieri, F.E., Assogna, F., Stefani, A., Pierantozzi, M., Meco, G., Benincasa, D., ... and Spalletta, G. (2012) Sad and Happy Facial Emotion Recognition Impairment in Progressive Supranuclear Palsy in Comparison with Parkinson’s Disease. Parkinsonism & Related Disorders, 18, 871-875.
- Sze, J.A., Goodkind, M.S., Gyurak, A. and Levenson, R.W. (2012) Aging and Emotion Recognition: Not Just a Losing Matter. Psychology and Aging, 27, 940-950. http://dx.doi.org/10.1037/a0029367
- Granato, P. (2007) La perception visuelle des émotions faciales caractéristiques de la population générale et pertur-bations liées à la schizophrénie et à la maladie d’Alzheimer. Thesis, University Lille, Lille.
- Ekman, P. and Friesen, W.V. (1976) Pictures of Facial Affect. Consulting Psychologists Press, Palo Alto, CA.
- Sheehan, D.V., Lecrubier, Y., Sheehan, K.H., Amorim, P., Janavs, J., Weiller, E., Hergueta, T., Baker, R. and Dunbar, G.C. (1998) The Mini-International Neuropsychiatric Interview (M.I.N.I.): The Development and Validation of a Structured Diagnostic Psychiatric Interview for DSM-IV and ICD-10. Journal of Clinical Psychiatry, 59, 22-33.
- Hamilton, M. (1960) A Rating Scale for Depression. Journal of Neurology, Neurosurgery, and Psychiatry, 23, 56-62. http://dx.doi.org/10.1136/jnnp.23.1.56
- Pichot, P., Pull, C.B., Von Frenckell, R. and Pull, M.C. (1981) Une analyse factorielle de l'échelle d'appréciation de l'anxiété de Hamilton. Psychiatria Fennica, International Edition, 183-189.
- Marcos, T. and Salamero, M. (1990) Factor Study of the Hamilton
Rating Scale for Depression and the Bech Melancholia Scale. Acta Psychiatrica Scandinavica,
82, 178-181.
http://dx.doi.org/10.1111/j.1600-0447.1990.tb01378.x - Folstein, M.F., Folstein, S.E. and McHugh, P.R. (1975) “Mini-Mental Status”: A Practical Method for Grading the Cognitive State of Patients for the Clinician. Journal of Psychiatric Research, 12, 189-198. http://dx.doi.org/10.1016/0022-3956(75)90026-6
- Mattis, S. (1976) Mental Status Examination for Organic Mental Syndrome in Elderly Patients. Grune et Stratton, New York.
- Buschke, A. (1984) Cued Recall in Amnesia. Journal of Clinical Neuropsychology, 6, 433-440. http://dx.doi.org/10.1080/01688638408401233
- Pasupathi, M. (1999) Age Differences in Response to Conformity Pressure for Emotional and Nonemotional Material. Psychology and Aging, 14, 170-174. http://dx.doi.org/10.1037/0882-7974.14.1.170
- West, J.T., Horning, S.M., Klebe, K.J., Foster, S.M., Cornwell, R.E., Perrett, D., Burt, D.M. and Davis, H.P. (2012) Age Effects on Emotion Recognition in Facial Displays: From 20 to 89 Years of Age. Experimental Aging Research, 38, 146-168. http://dx.doi.org/10.1080/0361073X.2012.659997
- Svard, J., Wiens, S. and
Fischer, H. (2012) Superior Recognition Performance for Happy Masked and Unmasked
Faces in both Younger and Older Adults. Frontiers in Psychology, 3, 520.
http://dx.doi.org/10.3389/fpsyg.2012.00520
NOTES

*Corresponding author.
#Unfortunately, JPVG died in May 2006.