Paper Menu >>
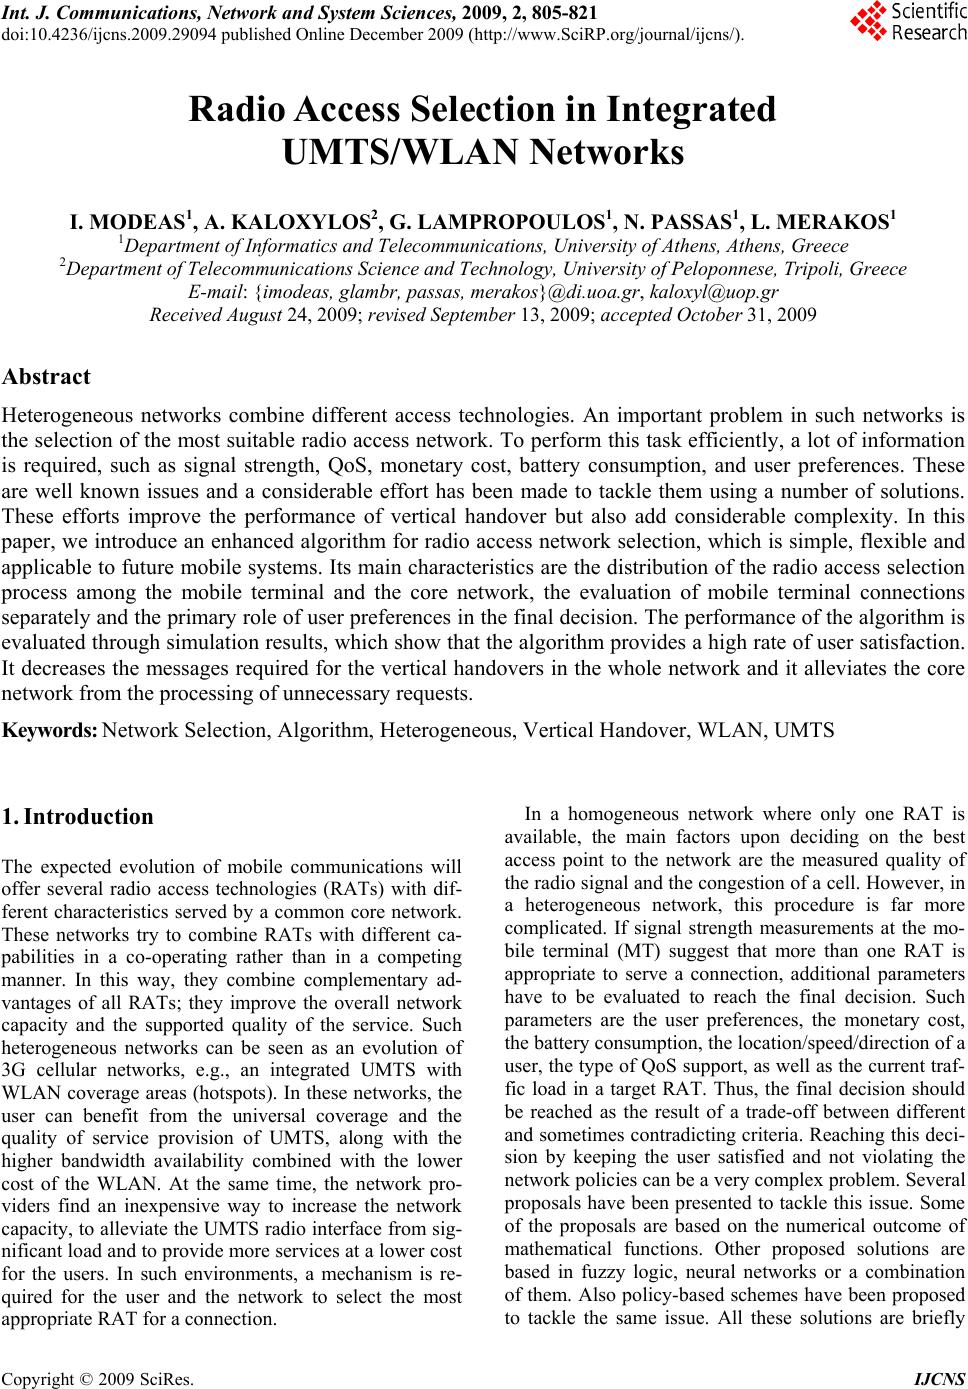
Journal Menu >>
 Int. J. Communications, Network and System Sciences, 2009, 2, 805-821 doi:10.4236/ijcns.2009.29094 published Online December 2009 (http://www.SciRP.org/journal/ijcns/). Copyright © 2009 SciRes. IJCNS 805 Radio Access Selection in Integrated UMTS/WLAN Networks I. MODEAS1, A. KALOXYLOS2, G. LAMPROPOULOS1, N. PASSAS1, L. MERAKOS1 1Department of Informatics and Telecommunications, University of Athens, Athens, Greece 2Department of Telecommunications Science and Technology, University of Peloponnese, Tripoli, Greece E-mail: {imodeas, glambr, passas, merakos}@di.uoa.gr, kaloxyl@uop.gr Received August 24, 2009; revised September 13, 2009; accepted October 31, 2009 Abstract Heterogeneous networks combine different access technologies. An important problem in such networks is the selection of the most suitable radio access network. To perform this task efficiently, a lot of information is required, such as signal strength, QoS, monetary cost, battery consumption, and user preferences. These are well known issues and a considerable effort has been made to tackle them using a number of solutions. These efforts improve the performance of vertical handover but also add considerable complexity. In this paper, we introduce an enhanced algorithm for radio access network selection, which is simple, flexible and applicable to future mobile systems. Its main characteristics are the distribution of the radio access selection process among the mobile terminal and the core network, the evaluation of mobile terminal connections separately and the primary role of user preferences in the final decision. The performance of the algorithm is evaluated through simulation results, which show that the algorithm provides a high rate of user satisfaction. It decreases the messages required for the vertical handovers in the whole network and it alleviates the core network from the processing of unnecessary requests. Keywords: Network Selection, Algorithm, Heterogeneous, Vertical Handover, WLAN, UMTS 1. Introduction The expected evolution of mobile communications will offer several radio access technologies (RATs) with dif- ferent characteristics served by a common core network. These networks try to combine RATs with different ca- pabilities in a co-operating rather than in a competing manner. In this way, they combine complementary ad- vantages of all RATs; they improve the overall network capacity and the supported quality of the service. Such heterogeneous networks can be seen as an evolution of 3G cellular networks, e.g., an integrated UMTS with WLAN coverage areas (hotspots). In these networks, the user can benefit from the universal coverage and the quality of service provision of UMTS, along with the higher bandwidth availability combined with the lower cost of the WLAN. At the same time, the network pro- viders find an inexpensive way to increase the network capacity, to alleviate the UMTS radio interface from sig- nificant load and to provide more services at a lower cost for the users. In such environments, a mechanism is re- quired for the user and the network to select the most appropriate RAT for a connection. In a homogeneous network where only one RAT is available, the main factors upon deciding on the best access point to the network are the measured quality of the radio signal and the congestion of a cell. However, in a heterogeneous network, this procedure is far more complicated. If signal strength measurements at the mo- bile terminal (MT) suggest that more than one RAT is appropriate to serve a connection, additional parameters have to be evaluated to reach the final decision. Such parameters are the user preferences, the monetary cost, the battery consumption, the location/speed/direction of a user, the type of QoS support, as well as the current traf- fic load in a target RAT. Thus, the final decision should be reached as the result of a trade-off between different and sometimes contradicting criteria. Reaching this deci- sion by keeping the user satisfied and not violating the network policies can be a very complex problem. Several proposals have been presented to tackle this issue. Some of the proposals are based on the numerical outcome of mathematical functions. Other proposed solutions are based in fuzzy logic, neural networks or a combination of them. Also policy-based schemes have been proposed to tackle the same issue. All these solutions are briefly 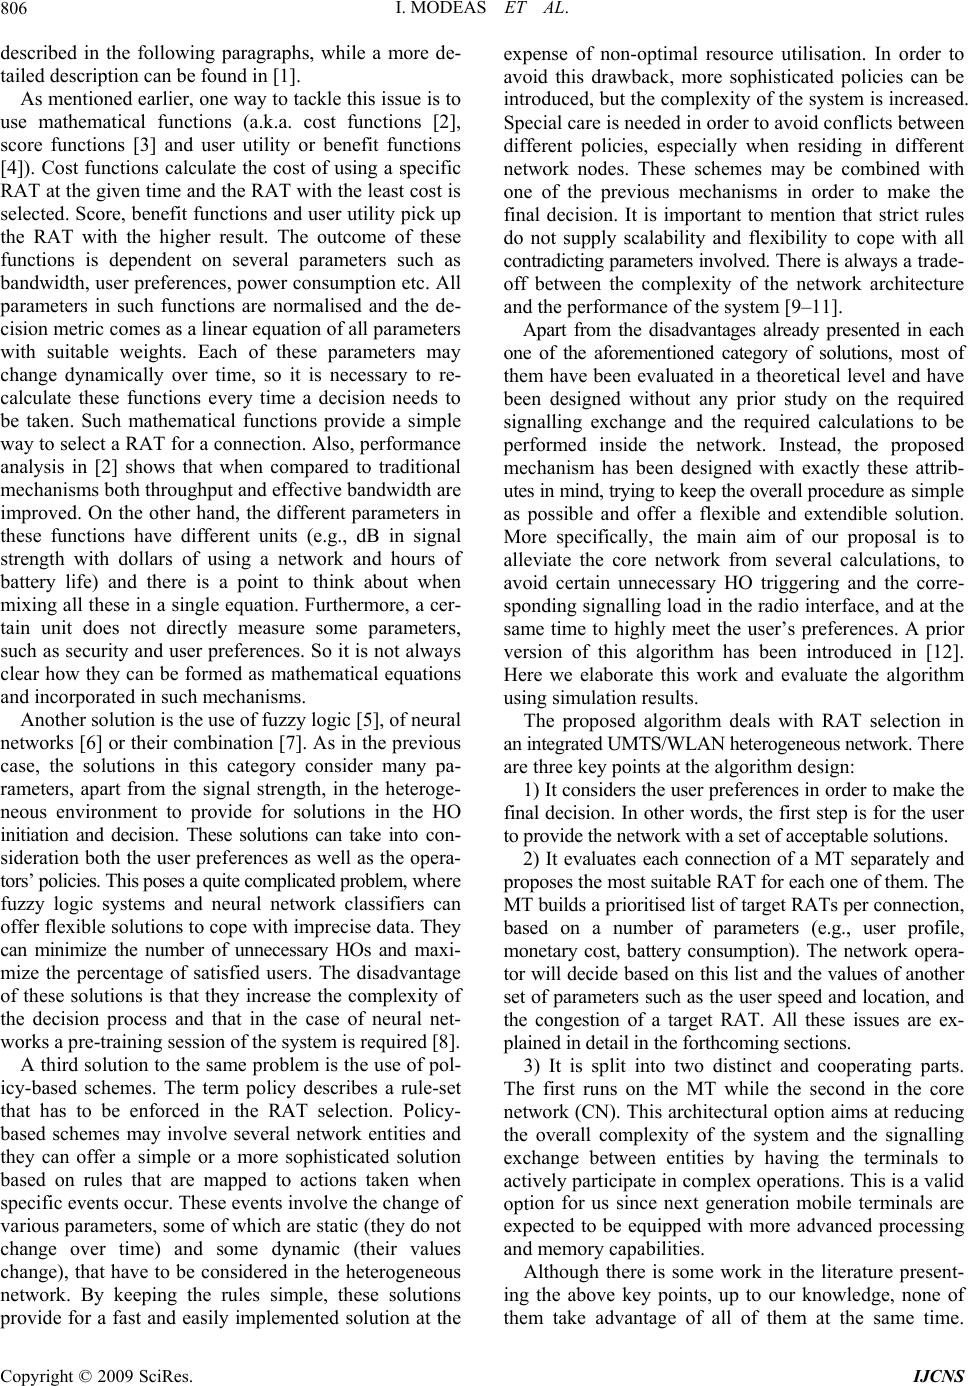 I. MODEAS ET AL. 806 described in the following paragraphs, while a more de- tailed description can be found in [1]. As mentioned earlier, one way to tackle this issue is to use mathematical functions (a.k.a. cost functions [2], score functions [3] and user utility or benefit functions [4]). Cost functions calculate the cost of using a specific RAT at the given time and the RAT with the least cost is selected. Score, benefit functions and user utility pick up the RAT with the higher result. The outcome of these functions is dependent on several parameters such as bandwidth, user preferences, power consumption etc. All parameters in such functions are normalised and the de- cision metric comes as a linear equation of all parameters with suitable weights. Each of these parameters may change dynamically over time, so it is necessary to re- calculate these functions every time a decision needs to be taken. Such mathematical functions provide a simple way to select a RAT for a connection. Also, performance analysis in [2] shows that when compared to traditional mechanisms both throughput and effective bandwidth are improved. On the other hand, the different parameters in these functions have different units (e.g., dB in signal strength with dollars of using a network and hours of battery life) and there is a point to think about when mixing all these in a single equation. Furthermore, a cer- tain unit does not directly measure some parameters, such as security and user preferences. So it is not always clear how they can be formed as mathematical equations and incorporated in such mechanisms. Another solution is the use of fuzzy logic [5], of neural networks [6] or their combination [7]. As in the previous case, the solutions in this category consider many pa- rameters, apart from the signal strength, in the heteroge- neous environment to provide for solutions in the HO initiation and decision. These solutions can take into con- sideration both the user preferences as well as the opera- tors’ policies. This poses a quite complicated problem, where fuzzy logic systems and neural network classifiers can offer flexible solutions to cope with imprecise data. They can minimize the number of unnecessary HOs and maxi- mize the percentage of satisfied users. The disadvantage of these solutions is that they increase the complexity of the decision process and that in the case of neural net- works a pre-training session of the system is required [8]. A third solution to the same problem is the use of pol- icy-based schemes. The term policy describes a rule-set that has to be enforced in the RAT selection. Policy- based schemes may involve several network entities and they can offer a simple or a more sophisticated solution based on rules that are mapped to actions taken when specific events occur. These events involve the change of various parameters, some of which are static (they do not change over time) and some dynamic (their values change), that have to be considered in the heterogeneous network. By keeping the rules simple, these solutions provide for a fast and easily implemented solution at the expense of non-optimal resource utilisation. In order to avoid this drawback, more sophisticated policies can be introduced, but the complexity of the system is increased. Special care is needed in order to avoid conflicts between different policies, especially when residing in different network nodes. These schemes may be combined with one of the previous mechanisms in order to make the final decision. It is important to mention that strict rules do not supply scalability and flexibility to cope with all contradicting parameters involved. There is always a trade- off between the complexity of the network architecture and the performance of the system [9–11]. Apart from the disadvantages already presented in each one of the aforementioned category of solutions, most of them have been evaluated in a theoretical level and have been designed without any prior study on the required signalling exchange and the required calculations to be performed inside the network. Instead, the proposed mechanism has been designed with exactly these attrib- utes in mind, trying to keep the overall procedure as simple as possible and offer a flexible and extendible solution. More specifically, the main aim of our proposal is to alleviate the core network from several calculations, to avoid certain unnecessary HO triggering and the corre- sponding signalling load in the radio interface, and at the same time to highly meet the user’s preferences. A prior version of this algorithm has been introduced in [12]. Here we elaborate this work and evaluate the algorithm using simulation results. The proposed algorithm deals with RAT selection in an integrated UMTS/WLAN heterogeneous network. There are three key points at the algorithm design: 1) It considers the user preferences in order to make the final decision. In other words, the first step is for the user to provide the network with a set of acceptable solutions. 2) It evaluates each connection of a MT separately and proposes the most suitable RAT for each one of them. The MT builds a prioritised list of target RATs per connection, based on a number of parameters (e.g., user profile, monetary cost, battery consumption). The network opera- tor will decide based on this list and the values of another set of parameters such as the user speed and location, and the congestion of a target RAT. All these issues are ex- plained in detail in the forthcoming sections. 3) It is split into two distinct and cooperating parts. The first runs on the MT while the second in the core network (CN). This architectural option aims at reducing the overall complexity of the system and the signalling exchange between entities by having the terminals to actively participate in complex operations. This is a valid option for us since next generation mobile terminals are expected to be equipped with more advanced processing and memory capabilities. Although there is some work in the literature present- ing the above key points, up to our knowledge, none of them take advantage of all of them at the same time. Copyright © 2009 SciRes. IJCNS  I. MODEASET AL.807 Furthermore, there is no evaluation on the user satisfac- tion and the signalling load alleviation. The simulation results presented at the end of the paper justify the afore- mentioned design points. When compared with other pro- posal the key difference of our mechanism is that its main focus is not on a pure load-balanced system but rather on how to satisfy the preferences of the users. The remainder of the paper is organised as follows. Section 2 elaborates the MT and network parts of the algorithm. Next, Section 3 presents a quantitative evalua- tion of the algorithm in an integrated UMTS/WLAN environment, through simulations. Finally, conclusions and future work are described in Section 4. 2. RAT Selection Algorithms The algorithm involves several parameters in the decision process. Also, some assumptions were made for its design and functionality. Furthermore, as already mentioned, the proposed algorithm is the combination of two sub-algo- rithms: the one running at the MT and the second one at the CN. All these are described in the following subsections. 2.1. Assumptions and Parameters of the Algorithm In the proposed algorithm, we assume that the MTs are multimode, i.e., they have multiple radio interfaces in order to support a number of connections via more than one RAT at the same time [13]. We focus on the problem of selecting the most suitable access network: 1) when a new call is to be initiated; 2) when a new alternative RAT becomes reachable by a MT having active connec- tions (i.e., a vertical HO is imminent). The first case is simpler, since it only requires making the decision if the new call will be accepted and which of the available RATs will support it. In the second case, it is important to re-evaluate all active connections, given that another alternative RAT is now available. Since several parame- ters need to be taken into consideration, this task needs some time before reaching a decision. This processing time cannot be avoided, if sensible HO decisions are required (e.g., handing over a connection to a WLAN hotspot of a radius of 100 meters is not sensible for users moving with their vehicles in a speed of 80 Km/h since the connection will be handed over again to another cell and/or RAT in around 9 seconds). When establishing a new connection or deciding a vertical HO, the algorithm evaluates the following five parameters: 1) The specific service requirements (i.e., service pro- file): Each service, even if it is adaptive to the bandwidth and QoS offered by each RAT, has always some mini- mum requirements from the radio connection in order to be successfully supported. 2) The MT specifications and capabilities (i.e., MT profile): Each MT may have a different set of radio in- terfaces, each one of them having particular requirements regarding the battery consumption, the CPU power, the available memory etc. Also, the battery duration and consumption are not constant and they depend heavily on the type and the number of connections and RATs that are active [14]. 3) User’s profile: The typical user is interested in nei- ther the network technologies available nor the underly- ing difficulties to support seamless mobility. The user simply wants to get services easily, in a standard quality and at the least price possible. So, the user should be able to easily specify criteria in prioritised way, e.g. least cost, battery duration, QoS. This could be done via a graphical user interface on the MT, where the user could specify these criteria. Thus, a prioritisation of the alternative RATs based on user’s preferences is feasible and can be part of the user’s profile. 4) Network operator policies: The network operator wants to control the load of the proposed attachment points from the MT and also maximise if possible, the revenues. Though, it may be necessary to decide based on how to load balance the traffic between the different RATs, while at the same time taking into account the subscriber’s preferences. 5) The MT location, speed and direction information: This is very important information, the knowledge of which may avoid the execution of unnecessary hand- overs. This could be the case of a fast moving user ap- proaching a WLAN access point. There is no point in accepting this user to this WLAN, since in a few seconds he/she will be out of this coverage area. All the above make quite clear that the selection of the radio interface to support a new call or a HO has to be based on several preferences and requirements, some of them conflicting with others. For example a user may prefer to pay the lowest price without sacrificing the quality of the received service, even in a congested net- work. So, this selection is mainly a trade-off between the user preferences and the operator’s ones. The algorithm proposed here is split in two cooperat- ing parts. The first one runs in the MT while the second one in the core network. This approach has the advantage of easing the core network load on measurements and calculations for each HO case while minimizing the sig- nalling exchange between terminals and network com- ponents. Thus, it leads to better utilisation of the precious resources at the radio interface. It looks like a mobile assisted handover case taken one step further, since the MT plays a more active and crucial role since it produces the set of acceptable RATs for each of its connections. Since the tendency in MT hardware characteristics is to be more powerful and having more battery autonomy, this approach does not stretch the MT. In the next two subsections, we present these two cooperating parts of the algorithm. Copyright © 2009 SciRes. IJCNS  I. MODEAS ET AL. Copyright © 2009 SciRes. IJCNS 808 2.2. Algorithm Running in the Mobile Terminal This part of the algorithm aims at prioritising the RATs for each connection separately. Its output is a list of user-preferred RATs for each one of the active connec- tions of a MT. In order to accomplish this, it evaluates the first three of the parameters mentioned in the previ- ous sub-section, i.e., the user, the terminal and the ser- vice profiles. The remaining two parameters are taken into account to the part of the algorithm running in the core network. The algorithm running in the MT is shown in Figure 1. The whole procedure is initiated when one of the three following triggers occurs: 1) The MT detects a new alternative RAT with ade- quate signal strength/quality. 2) A new call is initiated from the MT user. 3) An “urgent” HO (regarding the time constraints) is imminent as a result of degradation of the radio link. The algorithm treats the first two cases in the same way, since its main goal here is to create a prioritised list of the available RATs, based on the aforementioned pa- rameters. A very important aspect affecting the RAT selection is when the various measurements are per- formed. These measurements may indicate the radio link degradation or the discovery of an alternative RAT. These are periodic measurements and very important to the whole procedure, but they are out of the scope of this paper. The first possible trigger that is able to initiate the al- gorithm concerns the discovery of an additional alterna- tive RAT in the vicinity of the MT, while the MT has active connections. This is described in the right part of Figure 1. If RSS measurements indicate that this new RAT has adequate signal strength, then the MT will cre- ate a list with the priorities of each RAT for each specific connection. If N is the number of active connections and M the number of available RATs, then this priority list takes the form of a two-dimensional matrix NxM, named pr_list in Figure 1. Then the MT reads the user profile and according to the user’s preferences it constructs this matrix by giving a value to each cell (i, j) representing the priority of the j-th RAT for the i-th connection. The next step is to collect and average the values of all downlink (DL) measurements and evaluate them. The evaluation results may adjudicate that a certain RAT cannot fulfil the constraints that a specific type of service poses (stored in the service profile), such as bit-error rate and jitter. In such a case, this RAT will be eliminated from the priority list, by putting the value of zero in the specific cell of the pr_list. After the RAT elimination Start New call initiation N = number of active connections M = number of available RATs Get info from user profile and create pr_list[N,M] Modify priorities based on previous calculations and on user profile. End DL RSS measurements on all available RATs Sort pr_list[N,M]. MT active AND RSS in an active RAT below threshold MT active AND new RAT detection RAT elimination from pr_list[N,M] based on RSS measurements Stop RSS measurements. Average and evaluate results. Wait until conn ect ion dropped or RSS restored. Send HO request to CN Search the set to find the RAT to minimise HO latency. Perform the "fastest" HO ac ceptabl e to the user. RAT acceptable to user OR set empty Remove RAT from the set. Create the set of appropriate RATs set emp ty? nono yesyesnono yes yes Calculate battery, CPU, memory etc. consumption. Send new call or HO request with pr_list[N,M] to CN Figure 1. Algorithm running in the mobile terminal.  I. MODEASET AL.809 phase, the algorithm estimates all factors reflecting the cost of each candidate RAT selection to the MT’s char- acteristics, i.e. the battery consumption, the CPU and mem- ory requirements, etc. This evaluation takes place after the RAT elimination step, in order to avoid evaluations of a RAT that will be rejected. This estimation has to be combined with the user preferences. This means that ac- cording to the importance that each one of these factors has for the particular user, the algorithm treats it in a different way. The importance is indicated in the user pro- file stored in the MT. Thus, the pr_list is modified again. The final step of this part of the algorithm is to sort the matrix per connection, in descending order as far as priori- ties are concerned, starting from the one better satisfying the user. This puts pr_list in its final format and it is the final priority list sent to the CN. There, the corresponding part of the algorithm is executed, having as input this pri- oritised list, as described in the following sub-section. In order to clarify how this part of the algorithm works, let us consider an example and follow each step of the algorithm. We consider a MT being able to simultane- ously communicate via UMTS and WLAN. At a given time, it has three active connections, thus M=3. Also, it can communicate via either UMTS or two alternative WLANs, i.e. N=3. In this case, the information stored in the user profile is used to build the initial priority list, such as the one shown in Table 1. For connection 1, UMTS has the highest priority, whereas WLAN1 the lowest. For connection 2, WLAN2 is set to zero, indicat- ing that this type of access network is not acceptable to the user for the specific service, for a reason such as monetary cost or QoS offered. The next step in the algo- rithm is the evaluation of radio signal measurements. Let us suppose that UMTS does not fulfil the service re- quirements of connection 1. So, it is eliminated from the list, as shown in Table 2. The next step is the evaluation of additional parameters, such as battery duration. In our example, the user wants to maximise the duration of the battery as long as possible. A simple solution could be to support all connections by WLAN1, since it is the only RAT adequate for all three connections. This means that the list will be modified, by finding the RAT with the maximum priority for each connection and add it to the corresponding priority of WLAN1. Table 3 shows the result of this step, where WLAN1 has the highest priority for all connections. The sorting of the list is the last step of this part of the algorithm. This is shown in Table 4, for our example. So, for connection 1 there are two al- ternative RATs, with WLAN1 having the highest priority. Connection 2 has again two RATs, while connection 3 has three. This is the final priority list sent to the CN. The second possible trigger to start the algorithm run- ning at the MT is a new call initiation. In this case the algo- rithm has to prioritise all RATs from the one providing best support for this specific connection type, to the one providing the worst, but still with adequate QoS. This Table 1. Priority list from user profile. UMTS WLAN1 WLAN2 Con. 1 3 1 2 Con. 2 1 2 0 Con. 3 2 1 3 Table 2. Priority list after RAT elimination. UMTS WLAN1 WLAN2 Con. 1 0 1 2 Con. 2 1 2 0 Con. 3 2 1 3 Table 3. Priority list (extra evaluation). UMTS WLAN1 WLAN2 Con. 1 0 3 2 Con. 2 1 4 0 Con. 3 2 4 3 Table 4. Final priority list (pr_list). Con. 1 WLAN1 WLAN2 - Con. 2 WLAN1 UMTS - Con. 3 WLAN1 WLAN2 UMTS trigger is handled in the same way as the first one, de- scribed in the previous paragraphs. The difference is that in this case, the prioritisation has to be done only for one connection. So, in this case, i.e. a new call, if N is the number of the active connections of the involved MT, then N=1. Finally, the third trigger to initiate this part of the al- gorithm is an “urgent” HO case. The MT has at least one active connection and the radio signal strength measure- ments indicate that one link deteriorates under some specified threshold. This is an urgent HO case, where the HO latency becomes the most critical factor. Thus, no evaluation of the different parameters is performed, since this, along with the signalling introduced, increase the time required for HO completion. In this case, the HO type providing the least latency is chosen, if only it is acceptable to the user. This can be checked with the user profile. This is shown in the left part of Figure 1. When the MT realises that an “urgent” HO is imminent, it cre- ates a set of all alternative RATs that can adequately support the particular connection. Then, it identifies within this set the RAT minimising the HO latency. This choice is dependant to the available RATs and the archi- tecture of the heterogeneous network (such as loose or tight coupling). Then, the MT checks if the chosen RAT is acceptable according to the user preferences. If it is, a HO request message is send to the CN to execute a HO to this particular RAT. In a different situation the algo- rithm continues with the next RAT, until either one RAT acceptable to the user is found or there are no more RATs in the set. In the latter case, no HO is performed and the connection may be either terminated or nor- mally continued in case that the RSS is restored back to acceptable levels. Copyright © 2009 SciRes. IJCNS  I. MODEAS ET AL. 810 2.3. Algorithm Running in the Core Network This part of the algorithm starts when it receives the output from the corresponding part running at the MT. The CN takes the final decision, based on the last two parameters mentioned in subsection 2.1 and on the out- come of the algorithm at the MT. Thus, it is based on policies determined by the operator and on velocity, lo- cation and position of the MT. Uplink radio channel measurements indicating the quality of the uplink bearer are also taken into consideration as in any HO case. RAT specific parameters, such as the channel and/or UMTS Orthogonal Variable Spreading Factor (OVSF) codes availability play a role as well [15]. Some parameters change dynamically, so the core network has to acquire updated information either periodically, or after certain stimulus and message exchanging. This information gath- ering and/or message exchanging is an important issue, but out of the scope of this paper (a discussion on this issue can be found in [12]). This part of the algorithm is shown in Figure 2 and it is executed either when a new call is going to be estab- lished or when there is a request for a HO from the MT. In a new call initiation, this algorithm is part of the call admission control procedure that is responsible for the load control in the entire heterogeneous network. In a HO request, the HO can be either “urgent”, i.e., due to radio signal strength degradation, or initiated to better support the existing connections. Our focus is on the latter case, where a vertical HO is initiated to improve the satisfaction of user preferences, and is the result of changes in the number of RATs that the MT can reliably communicate with. Both HO types are indicated by a HO request message from the MT to the CN. First, we consider the case of the “urgent” HO. This is shown in the right part of Figure 2 and it corresponds to the third and last trigger of the part of the algorithm at the MT, as described in the previous subsection. There, the out- come was a HO request message from the MT to the CN. This request indicates a HO due to radio link degradation along with the target RAT decided at the MT algorithm. This decision was based on the architecture of the hetero- geneous network. Then, the CN reserves the appropriate resources and informs the MT about the HO execution. In the case of a HO request due to a new RAT detec- tion from the MT or a new call initiation, the time con- straints are not as tight as in the “urgent” HO case. start end HO or new call request from MT with pr_list[N,M] i<= N i=1 no no result yes yes j++ 'denied' 'denied' Save positive HO response for connection i and RAT j. 'allowed' 'allowed' Get RAT info HO_request from MT indicating a "urgent" HO. Enough time to consider user preferences, network load, MT's speed, ... HO due to RSS measurements It has to be completed quickly. Check next alternative RAT for the same connection j=1 i++ j<= M no no yesyes Check next connection 1 2 1 2 Confirm the HO to MT Reserve resources in the CN HO execution (reserve radio resources, switch traffic to new path) Send HO response list to MT (yes/no for all connections) Loop for alternative RATs Loop for all connections Save negative HO response for con- nection i and RAT j i++ Check next connection 1 Stop measurements. Reserve resources in the CN. Instruct RAN / MT to start measurements for speed & location evaluation Case target RAT of: UMTS: call evalUMTS(result) WLAN: call evalWLAN(result) N : number of connections M : number of alternative RATs j: local integer variables Figure 2. Algorithm running in the core network. Copyright © 2009 SciRes. IJCNS  I. MODEASET AL.811 start Get load of target cell Connec tion allowed? result = 'allowed'result = 'denied' no no yesyes end UMTS admission control (load, SIR, soft capacity, codes availability, ...) start AP congested? result = 'allowed'result = 'denied' yes yes Positive evaluation Speed, location, direction data evaluation no no no no yesyes end Evaluate load of target AP Get measurements report (a) Procedure evalUMTS (b) Procedure evalWLAN Figure 3. High level evaluation procedures. This case is shown in the left part of Figure 2. There is enough time to evaluate network condition (e.g. conges- tion) and user’s speed, location etc. First of all, the CN receives the HO request message including the RAT pri- ority list, which was the outcome of the part of the algo- rithm in the MT. As described in the previous subsection, this priority list can be seen as a two-dimensional matrix NxM, where N is the number of the active connections of a MT and M the number of alternative RATs. In the case of a new call initiation N=1 and in the one of a HO re- quest N≥1. Nevertheless, both cases are treated the same way by this part of the algorithm. Then, the CN gets all information related to the HO for all the involved RATs, such as the coverage area, the location of the access points (APs) and base stations the MT communicates with. The next step is the initialisation of the procedures to support the MT’s velocity and location estimation. These are important in a heterogeneous network, since they influence an inter-RAT HO decision. This is due to the fact that in some cases there may be no point for an in- ter-RAT HO, because of high speed, direction of move- ment, location of the MT or small coverage areas of a certain RAT. Thus, in these circumstances the MT will reside in the RAT coverage for a very short time, and then another HO, “urgent” this time will be required. So, some specific thresholds and rules have to be defined. These could have the form of simple rules such as “if velocity greater than z m/sec” or “the MT’s distance from the AP is greater the x% of the cell’s radius and it is moving away from it with velocity at least y m/sec” etc. Thus, it is clear that this kind of information will help the CN make a better decision and avoid useless HOs and thus reducing the total amount of signalling. There are several proposals for estimating the velocity of a MT. Some of them are based on estimations of the maximum Doppler frequency [16,17]. In 3GPP some work has been done for estimating the geographical position and op- tionally the velocity of the MT in UMTS, through radio signal measurements [18]. The particular method of ve- locity and location calculation is out of the scope of this paper. This kind of information is evaluated in the CN, since the appropriate data are not available to the MT. The next step is a nested loop. The outer loop is for each one of the active connections and the inner loop for each alternative RAT for a specific connection i (I=1,…,N), where N is the number of active connections and M the number of alternative RATs for each connection. Thus, the algorithm evaluates the request for each connection separately. This evaluation is heavily dependent on the RAT type. As an example we consider UMTS and WLAN as alternative technologies. Figures 3(a) and 3(b) present some high level descriptions of UMTS and WLAN evalua- tion procedures. In Figure 3(a), the CN has the information on the load of the target cell and the usual UMTS call admission control algorithm is executed. If the result is that the new connection can be supported then this procedure returns the result ‘allowed’, else the result ‘denied’. In Figure 3(b), the high level procedure for evaluating a vertical HO to WLAN is shown. The CN has the information on the load of the target AP and if it is congested, the procedure returns the result ‘denied’. Else, since the coverage area of an AP is rather small, the core network has to take into account the velocity, the location and the direction of the Copyright © 2009 SciRes. IJCNS  I. MODEAS ET AL. 812 MT to make a decision. So, it collects all measurement information, evaluates it and then, if the result indicates that the new connection can be supported the procedure returns the result ‘allowed’, else the result ‘denied’. UMTS only UMTS & WLAN q p After the evaluation of all M alternative RATs for each connection, the result of the corresponding proce- dures indicate if the HO will be executed and to which RAT. This is done for each one of the N connections (outer loop in Figure 2). When this is completed, any measurements to support speed and location estimation are stopped and the HO execution phase starts. 1-p 1-q 3. Simulations and Qualitative Analysis 3.1. Model, Assumptions and Parameters of the Simulations In order to evaluate the performance of the proposed algorithm, a simulation model has been created using the Network Simulator-ns-2 [19]. Two alternative RATs are considered in this model. The first one represents the UMTS and it has global coverage, while the second one repre- sents the WLAN and it covers a smaller portion, as shown in Figure 4. The general assumptions for the model used are that the MTs are uniformly distributed in the cover- age area, their movements are not correlated and their direction is uniformly distributed. Also, all MTs are ca- pable of having simultaneous active connections over UMTS and WLAN. Moreover, all MTs have both inter- faces active throughout the whole simulation, so, for sake of simplicity, the battery consumption was not considered. Each MT has a certain residency time in each of the RATs involved and in each one of the coverage areas shown in Figure 4, namely area 1 and area 2. In area 1 there is only UMTS coverage, whereas in area 2 there is both UMTS and WLAN coverage. The residency time is exponentially distributed. In the UMTS network all users have the same residence time, whilst in the WLAN the fast moving users have much lower residence time, due to the smaller coverage area. For each MT the mobility model shown in Figure 5 is used. This is a two state Markov process, representing the movement from the two coverage areas shown in Figure 4. Thus, the MT can be in an area having only UMTS coverage or in an area Figure 4. Assumed coverage area of RATs. Figure 5. Mobility model. of double coverage. When the residence time expires, an- other state is chosen, according to the shown probabili- ties. These probabilities are related to the percentage of the WLAN coverage of the whole area. Only when a user changes coverage area the simulation model triggers a HO. In this way, we consider only the vertical HOs since these are important in our measurements. The new calls arrive in the whole system as a Poisson process with an inter-arrival time that is exponentially dis- tributed and a mean rate of λ calls per hour. Each one of the new connections belongs to a specific service type ac- cording to its requirements on bandwidth, call duration, delay, jitter etc. In the simulations, the four traffic classes of UMTS were considered to classify each new connection [20], but this can be easily adapted to any other classification: 1) TC1: QoS conversational, e.g. voice over IP 2) TC2: QoS streaming, e.g. video/audio streaming 3) TC3: QoS interactive, e.g. www browsing 4) TC4: QoS background, e.g. FTP downloading When a new call enters the system, it is classified as TC1, TC2, TC3 or TC4 according to some respective probabilities p(TC1), p(TC2), p(TC3) or p(TC4), shown in Table 5, so that ∑p(TCi)=1. Furthermore, each traffic class poses different con- straints on the simulation model regarding the bandwidth required and the mean duration of each call μi (i=1,2,3,4). The duration of each call has an exponential distribution with mean value μi (i=1,2,3,4). According to the traffic class that the new connection belongs to, there are the appropriate requirements on the bandwidth. For the simulation model, some typical mean values were con- sidered for the bandwidth, namely BWi (i=1,2,3,4). All these are shown in Table 5. The user profile that describes the preferences of the user for each specific service and network is stored in the MT. Such information is semi-static, and does not change during a simulation run. For sake of simplicity three user profiles have been considered, namely UPi (i=1,2,3). For the simulation model, three initial profiles have been considered: The first one aiming at the low cost of the supported services, the second one at the best quality of the offered services and the third one having the least energy requirements. Here we consider that: area 1 UMTS area 2 WLAN 1) WLAN has a lower cost per time unit or data unit, for all TCs. 2) UMTS has less power requirements in a “mixed” usage scenario, involving many TCs and connections [14]. 3) UMTS offers guaranties for QoS for all TCs. Espe- cially for TC1 and TC2, where time delay and jitter is Copyright © 2009 SciRes. IJCNS  I. MODEASET AL.813 critical, UMTS should be considered as the first choice for QoS provisioning. For TC3 and TC4, where time constraints are not that strict, the higher bandwidth of WLAN makes it a better choice for these two TCs. At the initialisation phase of each simulation run all users are distributed in one of the available user profiles, according to the probabilities shown in Table 5, so that ∑p(UPi)=1. In Table 5 we resume all the parameters that are common in every simulation run. In the following sub- sections, we present several scenarios executed in the simulation environment, in order to evaluate the algo- rithm performance. Firstly we evaluate the behaviour of the algorithm when we increase the new call rate arrival λ and the system becomes overloaded. Secondly, the available bandwidth is altered. As a third step, we in- crease the ratio of fast moving users over the total num- ber of them. Finally, the last evaluation is done by changing the portion of the whole coverage covered by the smaller coverage RAT. All these are explained in detail in the following four subsections respectively. For each one of these four test scenarios, our focus is on three different metrics in order to evaluate the al- gorithm performance: 1) The first metric involves the probabilities for new call blocking P(Cblock), handover blocking P(HOblock) and call dropping P(Cdrop). A new call is blocked when a corresponding request is rejected. This results in a call not being initiated. A handover is blocked when a verti- cal handover request is rejected. This results to an ab- normally terminated existing call. An outgoing call is dropped when an unsuccessful vertical handover occurs. The three probabilities representing the first metric in Table 5. Simulation parameters. Number of MTs 24 Maximum number of active connections per MT 4 p(TC1) 0.40 p(TC2) 0.15 p(TC3) 0.25 p(TC4) 0.20 area 2 residence time (slow users) 100 sec μ1 180 sec μ2 300 sec μ3 900 sec μ4 900 sec BW1 64 kbps BW2 384 kbps BW3 120 kbps BW4 120 kbps p(UP1) 0.50 p(UP2) 0.25 p(UP3) 0.25 our simulations are given by the Equations (1), (2) and (3). r sr block c cc CP )( (1) r sr block h hh HOP )( (2) s sr s d drop c hh c c CP )( (3) where: cr is the number of new call requests in the whole sys- tem during a full simulation run, cs is the number of new call requests that has been successful and resulted in initiated calls, cd is the number of calls that have been started but during the connection they have been dropped due to an unsuccessful vertical HO, hr is the number of vertical HO requests sent from all MTs to the core network, hs is the number of successfully completed vertical HO. 2) The percentage of the new calls that have been ac- cepted in the RAT indicated as the user’s first preference, over the total number of new call requests, namely nc (pref1). The corresponding percentage is measured for the connections that have been vertically handed over to another RAT, namely ho (pref1). These two metrics are used as a guide to evaluate the user’s satisfaction ac- cording to the preferences that each one of them stores in its profile. They are described by the two following Equations (4) and (5): 21 1 )1(ncnc nc prefnc (4) 21 1 )1(hoho ho prefho (5) where: nc1 is the number of new call requests served by the RAT indicated as the first user preference, nc2 is the number of new call requests served by the RAT indicated as the second user preference, ho1 is the number of vertical HO requests served by the RAT indicated as the first user preference, ho2 is the number of vertical HO requests served by the RAT indicated as the second user preference. 3) The number of vertical HO requests messages sent from the MTs to the CN. Also, the number and the per- centage of the vertical HO requests that have been dealt with in the MT, from the corresponding part of the algo- rithm running there. Thus, we try to evaluate the benefits of splitting the algorithm functionality in two parts, in- stead of one, not only as a measure to alleviate the core network from unnecessary processing, but more impor- tantly, to see if we succeed to minimise the signalling load, especially at the radio interface, and if so, to quan- titatively evaluate this. Each simulation run was made for a simulation time of 10 days, so that it reaches a stable state. Then, 10 differ- Copyright © 2009 SciRes. IJCNS  I. MODEAS ET AL. Copyright © 2009 SciRes. IJCNS 814 ent runs with different seed each time were executed and all results from these runs were averaged in order to avoid any non-typical behaviour of the model. In Figure 7 we see the percentage of the new calls and of the HOs that have been served by the RAT indicated in the first user preference. The remaining calls/HOs have been served by the second preference of the user. Here, we observe that as far as the new calls are con- cerned, this percentage is extremely high, about 95%, and it does not significantly drop (less than 2%), even for very high load system cases (λ≥90). For the HO case though, the respective numbers are not that high, about 86%, which is still very high, and remains almost con- stant. The conclusion here it that the algorithm performs very well concerning the satisfaction of the first user preference for new calls and HOs, almost irrespectively of the load posed in the network. It performs very well even in an overloaded system, where the mean call rate leads to high new call blocking probability. 3.2 Modifying New Call Arrival Rate λ In this run all parameters mentioned in the previous subsec- tion are maintain constant as shown in Table 5. The only parameter that changes is the total new call rate produced by the simulation model. This rate λ is measured in new calls per hour for the whole system. Let us see how the three metrics we focus in are influenced by the rate λ. In Figure 6 the new call blocking, the HO blocking and the call dropping probabilities are shown as a func- tion of λ. It is quite obvious that the system becomes overloaded for λ>80, as the new call blocking probability rises highly, for the chosen initial values. What is inter- esting here is to see the two other metrics, the user satis- faction related and the HO requests messages, even in these overloading conditions. The last metric concerns the number of HO requests messages sent from the MTs to the core network and the number and percentage of HO cases dealt with in the MTs, as a function of λ. This is shown in Figures 8(a) and 8(b) 0% 1% 2% 3% 4% 5% 60 6570 75 80 8590 95100 λ (calls/hour) probabilities call blocking HO blocking call dropping Figure 6. Call/HO blocking and call dropping probabilities. 75% 80% 85% 90% 95% 100% 60 6570 7580 85 9095100 λ (calls/hour) 1st user preference satisfied new call HO Figure 7. New calls and HOs served at the 1st user preference RAT.  I. MODEASET AL.815 0 5000 10000 15000 20000 25000 30000 60 6570 7580 85 9095100 λ (calls/hour) requests HO requests HOs stopped in MT 0.10 0.15 0.20 0.25 0.30 6065 707580 8590 95100 λ (calls/hour) HO ratio stopped in MT (a) (b) Figure 8. HO requests messages sent to the CN and stopped in the MT. respectively. As seen in these figures, as λ increases so does the total number of HO requests sent to the core net- work and proportionally the number of HOs dealt with in the MTs (figure 8(a)). Though, it is really interesting that the percentage of HOs that are dealt with by the MTs is quite high and stable, around 19% for all λ values (figure 8(b)). This can be simplified by saying that almost one out of five HO requests along with the relative signalling is avoided in the radio interface, because of the splitting of the algorithm in two co-operative parts. This seems to justify this design choice. The small peak near the centre of Figure 8(b) is negligible (less than 0.5%). 3.3. Modifying the Available Bandwidth In this scenario, we wanted to examine how the proposed algorithm performs regarding the available bandwidth of the RATs involved. In the simulation model, WLAN covers a smaller area and has more resources available. This makes UMTS the more stressed RAT regarding the available re- sources. Thus, for simplicity reasons, we do not alter the bandwidth of the RAT with the more available resources, i.e. WLAN. This is set equal to 11 Mbps. The available band- width for UMTS is changed from 2 up to 2.8 Mbps. Further- more, we keep constant all the parameters shown in Table 5. Considering the first metric which is the blocking prob- abilities, the results are shown in Figure 9. As expected, when the offered bandwidth is increasing, all blocking and dropping probabilities are reduced. What benefits more is the new call blocking probability which is de- creased almost 10 times. Also, we see that for the given model, when the available UMTS bandwidth drops be- low 2.4 Mbps the whole system is highly stressed, given that WLAN bandwidth is constant. Nevertheless, all relevant probabilities drop significantly, when the UMTS available bandwidth supersets 2.4 Mbps. This first met- ric does not reveal anything new for the performance of the algorithm. Considering the second metric, that is the percentage of new calls and HOs accepted in the first user prefer- ence RAT, the results are shown in Figure 10. Here we observe that the vast majority of new calls are served by the RAT indicated as the first user preference. The same applies to the HOs case, even though the percentages are not that high. Also, the more bandwidth UMTS has, the better the first user preference is satisfied. New calls seem to take more advantage of this increase, by increasing about 2%, whereas HOs are nearly constant around 86%. But the general picture is that this metric is not really influenced by the bandwidth available and remains in quite high values, showing the algorithm provides for a great user satisfaction, even when the network is stressed due to lack of resources, i.e. UMTS bandwidth less than 2.4 Mbps, as depicted from the previous metric. Regarding the third metric, the results are shown in Figure 11. In Figure 11(a), we see that the number of HO messages sent to the core network increases about 10% whereas the available bandwidth of UMTS increases 40%. This is due to the fact that by increasing the avail- able bandwidth, more new calls are accepted in the sys- tem, thus, more HOs are performed. On the other hand, the number of the HO messages that have not been sent to the core network, because the corresponding HOs have been dealt with in the MT, is relatively constant, about 19% as shown in Figure 11(b) (with a small fluc- tuation of 0.5%) and does not seem to be really influ- enced by the available bandwidth. This is quite positive if we consider that this percentage is quite important, since it means that about one fifth of the vertical HO requests are not sent to the core network even when the available bandwidth is quite limited and the system overloaded, such as in the case of UMTS having 2 Mbps as shown in Figure 9. That seems another point to justify the splitting of the functionality of the algorithm. 3.4. Modifying the Coverage of Alternative RATs In this scenario, we investigate the algorithm behaviour according to the coverage relation between the two al- ternative RATs. Since UMTS is considered to have global Copyright © 2009 SciRes. IJCNS  I. MODEAS ET AL. Copyright © 2009 SciRes. IJCNS 816 0. 00% 0. 50% 1. 00% 1. 50% 2. 00% 2. 50% 3. 00% 3. 50% 4. 00% 4. 50% 5. 00% 2.0 2.1 2.2 2.3 2.4 2.5 2.6 2.7 2.8 UMTS bandwidth (Mbps) WLAN bandwidth = 11 Mbps call blocking HO blocking call dropping Figure 9. Call/HO blocking and call dropping probabilities. 80% 82% 84% 86% 88% 90% 92% 94% 96% 98% 2.02.12.22.32.42.52.62.72.8 UMTS bandwidth (Mbps) WLAN bandwidth = 11 Mbps 1st user preference satisfied new call HO Figure 10. New calls and HOs served at the 1st user preference RAT. coverage, i.e. 100% of the geographical area, WLAN has a variable one from 5% up to 45% of the whole area. The new call arrival rate λ equals to 80 calls per hour. All other parameters of the simulation model remain as shown in Table 5. In Figure 12 we see the results regarding the first per- formance metric, i.e. the new call blocking, the HO block- ing and the existing call dropping probabilities. The new call blocking probability is decreasing with relation to the increase of the WLAN coverage availability. It drops quite below 2% when WLAN coverage exceeds 20%. The latter means that there are more resources available at a broader geographical region. Thus this is an ex- pected behaviour, since the whole system’s load is con- stant. Another thing we notice is that the HO blocking probability is decreasing as well, but not with such a big slope as the call blocking. This can be explained after analysing the simulation results and is due to: 1) The number of new call requests is almost constant in all simulation runs but the number of the calls not being admitted to the system (blocked calls) is dropping accord- ing to the WLAN coverage. As long as the latter increases the former decreases. According to Equation (3), this means that the numerator is continuously decreasing while the denominator does not significantly change, presenting the result of new call blocking probability of Figure 12. 2) The number of vertical HO requests increases with the increase in WLAN coverage. After an initial big raise, this number keeps on growing but with a smaller rate. On the other hand, the number of the vertical HOs rejected due to the lack of resources is increasing as the WLAN coverage increases, but after 25% it tends to stabilise. According to Equation (4), this means that the nominator is relatively constant while the denominator increases, but with a decreasing rate. This explains why the HO blocking probability is decreasing with a smaller slope than the new call blocking probability. Finally, in Figure 12 again, the probability of an on- going call to be dropped remains quite small (below 1%) and lies in a small interval of 0.5%. Firstly it seems to  I. MODEASET AL.817 0 5000 10000 15000 20000 25000 30000 2.0 2.1 2.2 2.3 2.42.5 2.6 2.7 2.8 UMTS bandwidth (Mbps) WLAN bandwidth = 11 Mbps requests HO requests HO stopped in MT (a) 0.10 0.15 0.20 0.25 0.30 2.0 2.1 2.2 2.3 2.42.5 2.6 2.7 2.8 UMTS bandwidth (Mbps) WLAN bandwidth = 11 Mbps HO stopped in MT (b) Figure 11. HO requests messages sent to the CN and stopped in the MT. augment but then it stabilises. This is explained if we check again with Equation (3) and see some numerical results from the simulations. When the coverage area of WLAN increases, so does the number of vertical HO requests, but with a big rate. This is not true though for the number of blocked HOs. This number is augmenting at the beginning (up to 0.25), due to the limited resources 0.0% 0.5% 1.0% 1.5% 2.0% 2.5% 3.0% 3.5% 0.05 0.10 0.15 0.20 0.250.30 0.35 0.40 0.45 WLAN coverage call blocking HO blocking call dropping Figure 12. Call/HO blocking and call dropping probabilities. of the whole system. When WLAN coverage exceeds a certain point (about 0.25), the available resources in the simulation system are adequate, so that the number of rejected HOs tends to stabilise and then to decrease. If we consider this fact and Equation (3) we can understand the curve of call dropping probability in Figure 12. In Figure 13, the second metric is depicted. We ob- serve that as the coverage of WLAN increases, there is a slight rise in the percentage of new and of handed-over calls served by the RAT indicated as the first user pref- erence. This means that when the area where only UMTS connection is available is decreasing, the same happens to the percentage of the new calls served by the first user preference. At a first thought, this might seem strange. It is explained if we consider Equation (4) and the numeri- cal results from the simulations. The successful new calls entering the system are increasing along with the WLAN coverage. This means that both nc1 and nc2 in Equation (4) rise, but the denominator does so with a higher rate, as it is the sum of nc1 and nc2. In any case, the difference is not significant and lies in all cases below 3%. As far as the third metric is concerned, we see the re- sults in Figure 14. As the WLAN is available in a broader geographical region, the HO requests for a ver- tical HO are increased. This is very logical, since the probability p in the mobility model in Figure 5 increases 80% 82% 84% 86% 88% 90% 92% 94% 96% 98% 100% 0.05 0.10 0.15 0.20 0.25 0.30 0.35 0.40 0.45 WLAN coverage 1st user preference satisfied new call HO Figure 13. New calls and HOs served at the 1st user preference RAT. Copyright © 2009 SciRes. IJCNS  I. MODEAS ET AL. 818 0 5000 10000 15000 20000 25000 30000 35000 0.05 0.10 0.15 0.20 0.250.30 0.35 0.40 0.45 WLAN coverage requests HO requests HO stopped in MT 0.10 0.15 0.20 0.25 0.30 0.05 0.100.15 0.200.25 0.300.35 0.400.45 WLAN coverage HO stopped in MT (a) (b) Figure 14. HO requests messages sent to the CN and stopped in the MT. 0.0% 0.5% 1.0% 1.5% 2.0% 2.5% 3.0% 0.10 0.200.30 0.40 0.50 0.60 0.700.80 0.90 fast moving users ratio call blocking HO blocking call dropping Figure 15. Call/HO blocking and call dropping probabilities. according to the area of WLAN coverage. The same ap- plies to the number of the HO requests that are dealt with in the part of the algorithm running at the MT. Relatively both numbers in Figure 14(a) augment by the same ratio, and this is the reason why the percentage of the HO re- quests stopped in the MT lies about 19% in Figure 14(b). Thus, as in the previous scenario, we see that this per- centage is again both quite high and quite irrelevant to the coverage area. 3.5. Modifying the Fast Users Ratio In this last scenario, we evaluate the algorithm according to the percentage of the mobile users that move faster than the specified velocity threshold beyond which a user is considered to move too fast to be eligible for service in WLAN. This means that the part of the algorithm run- ning in the core network and specifically the WLAN evaluation function in Figure 3(b) will return a negative answer to either a new call or a vertical HO request. The coverage of WLAN is one fifth of the whole system area, the ratio of fast moving users fluctuate from 0.10 to 0.90–such as in the case of highway coverage–and all other simulation parameters are as shown in Table 5. Let us have a look at the first metric of our evaluation. This is shown at Figure 15. The first observation is that the blocking probability of a new call is increasing with the increase in the fast users’ ratio. This is expected since fast users are excluded from WLAN. This means that for all those users only UMTS is an option either for a new call or a vertical HO. Thus, UMTS has to serve an all increasing number of users thus it is highly stressed and this limits the number of new calls accepted in the whole system. On the other hand, the blocking probability of a vertical HO has the opposite tendency from the new call blocking probability. The same applies to the dropping probability of an ongoing call. Both remain relatively constant at the beginning and then tend to slightly de- crease. The reason is that since the new call blocking probability is increasing, the number of new calls suc- cessfully entered the system lowers. This means less ver- tical HO requests and far less blocked HOs. From Equa- tions (2) and (3), we then understand the HO blocking nd call dropping curves. a Copyright © 2009 SciRes. IJCNS  I. MODEASET AL. Copyright © 2009 SciRes. IJCNS 819 0% 10% 20% 30% 40% 50% 60% 70% 80% 90% 100% 0.10 0.20 0.30 0.400.500.60 0.70 0.80 0.90 fast moving users ratio 1st user preference satisfied new call HO Figure 16. New calls and HOs served at the 1st user preference RAT. 0 5000 10000 15000 20000 25000 30000 0.100.20 0.300.40 0.50 0.600.70 0.800.90 fast moving users ratio HO requests HO stopped in MT 0.10 0.15 0.20 0.25 0.30 0.10 0.200.30 0.400.500.60 0.700.80 0.90 fast moving users ratio HO stopped in MT (a) (b) Figure 17. HO requests messages sent to the CN and stopped in the MT. The next metric regarding the user satisfaction related to the number of new calls and HOs served by the RAT indicated in the first user preference, is shown in Figure 16. We see that both of them decrease when the ratio of fast users is increasing. This is because when more and more users are moving too fast to be accepted in WLAN, the latter is not an option for the majority of the users and only UMTS is accepting them. Thus, the algorithm cannot provide an alternative RAT and there is no option to choose from. Though, this seems a limitation of the number of alternative RATs and not of the algorithm itself. If more alternative RATs where available, we ex- pect that the situation would be better. The last metric regarding the number of HO requests sent at the core network and those dealt with in the MTs is shown in Figure 17. Here we see that when the ratio of fast moving users increases, the number of HO requests messages from the MTs to the core network is decreasing (Figure 17(a)). This, as explained earlier, is due to the decreasing number of new calls entering the system. On the other hand, what is really appealing here, is the fact that the number of HOs that are dealt with in the part of the algorithm running at the MTs is almost constant (Figure 17(a)) and as a percentage always increasing from 19-29% (Figure 17(b)). This high percentage is very important if we consider that all these could have been corresponding HO requests messages over the radio interface to the core network. The simulation results show some very interesting re- sults. First of all, in all tested scenarios they justify the splitting of the algorithm functionality in two parts. In every case, a significant number of the HO requests are treated by the corresponding part of the algorithm run- ning at the MT, even in cases where the simulated sys- tem is overloaded. Secondly, the algorithm provides with high percentage of user satisfaction, with the exception  I. MODEAS ET AL. 820 of when the ratio of fast moving users is very high. On the other hand, the results also show that the first priority of the algorithm is not to provide for the best load bal- anced system. This is the reason why in some scenarios, the blocking probabilities may be quite high. 4. Conclusions and Future Work This paper presents a network selection solution for inte- grated UMTS and WLAN mobile networks. It has three main differences in its design from related proposals in the field. Firstly, it is implemented as an algorithm that can be easily tested and implemented. Secondly, it evalu- ates each active connection of every MT separately, as a different HO case. This has the advantage that the more appropriate RAT according to specific parameters will support each connection. This decision though is a trade- off between contradicting criteria, such as the user pref- erences and the network policies and management. The last difference is that the functionality is split in two dis- tinct and co-operating parts. The first part is an algorithm running on the MT and produces a prioritised list of the preferred RATs per connection, taking into account the user preferences and the MT status. The second part is an algorithm running in the CN. It receives the prioritised list from the MT and based on that, it takes the final de- cision upon which HO is allowed or not, and in which RAT. This decision is made according to the RAT type, the network load conditions and the MT’s movement characteristics. This split of the algorithm functionality alleviates the CN from some calculations and precipitates the HO decision. Also, because of the kind of pre-proc- essing done in the MT some requests towards the core network are avoided, if considered not applicable. This re- sults in reducing the signalling load at the radio interface. A simulation model of a network comprising both UMTS and WLAN coverage areas has been implemented. Several scenarios have been run showing that the algo- rithm provides high user satisfaction, it decreases the messages required for the vertical handovers in the whole network, and it alleviates the core network from the proc- essing of many vertical handover requests. This comes with the price of augmenting some blocking probabilities and thus allowing lower total traffic in the whole system. This is something we will try to ameliorate in a future version. This algorithm is quite generic and easily extendable to cover a multitude of RAT in a heterogeneous network. This is something we plan to do as a next step. A step further is to specify in details all message and parameters exchange through Specification and Description Lan- guage–SDL [21]. This will show in details how this al- gorithm works in specific scenarios. Another interesting extension to this work is to map the functionality of the algorithm in specific network entities. Finally, a com- parison and evaluation of this algorithm against other existing ones is on our future plans. 5. References [1] A. Kaloxylos, I. Modeas, N. Passas, and G. Lampropoulos, “Radio resource management in 4G mobile systems,” En- cyclopedia of Wireless and Mobile Communications, ed. Borko Furht, CRC Press, Taylor & Francis Group, 2008. [2] J. McNair and F. Zhu, “Vertical handoffs in fourth-genera- tion multi-network environments,” IEEE Wireless Commu- nications, Vol. 11, pp. 8–15, June 2004. [3] A. Hasswa, N. Nasser, and H. Hassanein, “Generic vertical handoff decision function for heterogeneous wireless net- works,” 2nd IFIP International Conference on Wireless & Optical Communications Networks, pp. 239– 243, 2005. [4] O. Ormond, P. Perry, and J. Murphy, “Network selection decision in wireless heterogeneous networks,” IEEE 16th International Symposium on Personal, Indoor and Mobile Radio Communications (PIMRC), September 2005. [5] P. L. M. Chan, R. E. Sheriff, Y. F. Hu, P. Conforto, and C. Tocci, “Mobility management incorporating fuzzy logic for a heterogeneous IP environment,” IEEE Communica- tions Magazine, Vol. 39, No. 12, pp. 42–51, 2001. [6] K. Pahlavan, P. Krishnamurthy, A. Hatami, M. Ylianttila, J. P. Makela, R. Pichna, and J. K. Vallström, “Handoff in hybrid mobile data networks, ” IEEE Personal Commu- nications, Vol. 7, No. 2, pp. 34–47, April 2000. [7] L. Giupponi, R. Augusti, J. Perez-Romero, and O. Sallent, “A novel joint radio resource management approach with reinforcement learning mechanisms,” 24th IEEE Interna- tional Performance Computing & Communications Con- ference (IPCCC), pp. 621–626, 2005. [8] R. Augusti, et al., “A fuzzy-neural based approach for joint radio resource management in a beyond 3G network,” Pro- ceedings 1st International Conference on Quality of Service in Heterogeneous Wired/Wireless Networks (QSHINE), 2004. [9] J. Pérez-Romero, O. Sallent, and R. Agustí, “Policy- Based initial RAT selection algorithms in heterogeneous net- works,” in Proceedings of Mobile and Wireless Commu- nication Networks (MWCN), 2005. [10] F. Zhu and J. McNair, “Multi-Service vertical handoff deci- sion algorithms,” in EURASIP Journal on Wireless Com- munications and Networking, 2006. [11] W. Song, W. Zhuang, and Y. Cheng “Load balancing for cellular/WLAN integrated networks,” IEEE Network, Vol. 21, No. 1, pp. 27–33, January–February 2007. [12] I. Modeas, A. Kaloxylos, N. Passas, and L. Merakos, “An algorithm for radio resources management in integrated cellular/WLAN networks,” IEEE 18th International Sympo- sium on Personal, Indoor and Mobile Radio Communica- tions (PIMRC), September 2007. [13] A. Kaloxylos, G. Lampropoulos, N. Passas, and L. Mera- kos, “A flexible mechanism for service continuity in 4G environments,” Elsevier Computer Communications Journal, special issue on end-to-end QoS provision advances, 2006. [14] G. Lampropoulos, A. Kaloxylos, N. Passas, and L. Mera- kos, “A power consumption analysis of tight-coupled WLAN/UMTS networks,” IEEE 18th International Sympo- sium on Personal, Indoor and Mobile Radio Communica- Copyright © 2009 SciRes. IJCNS  I. MODEAS ET AL. Copyright © 2009 SciRes. IJCNS 821 tions (PIMRC), September 2007. [15] 3GPP TS 25.213 version 7.6.0 Release 7, Universal Mo- bile Telecommunications System (UMTS), Spreading and modulation (FDD), October 2008. [16] J. M. Holtzman and A. Sampath, “Adaptive averaging methodology for handoffs in cellular systems,” IEEE Transactions on Vehicle Technology, pp. 59–66, 1995. [17] M. D. Austin and G. L. Stüber, “Velocity adaptive handoff algorithms for microcellular systems”, IEEE Transactions on Vehicle Technology, Vol. 43, pp. 549–561, 1994. [18] 3GPP TS 25.305 v7.4.0 Technical Specification, 3rd Gen- eration Partnership Project, Technical Specification Group Radio Access Network, Stage 2 functional specification of User Equipment (UE) positioning in UTRAN (Release 7), September 2007. [19] The Network Simulator-ns-2, http://www.isi.edu/nsnam/ns/. [20] H. Kaaranen, A. Ahtiainen, L. Laitinen, S. Anghian, and V. Niemi, “UMTS networks, architecture, mobility and services,” Second Edition, Wiley, 2005. [21] International Telecommunication Union, “Specification and description language (SDL),” Recommendation Z.100, ITU- T Study Group 17, http://www.itu.int/ITU-T/studygroups/ com17/languages/Z100.pdf. |