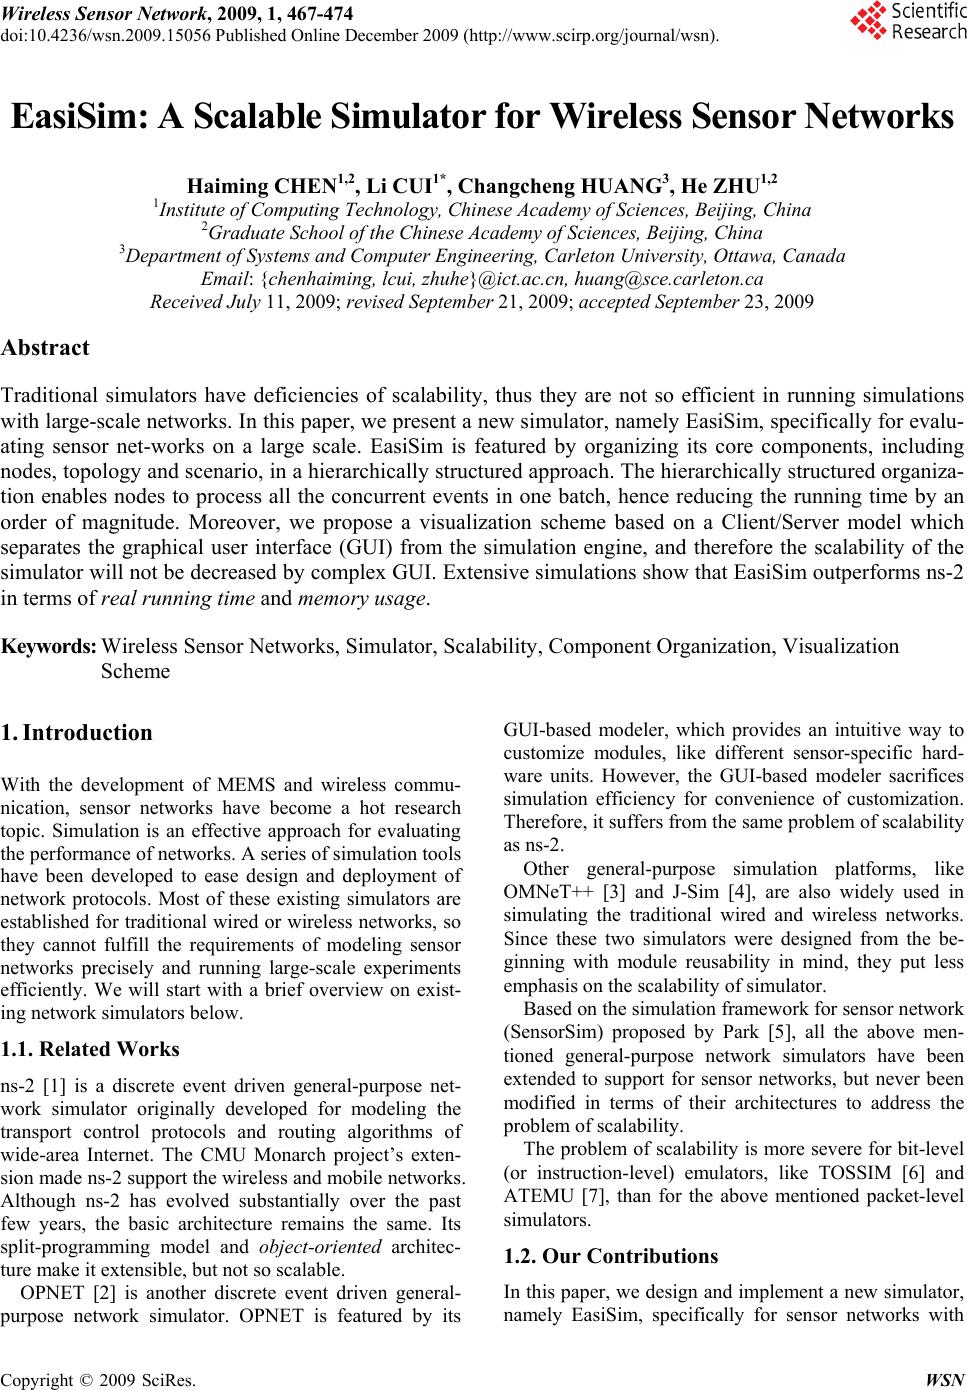
 Wireless Sensor Network, 2009, 1, 467-474 doi:10.4236/wsn.2009.15056 Published Online December 2009 (http://www.scirp.org/journal/wsn). Copyright © 2009 SciRes. WSN EasiSim: A Scalable Simulator for Wireless Sensor Networks Haiming CHEN1,2, Li CUI1*, Changcheng HUANG3, He ZHU1,2 1Institute of Computing Technology, Chinese Academy of Sciences, Beijing, China 2Graduate School of the Chinese Academy of Sciences, Beijing, China 3Department of Systems and Computer Engineering, Carleton University, Ottawa, Canada Email: {chenhaiming, lcui, zhuhe}@ict.ac.cn, huang@sce.carleton.ca Received July 11, 2009; revised September 21, 2009; accepted September 23, 2009 Abstract Traditional simulators have deficiencies of scalability, thus they are not so efficient in running simulations with large-scale networks. In this paper, we present a new simulator, namely EasiSim, specifically for evalu- ating sensor net-works on a large scale. EasiSim is featured by organizing its core components, including nodes, topology and scenario, in a hierarchically structured approach. The hierarchically structured organiza- tion enables nodes to process all the concurrent events in one batch, hence reducing the running time by an order of magnitude. Moreover, we propose a visualization scheme based on a Client/Server model which separates the graphical user interface (GUI) from the simulation engine, and therefore the scalability of the simulator will not be decreased by complex GUI. Extensive simulations show that EasiSim outperforms ns-2 in terms of real running time and memory usage. Keywords: Wireless Sensor Networks, Simulator, Scalability, Component Organization, Visualization Scheme 1. Introduction With the development of MEMS and wireless commu- nication, sensor networks have become a hot research topic. Simulation is an effective approach for evaluating the performance of networks. A series of simulation tools have been developed to ease design and deployment of network protocols. Most of these existing simulators are established for traditional wired or wireless networks, so they cannot fulfill the requirements of modeling sensor networks precisely and running large-scale experiments efficiently. We will start with a brief overview on exist- ing network simulators below. 1.1. Related Works ns-2 [1] is a discrete event driven general-purpose net- work simulator originally developed for modeling the transport control protocols and routing algorithms of wide-area Internet. The CMU Monarch project’s exten- sion made ns-2 support the wireless and mobile networks. Although ns-2 has evolved substantially over the past few years, the basic architecture remains the same. Its split-programming model and object-oriented architec- ture make it extensible, but not so scalable. OPNET [2] is another discrete event driven general- purpose network simulator. OPNET is featured by its GUI-based modeler, which provides an intuitive way to customize modules, like different sensor-specific hard- ware units. However, the GUI-based modeler sacrifices simulation efficiency for convenience of customization. Therefore, it suffers from the same problem of scalability as ns-2. Other general-purpose simulation platforms, like OMNeT++ [3] and J-Sim [4], are also widely used in simulating the traditional wired and wireless networks. Since these two simulators were designed from the be- ginning with module reusability in mind, they put less emphasis on the scalability of simulator. Based on the simulation framework for sensor network (SensorSim) proposed by Park [5], all the above men- tioned general-purpose network simulators have been extended to support for sensor networks, but never been modified in terms of their architectures to address the problem of scalability. The problem of scalability is more severe for bit-level (or instruction-level) emulators, like TOSSIM [6] and ATEMU [7], than for the above mentioned packet-level simulators. 1.2. Our Contributions In this paper, we design and implement a new simulator, namely EasiSim, specifically for sensor networks with 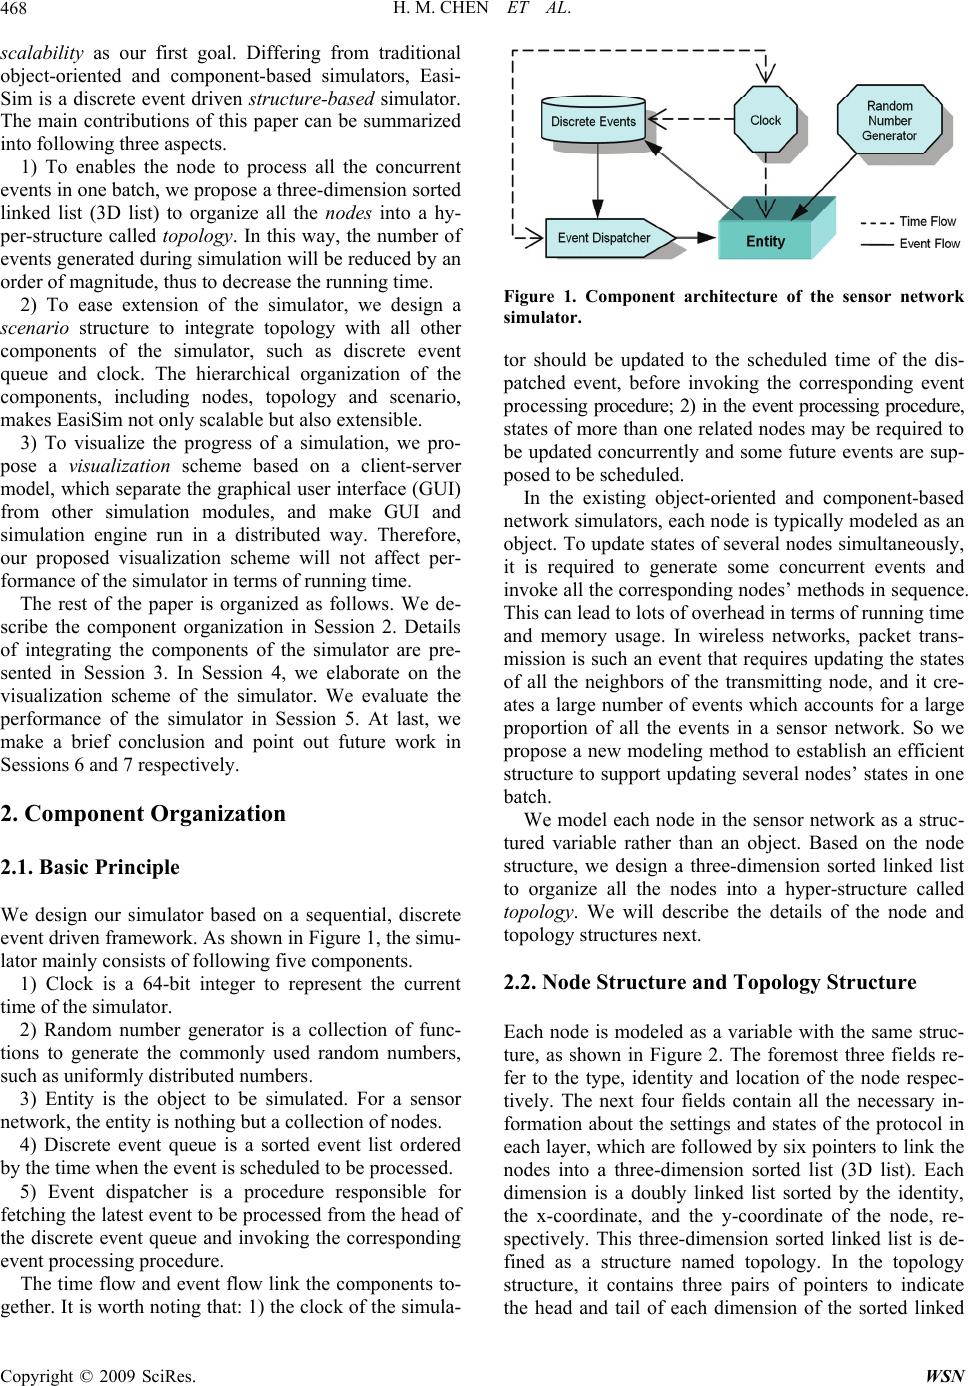 H. M. CHEN ET AL. 468 scalability as our first goal. Differing from traditional object-oriented and component-based simulators, Easi- Sim is a discrete event driven structure-based simulator. The main contributions of this paper can be summarized into following three aspects. 1) To enables the node to process all the concurrent events in one batch, we propose a three-dimension sorted linked list (3D list) to organize all the nodes into a hy- per-structure called topology. In this way, the number of events generated during simulation will be reduced by an order of magnitude, thus to decrease the running time. 2) To ease extension of the simulator, we design a scenario structure to integrate topology with all other components of the simulator, such as discrete event queue and clock. The hierarchical organization of the components, including nodes, topology and scenario, makes EasiSim not only scalable but also extensible. 3) To visualize the progress of a simulation, we pro- pose a visualization scheme based on a client-server model, which separate the graphical user interface (GUI) from other simulation modules, and make GUI and simulation engine run in a distributed way. Therefore, our proposed visualization scheme will not affect per- formance of the simulator in terms of running time. The rest of the paper is organized as follows. We de- scribe the component organization in Session 2. Details of integrating the components of the simulator are pre- sented in Session 3. In Session 4, we elaborate on the visualization scheme of the simulator. We evaluate the performance of the simulator in Session 5. At last, we make a brief conclusion and point out future work in Sessions 6 and 7 respectively. 2. Component Organization 2.1. Basic Principle We design our simulator based on a sequential, discrete event driven framework. As shown in Figure 1, the simu- lator mainly consists of following five components. 1) Clock is a 64-bit integer to represent the current time of the simulator. 2) Random number generator is a collection of func- tions to generate the commonly used random numbers, such as uniformly distributed numbers. 3) Entity is the object to be simulated. For a sensor network, the entity is nothing but a collection of nodes. 4) Discrete event queue is a sorted event list ordered by the time when the event is scheduled to be processed. 5) Event dispatcher is a procedure responsible for fetching the latest event to be processed from the head of the discrete event queue and invoking the corresponding event processing procedure. The time flow and event flow link the components to- gether. It is worth noting that: 1) the clock of the simula- Figure 1. Component architecture of the sensor network simulator. tor should be updated to the scheduled time of the dis- patched event, before invoking the corresponding event processing procedure; 2) in the event processing procedure, states of more than one related nodes may be required to be updated concurrently and some future events are sup- posed to be scheduled. In the existing object-oriented and component-based network simulators, each node is typically modeled as an object. To update states of several nodes simultaneously, it is required to generate some concurrent events and invoke all the corresponding nodes’ methods in sequence. This can lead to lots of overhead in terms of running time and memory usage. In wireless networks, packet trans- mission is such an event that requires updating the states of all the neighbors of the transmitting node, and it cre- ates a large number of events which accounts for a large proportion of all the events in a sensor network. So we propose a new modeling method to establish an efficient structure to support updating several nodes’ states in one batch. We model each node in the sensor network as a struc- tured variable rather than an object. Based on the node structure, we design a three-dimension sorted linked list to organize all the nodes into a hyper-structure called topology. We will describe the details of the node and topology structures next. 2.2. Node Structure and Topology Structure Each node is modeled as a variable with the same struc- ture, as shown in Figure 2. The foremost three fields re- fer to the type, identity and location of the node respec- tively. The next four fields contain all the necessary in- formation about the settings and states of the protocol in each layer, which are followed by six pointers to link the nodes into a three-dimension sorted list (3D list). Each dimension is a doubly linked list sorted by the identity, the x-coordinate, and the y-coordinate of the node, re- spectively. This three-dimension sorted linked list is de- fined as a structure named topology. In the topology structure, it contains three pairs of pointers to indicate the head and tail of each dimension of the sorted linked Copyright © 2009 SciRes. WSN 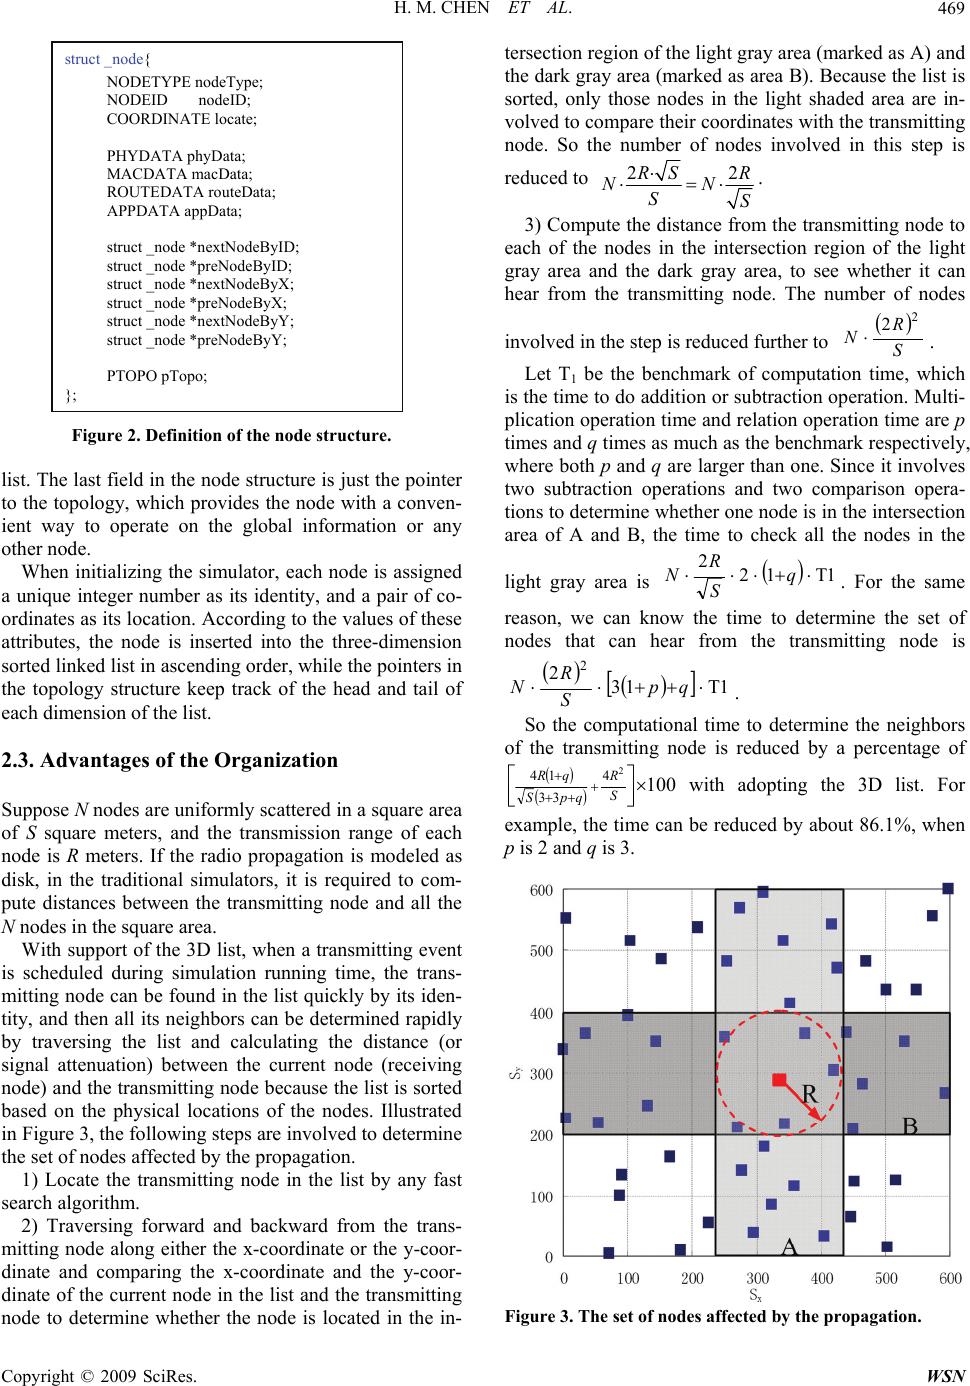 H. M. CHEN ET AL.469 Figure 2. Definition of the node structure. list. The last field in the node structure is just the pointer to the topology, which provides the node with a conven- ient way to operate on the global information or any other node. When initializing the simulator, each node is assigned a unique integer number as its identity, and a pair of co- ordinates as its location. According to the values of these attributes, the node is inserted into the three-dimension sorted linked list in ascending order, while the pointers in the topology structure keep track of the head and tail of each dimension of the list. 2.3. Advantages of the Organization Suppose N nodes are uniformly scattered in a square area of S square meters, and the transmission range of each node is R meters. If the radio propagation is modeled as disk, in the traditional simulators, it is required to com- pute distances between the transmitting node and all the N nodes in the square area. With support of the 3D list, when a transmitting event is scheduled during simulation running time, the trans- mitting node can be found in the list quickly by its iden- tity, and then all its neighbors can be determined rapidly by traversing the list and calculating the distance (or signal attenuation) between the current node (receiving node) and the transmitting node because the list is sorted based on the physical locations of the nodes. Illustrated in Figure 3, the following steps are involved to determine the set of nodes affected by the propagation. 1) Locate the transmitting node in the list by any fast search algorithm. 2) Traversing forward and backward from the trans- mitting node along either the x-coordinate or the y-coor- dinate and comparing the x-coordinate and the y-coor- dinate of the current node in the list and the transmitting node to determine whether the node is located in the in- tersection region of the light gray area (marked as A) and the dark gray area (marked as area B). Because the list is sorted, only those nodes in the light shaded area are in- volved to compare their coordinates with the transmitting node. So the number of nodes involved in this step is reduced to 22 SR NN SS . struct _node{ NODETYPE nodeType; NODEID nodeID; COORDINATE locate; PHYDATA phyData; MACDATA macData; ROUTEDATA routeData; APPDATA appData; struct _node *nextNodeByID; struct _node *preNodeByID; struct _node *nextNodeByX; struct _node *preNodeByX; struct _node *nextNodeByY; struct _node *preNodeByY; PTOPO pTopo; }; 3) Compute the distance from the transmitting node to each of the nodes in the intersection region of the light gray area and the dark gray area, to see whether it can hear from the transmitting node. The number of nodes involved in the step is reduced further to S R N 2 2 . Let T1 be the benchmark of computation time, which is the time to do addition or subtraction operation. Multi- plication operation time and relation operation time are p times and q times as much as the benchmark respectively, where both p and q are larger than one. Since it involves two subtraction operations and two comparison opera- tions to determine whether one node is in the intersection area of A and B, the time to check all the nodes in the light gray area is 1T12 2 q S R N. For the same reason, we can know the time to determine the set of nodes that can hear from the transmitting node is 1T13 22 qp S R N. So the computational time to determine the neighbors of the transmitting node is reduced by a percentage of 100 2 4 33 14 S R qpS qR with adopting the 3D list. For example, the time can be reduced by about 86.1%, when p is 2 and q is 3. Figure 3. The set of nodes affected by the propagation. Copyright © 2009 SciRes. WSN 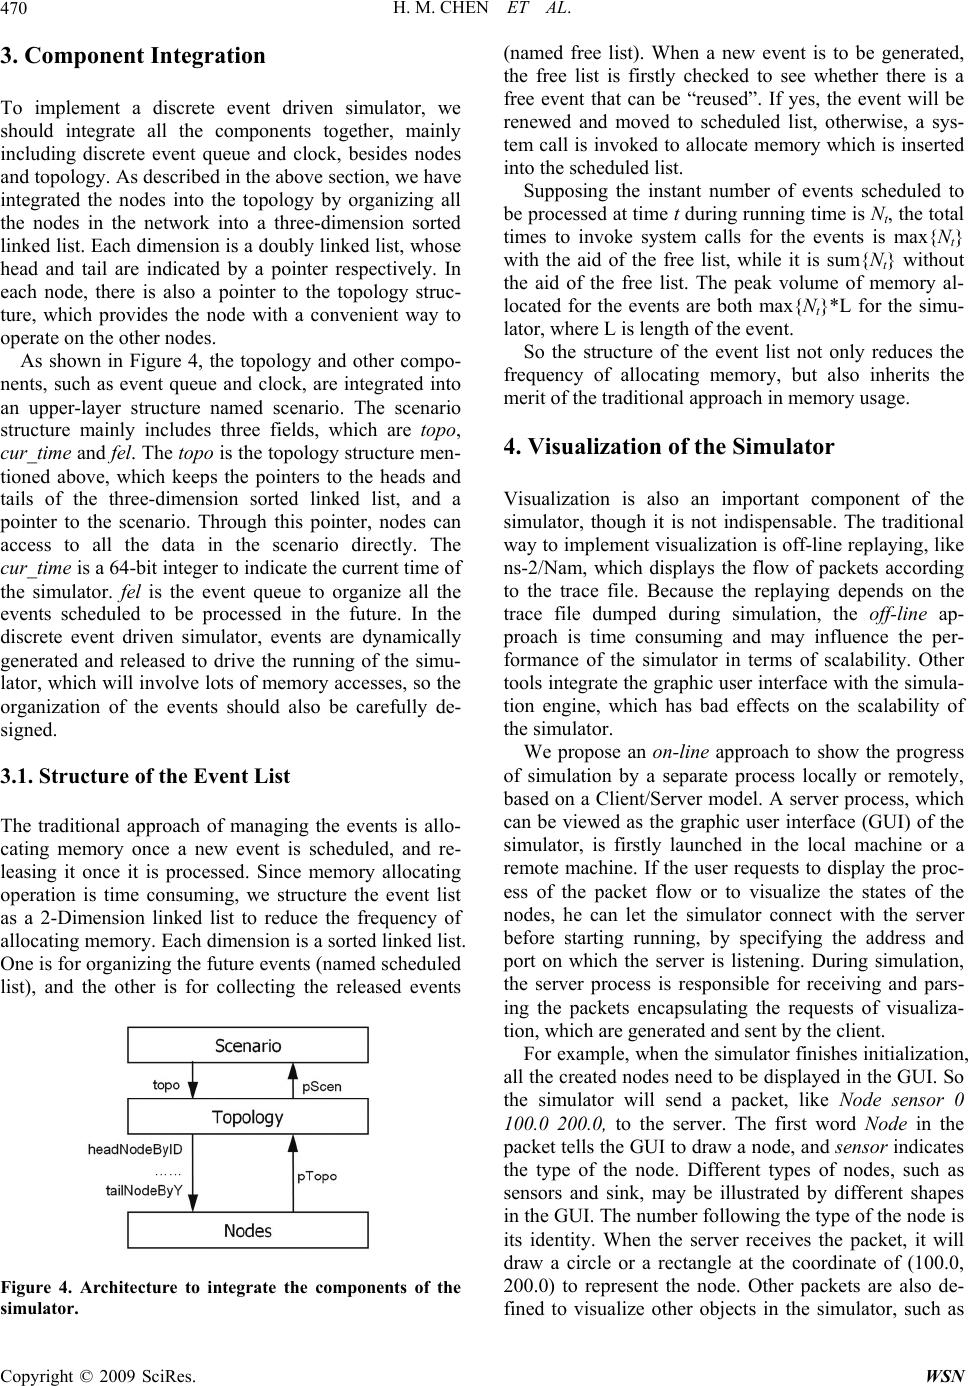 H. M. CHEN ET AL. 470 3. Component Integration To implement a discrete event driven simulator, we should integrate all the components together, mainly including discrete event queue and clock, besides nodes and topology. As described in the above section, we have integrated the nodes into the topology by organizing all the nodes in the network into a three-dimension sorted linked list. Each dimension is a doubly linked list, whose head and tail are indicated by a pointer respectively. In each node, there is also a pointer to the topology struc- ture, which provides the node with a convenient way to operate on the other nodes. As shown in Figure 4, the topology and other compo- nents, such as event queue and clock, are integrated into an upper-layer structure named scenario. The scenario structure mainly includes three fields, which are topo, cur_time and fe l. The topo is the topology structure men- tioned above, which keeps the pointers to the heads and tails of the three-dimension sorted linked list, and a pointer to the scenario. Through this pointer, nodes can access to all the data in the scenario directly. The cur_time is a 64-bit integer to indicate the current time of the simulator. fel is the event queue to organize all the events scheduled to be processed in the future. In the discrete event driven simulator, events are dynamically generated and released to drive the running of the simu- lator, which will involve lots of memory accesses, so the organization of the events should also be carefully de- signed. 3.1. Structure of the Event List The traditional approach of managing the events is allo- cating memory once a new event is scheduled, and re- leasing it once it is processed. Since memory allocating operation is time consuming, we structure the event list as a 2-Dimension linked list to reduce the frequency of allocating memory. Each dimension is a sorted linked list. One is for organizing the future events (named scheduled list), and the other is for collecting the released events Figure 4. Architecture to integrate the components of the simulator. (named free list). When a new event is to be generated, the free list is firstly checked to see whether there is a free event that can be “reused”. If yes, the event will be renewed and moved to scheduled list, otherwise, a sys- tem call is invoked to allocate memory which is inserted into the scheduled list. Supposing the instant number of events scheduled to be processed at time t during running time is Nt, the total times to invoke system calls for the events is max{Nt} with the aid of the free list, while it is sum{Nt} without the aid of the free list. The peak volume of memory al- located for the events are both max{Nt}*L for the simu- lator, where L is length of the event. So the structure of the event list not only reduces the frequency of allocating memory, but also inherits the merit of the traditional approach in memory usage. 4. Visualization of the Simulator Visualization is also an important component of the simulator, though it is not indispensable. The traditional way to implement visualization is off-line replaying, like ns-2/Nam, which displays the flow of packets according to the trace file. Because the replaying depends on the trace file dumped during simulation, the off-line ap- proach is time consuming and may influence the per- formance of the simulator in terms of scalability. Other tools integrate the graphic user interface with the simula- tion engine, which has bad effects on the scalability of the simulator. We propose an on-line approach to show the progress of simulation by a separate process locally or remotely, based on a Client/Server model. A server process, which can be viewed as the graphic user interface (GUI) of the simulator, is firstly launched in the local machine or a remote machine. If the user requests to display the proc- ess of the packet flow or to visualize the states of the nodes, he can let the simulator connect with the server before starting running, by specifying the address and port on which the server is listening. During simulation, the server process is responsible for receiving and pars- ing the packets encapsulating the requests of visualiza- tion, which are generated and sent by the client. For example, when the simulator finishes initialization, all the created nodes need to be displayed in the GUI. So the simulator will send a packet, like Node sensor 0 100.0 200.0, to the server. The first word Node in the packet tells the GUI to draw a node, and sensor indicates the type of the node. Different types of nodes, such as sensors and sink, may be illustrated by different shapes in the GUI. The number following the type of the node is its identity. When the server receives the packet, it will draw a circle or a rectangle at the coordinate of (100.0, 200.0) to represent the node. Other packets are also de- fined to visualize other objects in the simulator, such as Copyright © 2009 SciRes. WSN 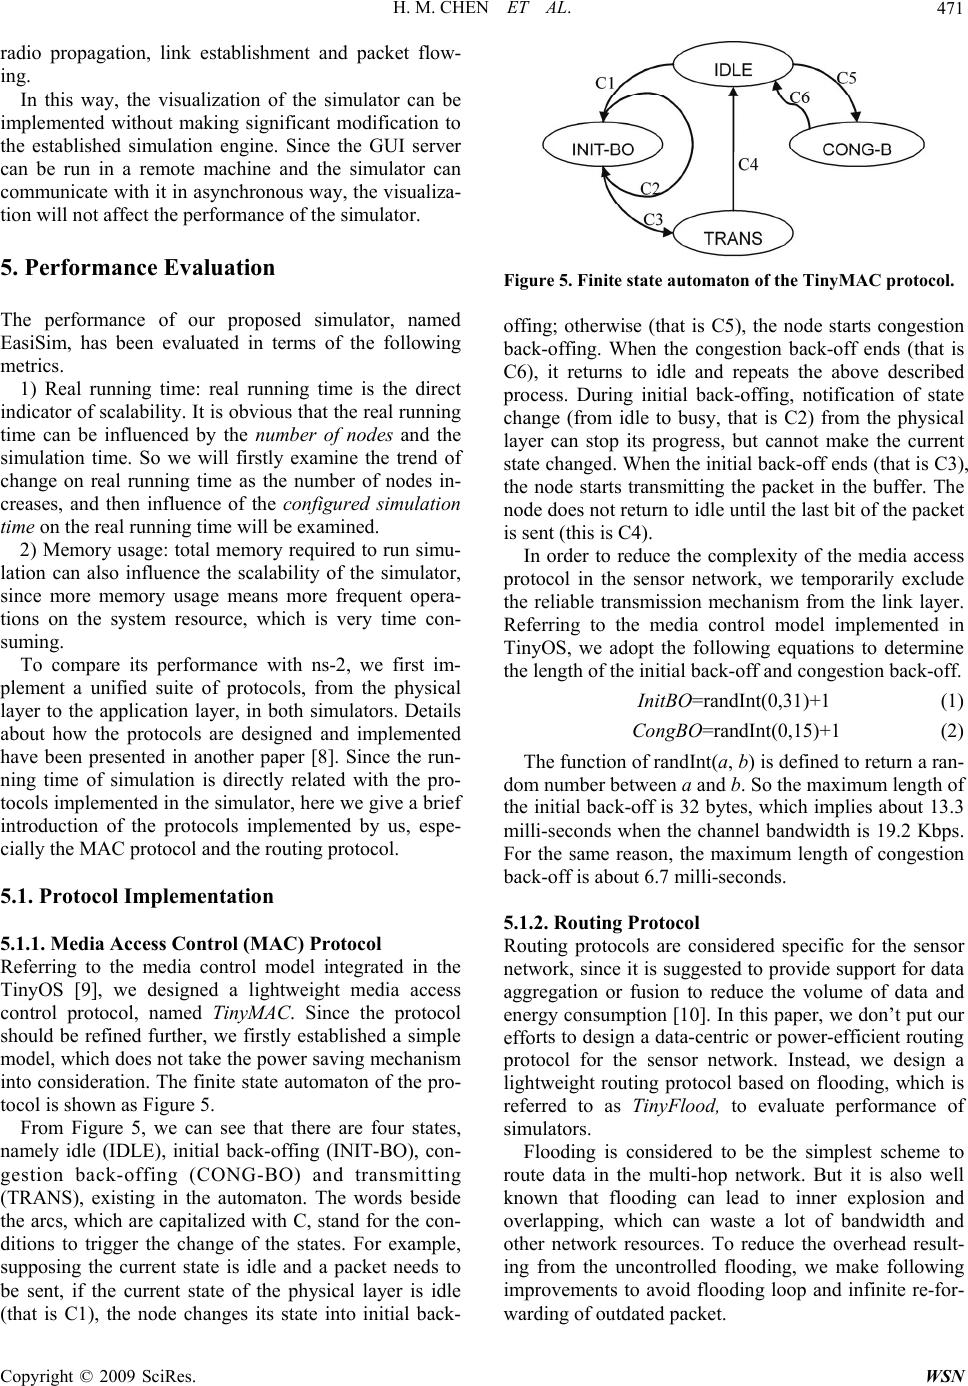 H. M. CHEN ET AL.471 radio propagation, link establishment and packet flow- ing. In this way, the visualization of the simulator can be implemented without making significant modification to the established simulation engine. Since the GUI server can be run in a remote machine and the simulator can communicate with it in asynchronous way, the visualiza- tion will not affect the performance of the simulator. 5. Performance Evaluation The performance of our proposed simulator, named EasiSim, has been evaluated in terms of the following metrics. 1) Real running time: real running time is the direct indicator of scalability. It is obvious that the real running time can be influenced by the number of nodes and the simulation time. So we will firstly examine the trend of change on real running time as the number of nodes in- creases, and then influence of the configured simulation time on the real running time will be examined. 2) Memory usage: total memory required to run simu- lation can also influence the scalability of the simulator, since more memory usage means more frequent opera- tions on the system resource, which is very time con- suming. To compare its performance with ns-2, we first im- plement a unified suite of protocols, from the physical layer to the application layer, in both simulators. Details about how the protocols are designed and implemented have been presented in another paper [8]. Since the run- ning time of simulation is directly related with the pro- tocols implemented in the simulator, here we give a brief introduction of the protocols implemented by us, espe- cially the MAC protocol and the routing protocol. 5.1. Protocol Implementation 5.1.1. Media Access Control (MAC) Protocol Referring to the media control model integrated in the TinyOS [9], we designed a lightweight media access control protocol, named TinyMAC. Since the protocol should be refined further, we firstly established a simple model, which does not take the power saving mechanism into consideration. The finite state automaton of the pro- tocol is shown as Figure 5. From Figure 5, we can see that there are four states, namely idle (IDLE), initial back-offing (INIT-BO), con- gestion back-offing (CONG-BO) and transmitting (TRANS), existing in the automaton. The words beside the arcs, which are capitalized with C, stand for the con- ditions to trigger the change of the states. For example, supposing the current state is idle and a packet needs to be sent, if the current state of the physical layer is idle (that is C1), the node changes its state into initial back- Figure 5. Finite state automaton of the TinyMAC protocol. offing; otherwise (that is C5), the node starts congestion back-offing. When the congestion back-off ends (that is C6), it returns to idle and repeats the above described process. During initial back-offing, notification of state change (from idle to busy, that is C2) from the physical layer can stop its progress, but cannot make the current state changed. When the initial back-off ends (that is C3), the node starts transmitting the packet in the buffer. The node does not return to idle until the last bit of the packet is sent (this is C4). In order to reduce the complexity of the media access protocol in the sensor network, we temporarily exclude the reliable transmission mechanism from the link layer. Referring to the media control model implemented in TinyOS, we adopt the following equations to determine the length of the initial back-off and congestion back-off. InitBO=randInt(0,31)+1 (1) CongBO=randInt(0,15)+1 (2) The function of randInt(a, b) is defined to return a ran- dom number between a and b. So the maximum length of the initial back-off is 32 bytes, which implies about 13.3 milli-seconds when the channel bandwidth is 19.2 Kbps. For the same reason, the maximum length of congestion back-off is about 6.7 milli-seconds. 5.1.2. Routing Protocol Routing protocols are considered specific for the sensor network, since it is suggested to provide support for data aggregation or fusion to reduce the volume of data and energy consumption [10]. In this paper, we don’t put our efforts to design a data-centric or power-efficient routing protocol for the sensor network. Instead, we design a lightweight routing protocol based on flooding, which is referred to as TinyFlood, to evaluate performance of simulators. Flooding is considered to be the simplest scheme to route data in the multi-hop network. But it is also well known that flooding can lead to inner explosion and overlapping, which can waste a lot of bandwidth and other network resources. To reduce the overhead result- ing from the uncontrolled flooding, we make following improvements to avoid flooding loop and infinite re-for- warding of outdated packet. Copyright © 2009 SciRes. WSN 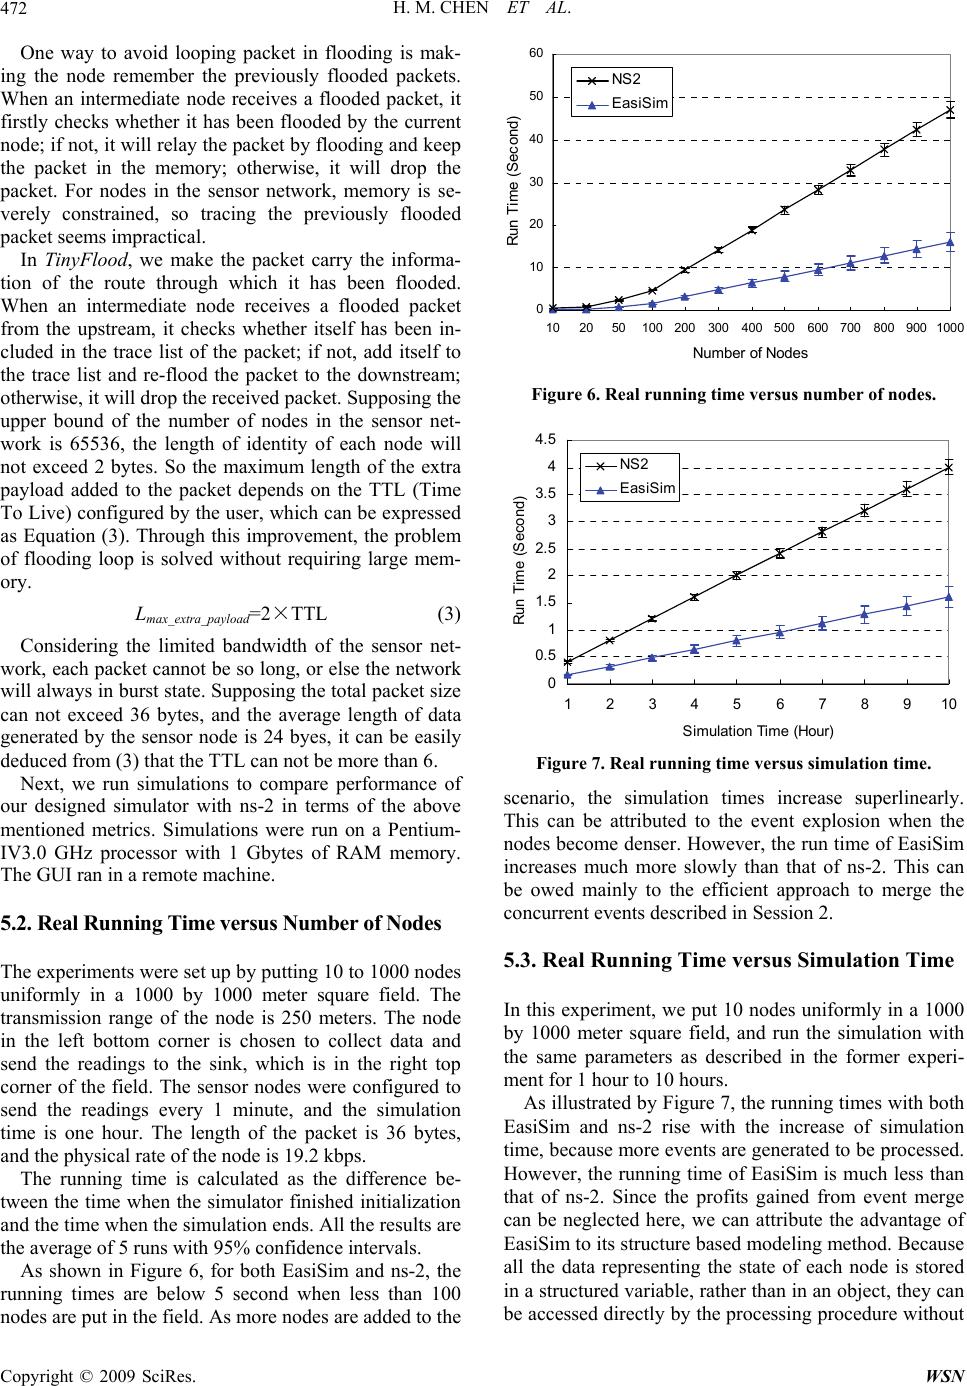 H. M. CHEN ET AL. 472 One way to avoid looping packet in flooding is mak- ing the node remember the previously flooded packets. When an intermediate node receives a flooded packet, it firstly checks whether it has been flooded by the current node; if not, it will relay the packet by flooding and keep the packet in the memory; otherwise, it will drop the packet. For nodes in the sensor network, memory is se- verely constrained, so tracing the previously flooded packet seems impractical. In TinyFlood, we make the packet carry the informa- tion of the route through which it has been flooded. When an intermediate node receives a flooded packet from the upstream, it checks whether itself has been in- cluded in the trace list of the packet; if not, add itself to the trace list and re-flood the packet to the downstream; otherwise, it will drop the received packet. Supposing the upper bound of the number of nodes in the sensor net- work is 65536, the length of identity of each node will not exceed 2 bytes. So the maximum length of the extra payload added to the packet depends on the TTL (Time To Live) configured by the user, which can be expressed as Equation (3). Through this improvement, the problem of flooding loop is solved without requiring large mem- ory. Lmax_extra_payload=2×TTL (3) Considering the limited bandwidth of the sensor net- work, each packet cannot be so long, or else the network will always in burst state. Supposing the total packet size can not exceed 36 bytes, and the average length of data generated by the sensor node is 24 byes, it can be easily deduced from (3) that the TTL can not be more than 6. Next, we run simulations to compare performance of our designed simulator with ns-2 in terms of the above mentioned metrics. Simulations were run on a Pentium- IV3.0 GHz processor with 1 Gbytes of RAM memory. The GUI ran in a remote machine. 5.2. Real Running Time versus Number of Nodes The experiments were set up by putting 10 to 1000 nodes uniformly in a 1000 by 1000 meter square field. The transmission range of the node is 250 meters. The node in the left bottom corner is chosen to collect data and send the readings to the sink, which is in the right top corner of the field. The sensor nodes were configured to send the readings every 1 minute, and the simulation time is one hour. The length of the packet is 36 bytes, and the physical rate of the node is 19.2 kbps. The running time is calculated as the difference be- tween the time when the simulator finished initialization and the time when the simulation ends. All the results are the average of 5 runs with 95% confidence intervals. As shown in Figure 6, for both EasiSim and ns-2, the running times are below 5 second when less than 100 nodes are put in the field. As more nodes are added to the 0 10 20 30 40 50 60 102050100 200300400 500600 700800 900100 Number of Nodes Run Time (Second) NS2 EasiSim Figure 6. Real running time versus number of nodes. 0 0. 5 1 1. 5 2 2. 5 3 3. 5 4 4. 5 1234567891 Simulation Time (Hour) Run Time (Second) 0 NS2 Eas iSim Figure 7. Real running time versus simulation time. scenario, the simulation times increase superlinearly. This can be attributed to the event explosion when the nodes become denser. However, the run time of EasiSim increases much more slowly than that of ns-2. This can be owed mainly to the efficient approach to merge the concurrent events described in Session 2. 5.3. Real Running Time versus Simulation Time In this experiment, we put 10 nodes uniformly in a 1000 by 1000 meter square field, and run the simulation with the same parameters as described in the former experi- ment for 1 hour to 10 hours. As illustrated by Figure 7, the running times with both EasiSim and ns-2 rise with the increase of simulation time, because more events are generated to be processed. However, the running time of EasiSim is much less than that of ns-2. Since the profits gained from event merge can be neglected here, we can attribute the advantage of EasiSim to its structure based modeling method. Because all the data representing the state of each node is stored in a structured variable, rather than in an object, they can be accessed directly by the processing procedure without Copyright © 2009 SciRes. WSN  H. M. CHEN ET AL.473 invoking other methods, the processing time can be re- duced a lot. 5.4. Memory Usage The setting up of experiments to evaluate the memory usage of the simulator is the same as we described in the above subsection. Here, we record the volumes of mem- ory space allocated for the nodes and the events in the simulator. Figure 8 shows the results of the experiments. We can see that EasiSim is always more memory effi- cient than ns-2. The main reason leading to the result can be concluded as follows. In ns-2, every component of the node is modeled by an object, and the components then comprise the node. Each object in ns-2 has a shadow in memory, so ns-2 needs twice more spaces than EasiSim to store the nodes in the network. 6. Conclusions This paper presented a new simulator called EasiSim, for simulating sensor networks at large scales. EasiSim is featured by the structure-based modeling method and the hierarchical organization of the compo- nents. As the fundamental components, the node struc- tures are firstly organized into a three-dimension sorted linked list. Pointers to the head and the tail of each di- mension of the 3D list are then organized into the hy- per-structure called topology, through which all the nodes involved in the current event can be operated di- rectly. In this way, some concurrent events can be merged and thereby the running time can be reduced by an order of magnitude. The topology structure is then integrated with other components of the simulator, such as the discrete event queue and the simulation clock, into the top-level structure named scenario. We evaluate the scalability of our designed simulator in terms of real running time and memory usage. The results show that it takes less time and less memory for EasiSim than for ns-2 to complete simulations with the 0 2 4 6 8 10 12 14 16 102050100 200 300 400 500 600700 800 9001000 Number of Nodes Memory Usage (MB) NS2 EasiSim Figure 8. Memory usage versus number of nodes. same number of nodes and configured simulation time. Furthermore, we proposed a visualization scheme based on a client-server mode, which enable the simula- tion and GUI processes to run in a distributed way. Therefore, our proposed visualization scheme does not decrease the performance of the simulator in terms of scalability. 7. Future Work So far, we have established a scalable simulation plat- form for sensor networks. To evaluate the performance of the simulator, we also implemented the disk radio propagation module, the MAC protocol and the flooding protocol in the simulator. As for our future works, we plan to extend the mod- ules, including the radio channel modules, the environ- ment modules and the networking protocol modules, to make the simulator support for modeling the sensor net- works more precisely. A practical battery and energy module is also supposed to be implemented in the future days, since it is of vital importance for modeling the power efficiencies of different protocols and life time of the sensor nodes. As more modules added to EasiSim, the scalability of the simulator will be reevaluated and its performance will be improved step by step. Besides that, the visuali- zation scheme will be refined and its effects on the scal- ability of the simulator will be investigated more deeply. 8. Acknowledgements This research is supported in part by the Chinese Acad- emy of Sciences (CAS) - Croucher Funding Scheme for Joint Laboratories under Grant No. GJHZ200819, the National Basic Research Program of China (973 Program) under Grant No.2006CB303000, and the CAS Knowl- edge Innovation Program under Grant No. KGCX2- YW-110-3. 6. References [1] The Network Simulator–ns-2. http://www.isi.edu/nsnam/ns. [2] F. Desbrandes, S. Bertolotti, and L. Dunand. “OPNET 2.4: An environment for communication network modeling and simulation,” In Proceedings of the European Simula- tion Symposium, pp. 609–614, Delft, Nertherlands, Oc- tober 1993. [3] A. Varga. “The OMNeT++ Discrete event simulation sys- tem,” In Proceedings of the European Simulation Multi- conference (ESM’01), Prague, Czech Republic, June 2001. [4] H. Tyan. “Design, realization and evaluation of a compo- nent-based compositional software architecture for net- work simulation,” PhD thesis, Ohio State University, 2002. Copyright © 2009 SciRes. WSN 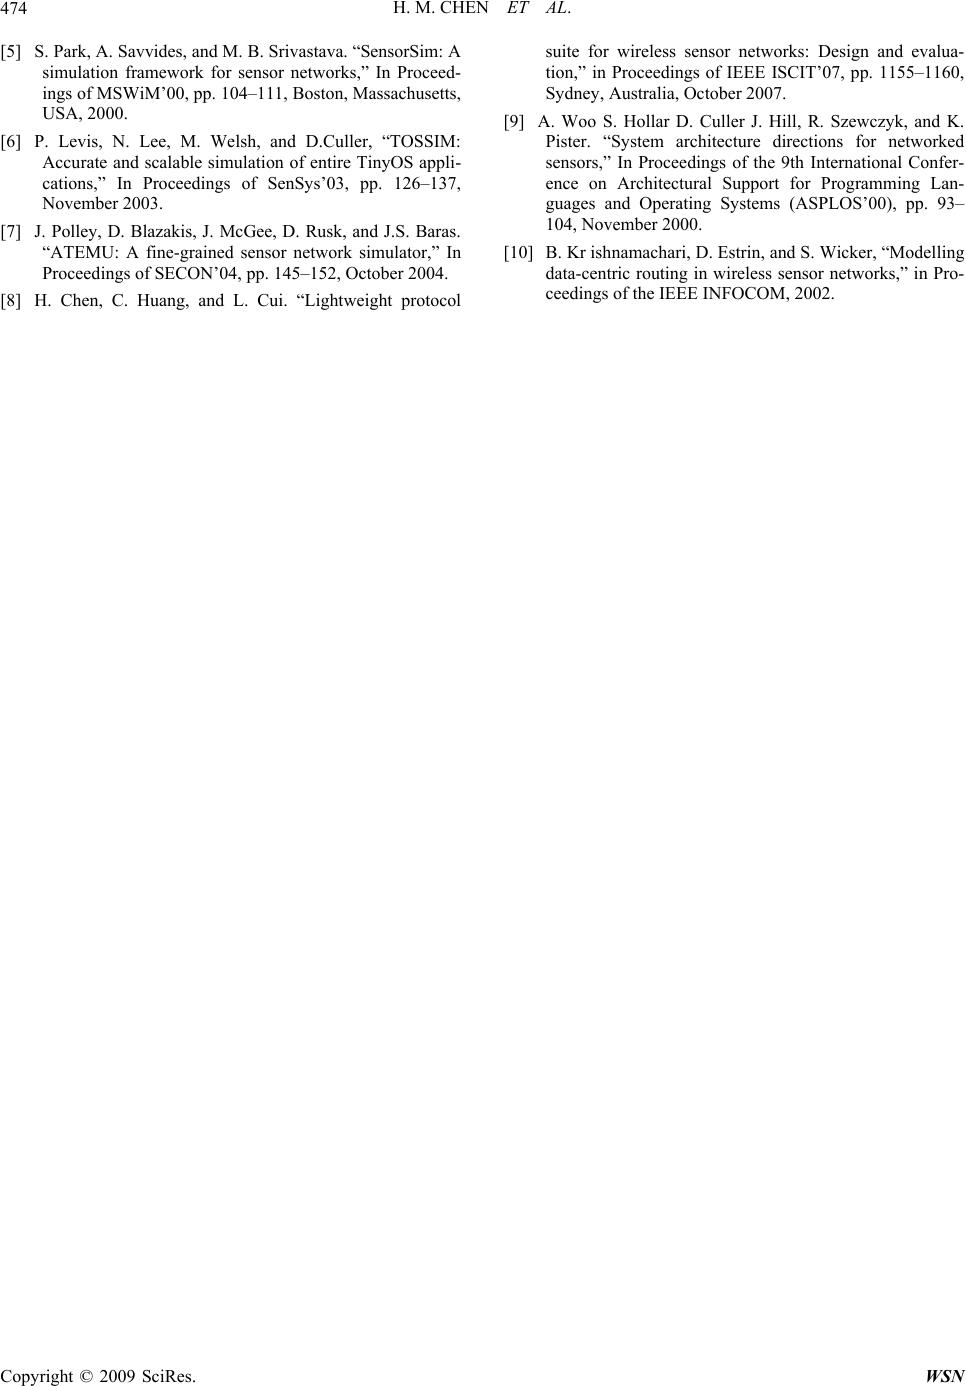 H. M. CHEN ET AL. Copyright © 2009 SciRes. WSN 474 [5] S. Park, A. Savvides, and M. B. Srivastava. “SensorSim: A simulation framework for sensor networks,” In Proceed- ings of MSWiM’00, pp. 104–111, Boston, Massachusetts, USA, 2000. [6] P. Levis, N. Lee, M. Welsh, and D.Culler, “TOSSIM: Accurate and scalable simulation of entire TinyOS appli- cations,” In Proceedings of SenSys’03, pp. 126–137, November 2003. [7] J. Polley, D. Blazakis, J. McGee, D. Rusk, and J.S. Baras. “ATEMU: A fine-grained sensor network simulator,” In Proceedings of SECON’04, pp. 145–152, October 2004. [8] H. Chen, C. Huang, and L. Cui. “Lightweight protocol suite for wireless sensor networks: Design and evalua- tion,” in Proceedings of IEEE ISCIT’07, pp. 1155–1160, Sydney, Australia, October 2007. [9] A. Woo S. Hollar D. Culler J. Hill, R. Szewczyk, and K. Pister. “System architecture directions for networked sensors,” In Proceedings of the 9th International Confer- ence on Architectural Support for Programming Lan- guages and Operating Systems (ASPLOS’00), pp. 93– 104, November 2000. [10] B. Kr ishnamachari, D. Estrin, and S. Wicker, “Modelling data-centric routing in wireless sensor networks,” in Pro- ceedings of the IEEE INFOCOM, 2002.
|