 Wireless Sensor Network, 2009, 1, 383-396 doi:10.4236/wsn.2009.15047 Published Online December 2009 (http://www.scirp.org/journal/wsn). Copyright © 2009 SciRes. WSN 383 Antenna and Base-Station Diversity for WSN Livestock Monitoring Konstantinos SASLOGLOU, Ian A. GLOVER, Hock Guan GOH, Kae Hsiang KWONG Michael P. GILROY, Christos TACHTATZIS, Craig MICHIE, Ivan ANDONOVIC Department of Electronic and Electrical Engineering University of Strathclyde, Glasgow, United K i ngdom Email: {ksasloglou, ian.glover, i.andonovic}@eee.strath.ac.uk Received June 6, 2009; revised August 3, 20 09; accepted August 6, 2009 Abstract Antenna and base-station diversity have been applied to a wireless sensor network for the monitoring of live- stock. A field trial has been described and the advantage to be gained in a practical environment has been assessed. Keywords: Antenna Diversity, Base Station Diversity, Animal Monitoring, Wireless Sensor Networks, Distribution, Rayleigh Distribution, Fading 1. Introduction A wireless sensor network (WSN) is a collection of spatially dispersed sensors that communicate via a set of wireless transceivers [1]. Each transceiver forms one node in the resulting transceiver network. Information collected by the sensors may be transmitted to a central base-station, either directly or by relaying it via one or more intermediate nodes. The network topology and protocols may be fixed and predetermined, or adaptive and self-organizing. Recent advances in micro-electro- mechanical systems, transceiver miniaturisation and transducer technology have made WSNs flexible, scal- able and commercially viable. They have found wide and diverse application in many areas including military [2], industrial [3], commercial [4] and domestic [5]. Of particular relevance to the work presented here are applications to environment and habitat monitoring, agri- culture and animal husbandry [6–15]. Here we apply antenna and base-station diversity to star-configured WSNs for animal husbandry in the dairy and beef industries [16]. The monitoring and/or tracking of mammals usually involves a single antenna attached to a collar worn around the animal’s neck. As the animals move, line-of-sight (LOS) paths between the sensor node and base-station might become obscured by other animals. This fading mechanism is likely to be especi ally im porta nt in the context of anim als with a herding instinct on open grassland. Monitoring livestock in the dairy and beef industries corresponds precisely to this case. The incorporation of antenna diversity at the sensor node combined with the use of two, widely separated, base- stations (yielding base-station diversity) dramatically increases the probability of LOS conditions. The principal objective of the work reported here is the experimental assessment of the practical diversity improvement that can be expected in this little considered, but commercially important, application. 2. System and Methodology The transceiver used for the experiment was the MICAz [17] shown in Figure 1. It operates in the ISM band between 2.40 GHz and 2.48 GHz. Figure 1. MICAz module. 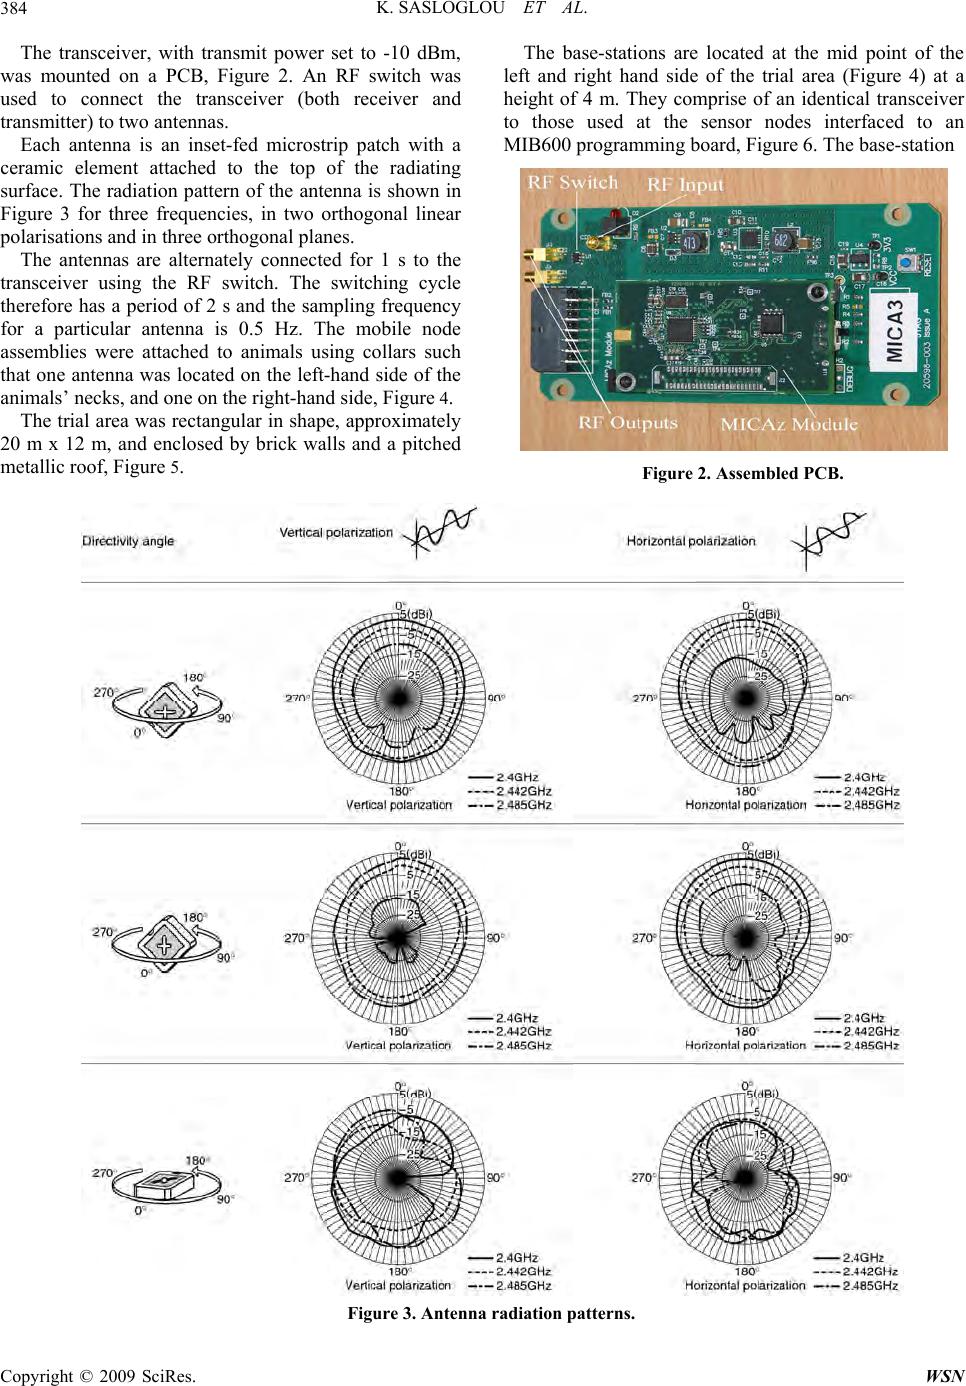 K. SASLOGLOU ET AL. 384 The transceiver, with transmit power set to -10 dBm, was mounted on a PCB, Figure 2. An RF switch was used to connect the transceiver (both receiver and transmitter) to two antennas. Each antenna is an inset-fed microstrip patch with a ceramic element attached to the top of the radiating surface. The radiation pattern of the antenna is shown in Figure 3 for three frequencies, in two orthogonal linear polarisations and in three orthogonal planes. The antennas are alternately connected for 1 s to the transceiver using the RF switch. The switching cycle therefore has a period of 2 s and the sampling frequency for a particular antenna is 0.5 Hz. The mobile node assemblies were attached to animals using collars such that one antenna was located on the left-hand side of the animals’ necks, and one on the right-hand side, Figure 4. The trial area was rectangular in shape, approximately 20 m x 12 m, and enclosed by brick walls and a pitched metallic roof, Figure 5. The base-stations are located at the mid point of the left and right hand side of the trial area (Figure 4) at a height of 4 m. They comprise of an identical transceiver to those used at the sensor nodes interfaced to an MIB600 programming board, Figure 6. The base-station Figure 2. Assembled PCB. Figure 3. Antenna radiation patterns. Copyright © 2009 SciRes. WSN 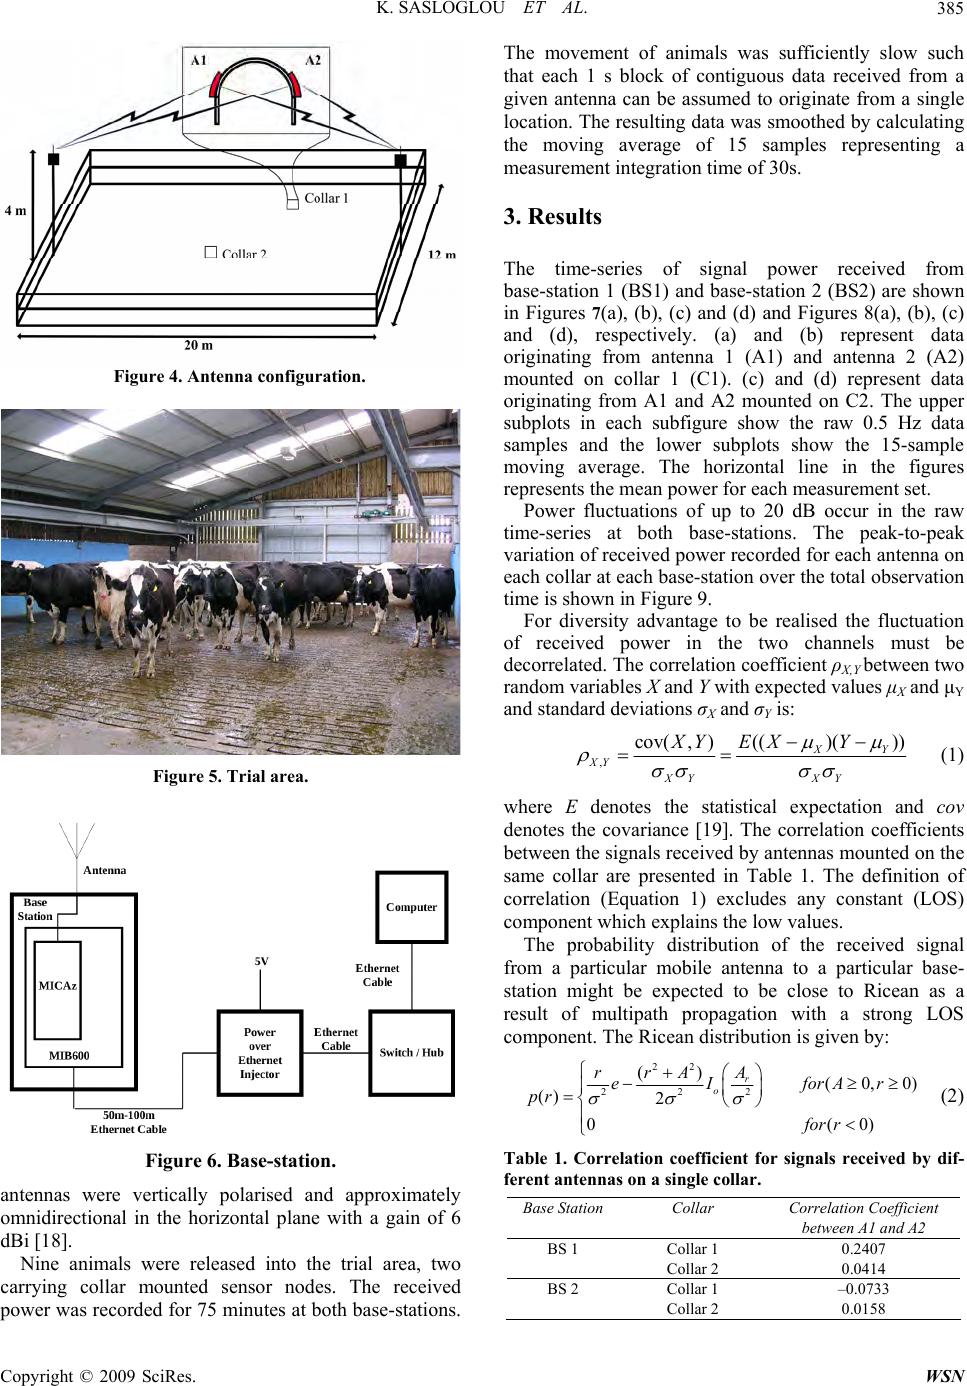 K. SASLOGLOU ET AL. 385 Figure 4. Antenna configuration. Figure 5. Trial area. Figure 6. Base -station. antennas were vertically polarised and approximately omnidirectional in the horizontal plane with a gain of 6 dBi [18]. Nine animals were released into the trial area, two carrying collar mounted sensor nodes. The received power was recorded for 75 minutes at both base-stations. The movement of animals was sufficiently slow such that each 1 s block of contiguous data received from a given antenna can be assumed to originate from a single location. The resulting data was smoothed by calculating the moving average of 15 samples representing a measurement integration time of 30s. 3. Results The time-series of signal power received from base-station 1 (BS1) and base-station 2 (BS2) are shown in Figures 7(a), (b), (c) and (d) and Figures 8(a), (b), (c) and (d), respectively. (a) and (b) represent data originating from antenna 1 (A1) and antenna 2 (A2) mounted on collar 1 (C1). (c) and (d) represent data originating from A1 and A2 mounted on C2. The upper subplots in each subfigure show the raw 0.5 Hz data samples and the lower subplots show the 15-sample moving average. The horizontal line in the figures represents the mean power for each measurement set. Power fluctuations of up to 20 dB occur in the raw time-series at both base-stations. The peak-to-peak variation of received power recorded for each antenna on each collar at each base-station over the total observation time is shown in Figure 9. For diversity advantage to be realised the fluctuation of received power in the two channels must be decorrelated. The correlation coefficient ρX,Y between two random variables X and Y with expected values μX and μY and standard deviations σX and σY is: , (()( )) cov(, )XY XY XY XY EX Y XY (1) where E denotes the statistical expectation and cov denotes the covariance [19]. The correlation coefficients between the signals received by antennas mounted on the same collar are presented in Table 1. The definition of correlation (Equation 1) excludes any constant (LOS) component which explains the low values. The probability distribution of the received signal from a particular mobile antenna to a particular base- station might be expected to be close to Ricean as a result of multipath propagation with a strong LOS component. The Ricean distribution is given by: 22 222 () (0,0 () 2 0( r o rrA A eI forAr pr for r ) 0) (2) Table 1. Correlation coefficient for signals received by dif- ferent antennas on a single collar. Base Station Collar Correlation Coefficient between A1 and A2 BS 1 Collar 1 0.2407 Collar 2 0.0414 BS 2 Collar 1 –0.0733 Collar 2 0.0158 Copyright © 2009 SciRes. WSN 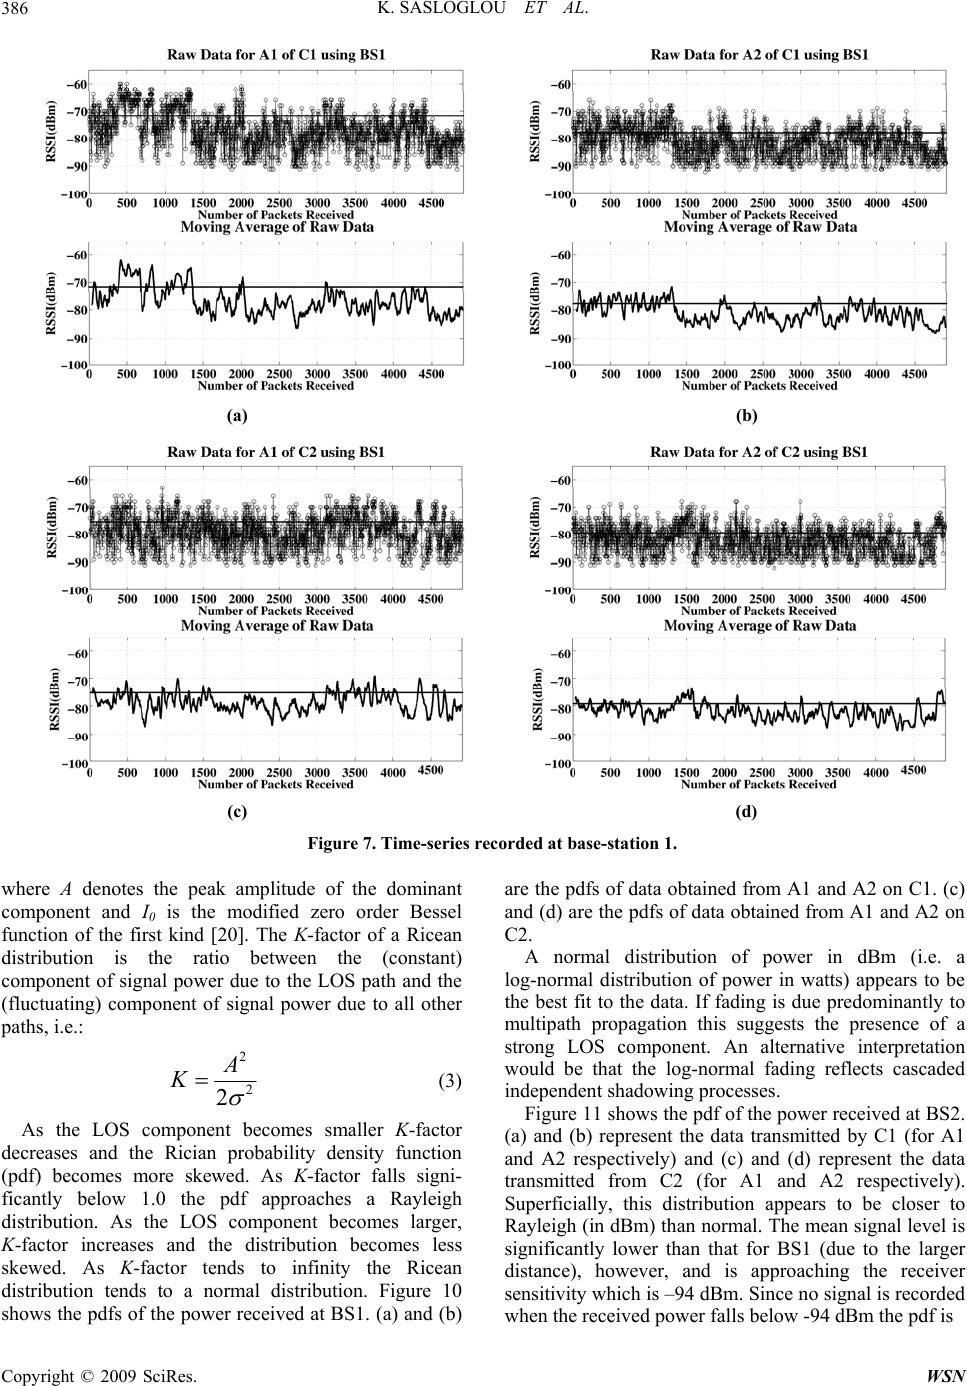 K. SASLOGLOU ET AL. 386 (a) (b) (c) (d) Figure 7. Time-series recorded at base-station 1. where A denotes the peak amplitude of the dominant component and I0 is the modified zero order Bessel function of the first kind [20]. The K-factor of a Ricean distribution is the ratio between the (constant) component of signal power due to the LOS path and the (fluctuating) component of signal power due to all other paths, i.e.: 2 2 2 A K (3) As the LOS component becomes smaller K-factor decreases and the Rician probability density function (pdf) becomes more skewed. As K-factor falls signi- ficantly below 1.0 the pdf approaches a Rayleigh distribution. As the LOS component becomes larger, K-factor increases and the distribution becomes less skewed. As K-factor tends to infinity the Ricean distribution tends to a normal distribution. Figure 10 shows the pdfs of the power received at BS1. (a) and (b) are the pdfs of data obtained from A1 and A2 on C1. (c) and (d) are the pdfs of data obtain ed from A1 and A2 on C2. A normal distribution of power in dBm (i.e. a log-normal distribution of power in watts) appears to be the best fit to the data. If fading is due predominantly to multipath propagation this suggests the presence of a strong LOS component. An alternative interpretation would be that the log-normal fading reflects cascaded independent shadowing processes. Figure 11 shows the pdf of the power received at BS2. (a) and (b) represent the data transmitted by C1 (for A1 and A2 respectively) and (c) and (d) represent the data transmitted from C2 (for A1 and A2 respectively). Superficially, this distribution appears to be closer to Rayleigh (in dBm) than normal. The mean signal level is significantly lower than that for BS1 (due to the larger distance), however, and is approaching the receiver sensitivity which is –94 dBm. Since no sign al is record ed when the received power falls below -94 dBm the pdf is Copyright © 2009 SciRes. WSN  K. SASLOGLOU ET AL. 387 (a) (b) (c) (d) Figure 8. Time-series recorded at base-station 2. effectively truncated at this level. It seems likely, therefore, that the pdf of the underlying signal is normal (in dBm) even though the pdf of the recorded (truncated) signal is skewed. The corresponding cum ul ative distribution functions (cdfs) are presented i n Figures 12 and 13 . The best-fit norm al curves along with 95% confidence intervals are superimposed. The close fit of the normal distribution for the data logged at BS1 is apparent. The fit is less good for the data obtained from BS2. Figures 14 and 15 show similar plots for received voltage. Figure 16 represents similar data to that presented in Figures 7 and 8 but of shorter time duration (approxi- mately 40 minutes). The advantage of the use of base-station diversity is especially apparent in this data. Figures 16(a) and (b) represent the power received at BS1 and BS2, respectively, from the signal transmitted from A1 on C1. Figures 16(c) and (d) represent the power received at BS1 and BS2, respectively, from the signal transmitted from A2 on C1. Figure 9. Peak-to-peak variation of received power at each individual antenna. (From left to right, BS1C1A1, BS1C1A2, BS1C2A1, BS1C2A2, BS2C1A1, BS2C1A2, BS2C2A1, BS2C2A2.) Copyright © 2009 SciRes. WSN  K. SASLOGLOU ET AL. 388 (a) (b) (c) (d) Figure 10. Pdfs of power (dBm) at BS1 for (a) A1 on C1, (b) A2 on C1, (c) A1 on C2 and (d) A2 on C2. (Smooth curve repre- sents the best-fit normal distribution.) (a) (b) (c) (d) Figure 11. Pdfs of power (dBm) at BS2 for (a) A1 on C1, (b) A2 on C1, (c) A1 on C2 and (d) A2 on C2. (Smooth curve repre- sents the best-fit normal distribution.) Copyright © 2009 SciRes. WSN  K. SASLOGLOU ET AL.389 (a) (b) (c) (d) Figure 12. Cdfs of power (dBm) at BS1 for (a) A1 on C1, (b) A2 on C1, (c) A1 on C2 and (d) A2 on C2. (Smooth curve repre- sents the best-fit normal distribution.). (a) (b) (c) (d) Figure 13. Cdfs of power (dBm) at BS2 for (a) A1 on C1, (b) A2 on C1, (c) A1 on C2 and (d) A2 on C2. (Smooth curve repre- sents the best-fit normal distribution.) Copyright © 2009 SciRes. WSN  K. SASLOGLOU ET AL. Copyright © 2009 SciRes. WSN 390 (a) (b) (c) (d) Figure 14. CDFs of detected voltage at BS1 for (a) A1 on C1, (b) A2 on C1, (c) A1 on C2 and (d) A2 on C2. (Smooth curve represents the best fit log-normal distribution.). (a) (b) (c) (d) Figure 15. CDFs of detected voltage at BS2 for (a) A1 on C1, (b) A2 on C1, (c) A1 on C2 and (d) A2 on C2. (Smooth curve represents the best fit log-normal distribution.). 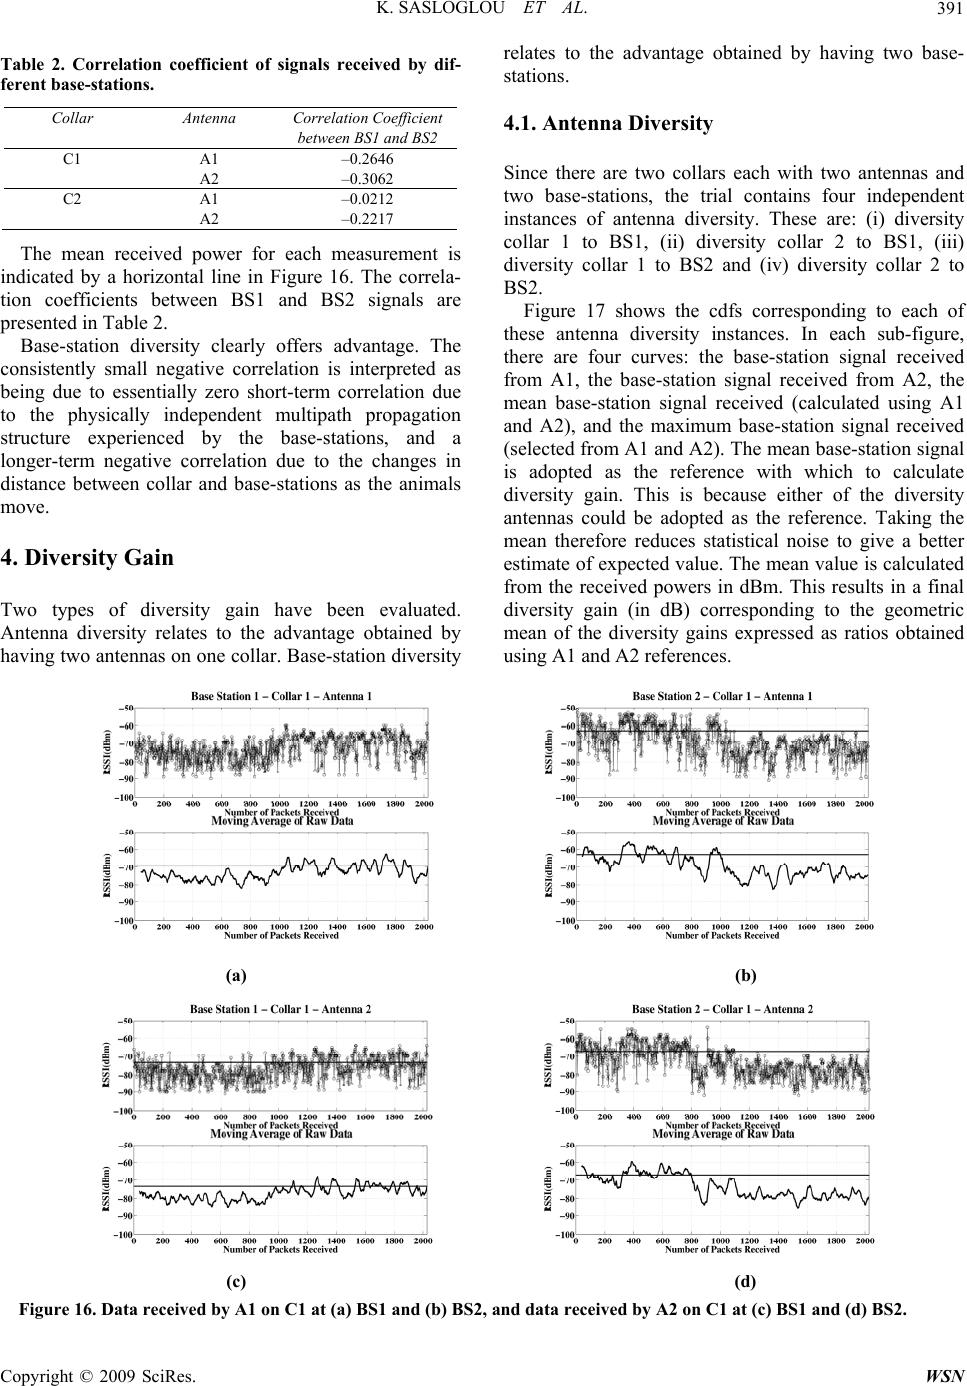 K. SASLOGLOU ET AL. 391 Table 2. Correlation coefficient of signals received by dif- ferent base-stations. Collar Antenna Correlation Coefficient between BS1 and BS2 C1 A1 –0.2646 A2 –0.3062 C2 A1 –0.0212 A2 –0.2217 The mean received power for each measurement is indicated by a horizontal line in Figure 16. The correla- tion coefficients between BS1 and BS2 signals are presented in Table 2. Base-station diversity clearly offers advantage. The consistently small negative correlation is interpreted as being due to essentially zero short-term correlation due to the physically independent multipath propagation structure experienced by the base-stations, and a longer-term negative correlation due to the changes in distance between collar and base-stations as the animals move. 4. Diversity Gain Two types of diversity gain have been evaluated. Antenna diversity relates to the advantage obtained by having two antennas on one collar. Base-station diversity relates to the advantage obtained by having two base- stations. 4.1. Antenna Diversity Since there are two collars each with two antennas and two base-stations, the trial contains four independent instances of antenna diversity. These are: (i) diversity collar 1 to BS1, (ii) diversity collar 2 to BS1, (iii) diversity collar 1 to BS2 and (iv) diversity collar 2 to BS2. Figure 17 shows the cdfs corresponding to each of these antenna diversity instances. In each sub-figure, there are four curves: the base-station signal received from A1, the base-station signal received from A2, the mean base-station signal received (calculated using A1 and A2), and the maximum base-station signal received (selected from A1 and A2). The mean base-station signal is adopted as the reference with which to calculate diversity gain. This is because either of the diversity antennas could be adopted as the reference. Taking the mean therefore reduces statistical noise to give a better estimate of expected value. The mean value is calculated from the received powers in dBm. This results in a final diversity gain (in dB) corresponding to the geometric mean of the diversity gains expressed as ratios obtained using A1 and A2 re fer ences. (a) (b) (c) (d) Figure 16. Data received by A1 on C1 at (a) BS1 and (b) BS2, and data received by A2 on C1 at (c) BS1 and (d) BS2. Copyright © 2009 SciRes. WSN 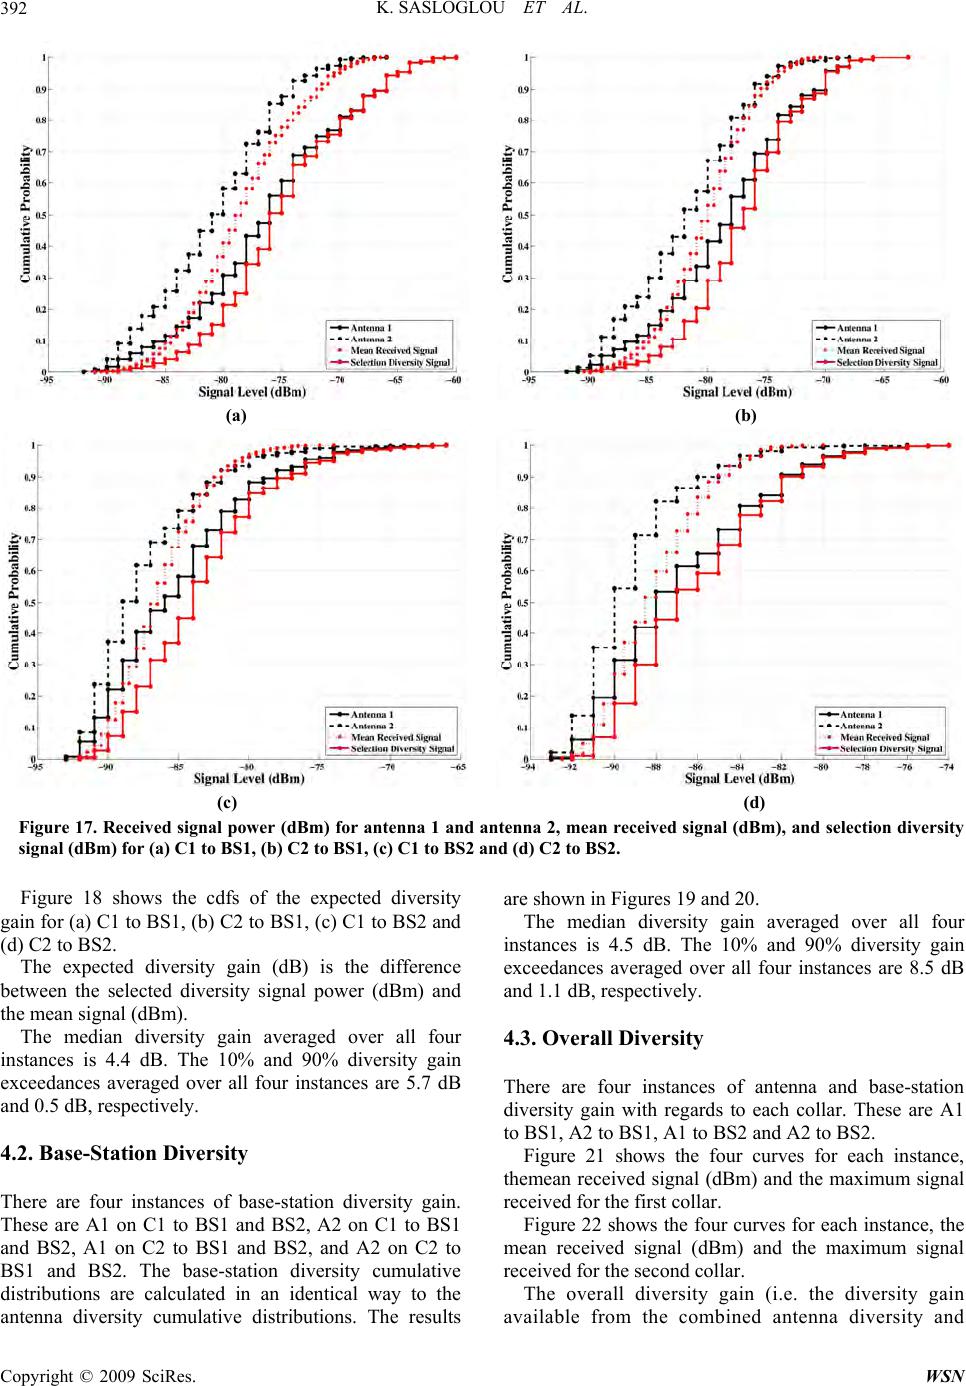 K. SASLOGLOU ET AL. 392 (a) (b) (c) (d) Figure 17. Received signal power (dBm) for antenna 1 and antenna 2, mean recei ved signal (dBm), and selection diversity signal (dBm) for (a) C1 to BS1, (b) C2 to BS1, (c) C1 to BS2 and (d) C2 to BS2. Figure 18 shows the cdfs of the expected diversity gain for (a) C1 to BS1, (b) C2 to BS1, (c) C1 to BS2 and (d) C2 to BS2. The expected diversity gain (dB) is the difference between the selected diversity signal power (dBm) and the mean signal (dBm). The median diversity gain averaged over all four instances is 4.4 dB. The 10% and 90% diversity gain exceedances averaged over all four instances are 5.7 dB and 0.5 dB, respectively. 4.2. Base-Station Diversity There are four instances of base-station diversity gain. These are A1 on C1 to BS1 and BS2, A2 on C1 to BS1 and BS2, A1 on C2 to BS1 and BS2, and A2 on C2 to BS1 and BS2. The base-station diversity cumulative distributions are calculated in an identical way to the antenna diversity cumulative distributions. The results are shown in Figures 19 and 20. The median diversity gain averaged over all four instances is 4.5 dB. The 10% and 90% diversity gain exceedances averaged over all four instances are 8.5 dB and 1.1 dB, respectively. 4.3. Overall Diversity There are four instances of antenna and base-station diversity gain with regards to each collar. These are A1 to BS1, A2 to BS1, A1 to BS2 and A2 to BS2. Figure 21 shows the four curves for each instance, themean received signal (dBm) and the maximum signal received for the first collar. Figure 22 shows the four curves for each instance, the mean received signal (dBm) and the maximum signal received for the second collar. The overall diversity gain (i.e. the diversity gain available from the combined antenna diversity and Copyright © 2009 SciRes. WSN 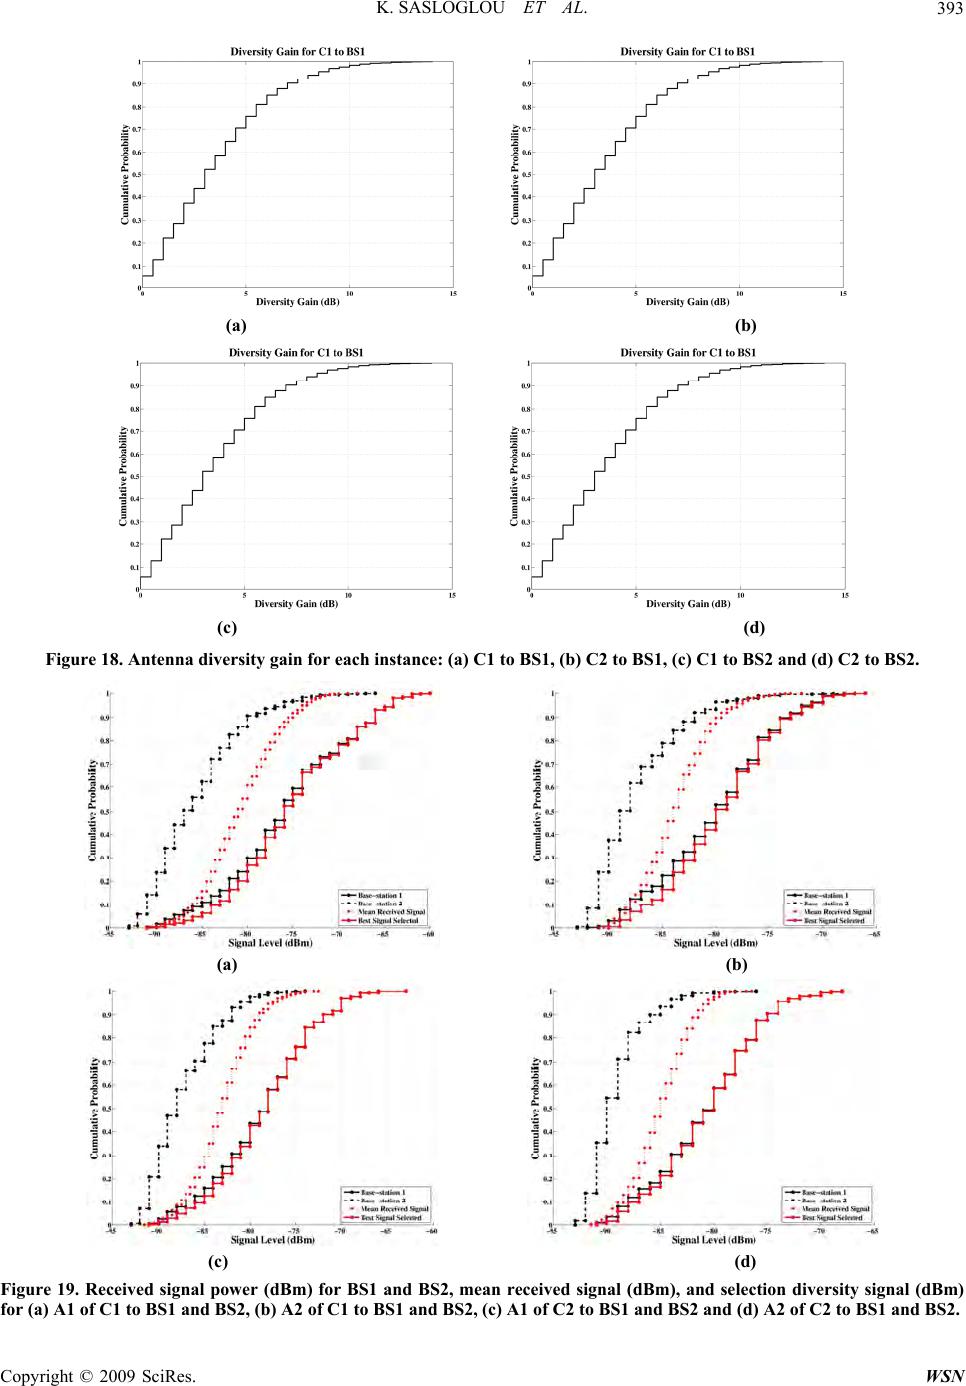 K. SASLOGLOU ET AL. 393 (a) (b) (c) (d) Figure 18. Antenna diversity gain for each instance: (a) C1 to BS1, (b) C2 to BS1, (c) C1 to BS2 and (d) C2 to BS2. (a) (b) (c) (d) Figure 19. Received signal power (dBm) for BS1 and BS2, mean received signal (dBm), and selection diversity signal (dBm) for (a) A1 of C1 to BS1 and BS2, (b) A2 of C1 to BS1 and BS2, (c) A1 of C2 to BS1 and BS2 and (d) A2 of C2 to BS1 and BS2. Copyright © 2009 SciRes. WSN 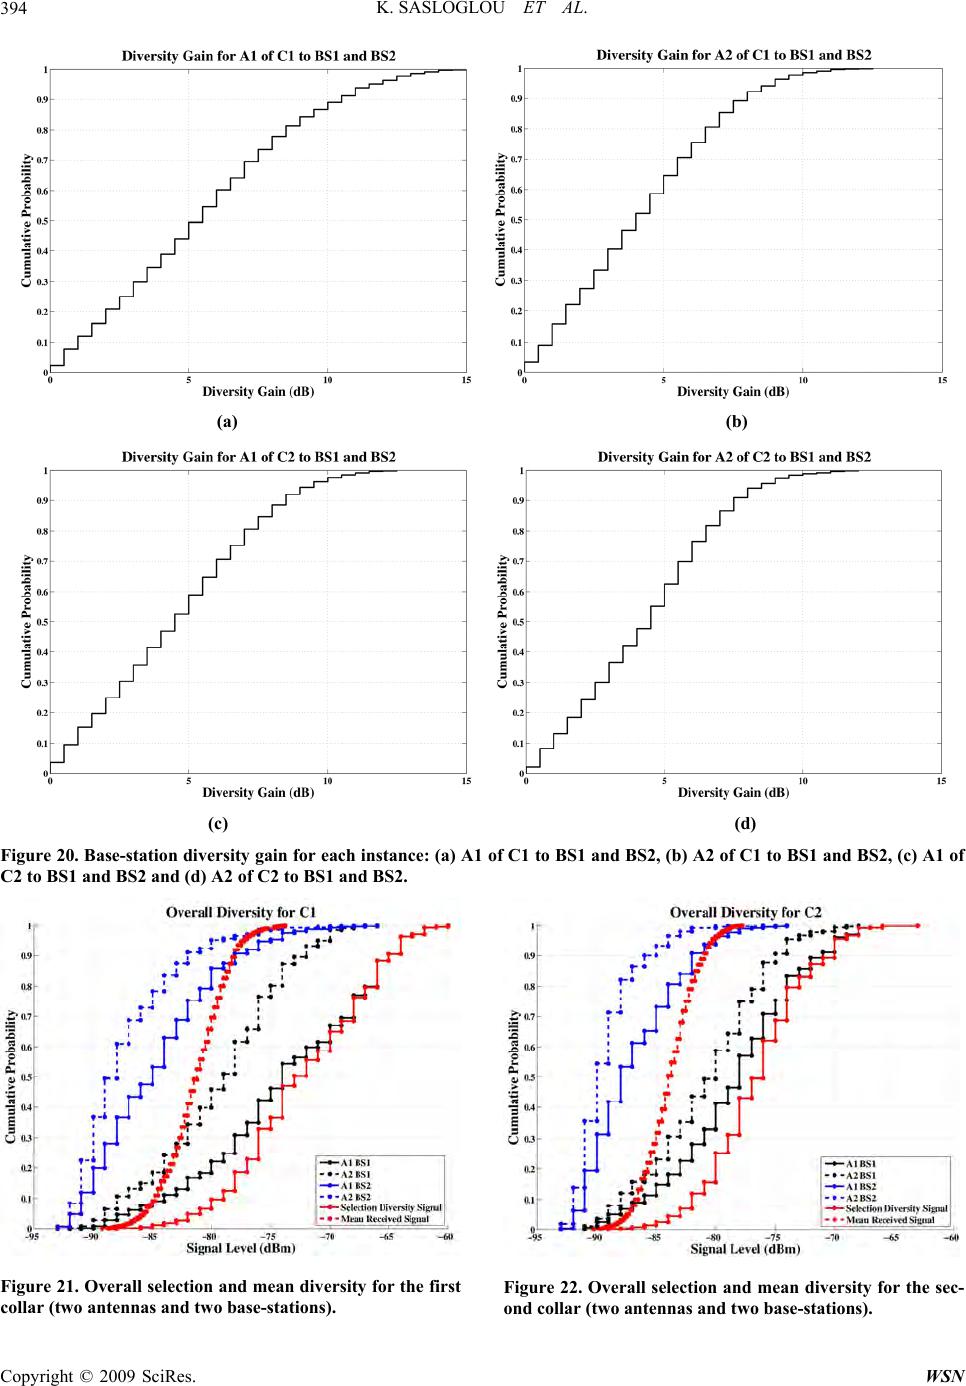 K. SASLOGLOU ET AL. Copyright © 2009 SciRes. WSN 394 (a) (b) (c) (d) Figure 20. Base-station diversity gain for each instance: (a) A1 of C1 to BS1 and BS2, (b) A2 of C1 to BS1 and BS2, (c) A1 of C2 to BS1 and BS2 and (d) A2 of C2 to BS1 and BS2. Figure 21. Overall selection and mean diversity for the first collar (two antennas and two base-stations). Figure 22. Overall selection and mean diversity for the sec- ond collar (two antennas and two base-stations).  K. SASLOGLOU ET AL.395 Figure 23. Overall diversity gain for the first collar. Figure 24. Overall diversity gain for the second collar. Figure 25. Mean overall diversity gain for the two collars. base-station diversity) for the first and second collar is shown in Figure 23 and 24, r espectively. The median overall diversity gain for the first and second collar is 8.1 dB and 7 dB, respectively. The 10% exceedances are 14.3 and 11.2 dB for the first and second collar, respectively. The 90% exceedances are 4.1 dB for the first and 3.5 dB for the second collar, respectively. The mean overall diversity gain is shown in Figure 25. This is the mean value calculated from the two individual collar diversity gains. The median overall mean div ersity is 7.9 dB. The 10% and 90% diversity gain exceedances are 11.6 dB and 5. 1 dB , respectively. 5. Conclusions Antenna and base-station diversity has been applied to the wireless monitoring of farm animals. The statistical distributions of received signals and antenna/base-station signal correlations have been summarised. The advan- tage offered by selection diversity has been evaluated. The overall (antenna and base-station) diversity gain offered at each collar has also been studied. 6. References [1] I. F. Akyildiz, W. L. Su, Y. Sankarasubramaniam, and E. Cayirci, “Wireless sensor networks: A survey,” Vol. 38, No. 4, pp. 393–422, March 2002. [2] The Defense Advanced Research Projects Agency (DARPA), Self-healing minefield, http://www.darpa.mil/ sto/ smallunitops/shm/index.htm. [3] K. S. Low, W. N. N. Win, and M. J. Er, “Wire less sensor networks for industrial environments,” In Computational Intelligence for Modelling, Control and Automation, 2005 and International Conference on Intelligent Agents, Web Technologies and Internet Commerce, International Conference on, Vol. 2, pp. 271–276, November 28–30, 2005. [4] S. Y. Lau, T. H. Chang, S. Y. Hu, H. J. Huang, L. de Shyu, C. M. Chiu, and P. Huang, “Sensor networks for everyday use: The bl-live experience,” In Proceedings of IEEE International Conference on Sensor Networks, Ubiquitous, and Trustworthy Computing, Vol. 1, pp. 336–343, 2006. [5] E. Callaway, P. Gorday, L. Hester, J. A. Gutierrez, M. Naeve, B. Heile, and V. Bahl, “Home networking with IEEE 802.15.4: A developing standard for low-rate wireless personal area networks,” Vol. 40, No. 8, pp. 70– 77, August 2002. [6] J. K. Hart, K. Martinez, and R. Ong, “Environmental sensor networks,” Vol. 37, No. 8, 2004. [7] A. Mainwaring, J. Polastre, R. Szewczyk, D. Culler, and J. Anderson, “Wireless sensor networks for habitat monitoring,” In Proceedings of the ACM International Workshop on Wireless Sensor Networks and Applica- Copyright © 2009 SciRes. WSN  K. SASLOGLOU ET AL. Copyright © 2009 SciRes. WSN 396 tions (WSNA’02), Atlanda, USA, 2002. [8] H. G. Goh, M. L. Sim, and H. T. Ewe, “An overview of rice field monitoring using wireless sensor networks and mobile internet application,” In Proceedings of the 8th International Conference on Electronics, Information and Communication (ICEIC’06), Vol. 1, pp. 114–117, Ulaanbaatar, Mongolia, June 2006. [9] Wireless mobile ad-hoc sensor networks for very large scale cattle monitoring, Berlin, Germany, August 2006. [10] J. Burrell, T. Brooke, and R. Beckwith, “Vineyard computing: Sensor networks in agricultural production,” Vol. 3, No. 1, pp. 38–45, 2004. [11] K. Mayer, K. Taylor, and K. Ellis, “Cattle health monitoring using wireless sensor networks,” In The 2nd IASTED International Conference on Communication and Computer Networks, November 2004. [12] P. Zhang, C. M. Sadler, S. A. Lyon, and M. Martonosi, “Hardware design experiences on zebranet,” In Proceed- ings of SenSys, Baltimore, Maryland, USA, 2004. [13] I. McCauley, B. Matthews, L. Nugent, A. Mather, and J. Simons, “Wired pigs: Ad-hoc wireless sensor networks in studies of animal welfare,” In Proceedings of EmNetS-II Embedded Networked Sensors The Second IEEE Workshop on, pp. 29–36, May 30–31, 2005. [14] Y. Guo, P. Corke, G. Poulton, T. Wark, G. Bishop- Hurley, and D. Swain, “Animal behaviour understanding using wireless sensor networks,” In Local Computer Networks, Proceedings 2006 31st IEEE Conference on, pp. 607–614, November 2006. [15] P. Corke and P. Sikka, “Results from the farm,” http://eecs.harvard.edu/emnets/papers/corkeEmnets06.pdf (Last accessed on 24/02/08). [16] K. Sasloglou, I. A. Glover, Kae-Hsiang Kwong, and I. Andonovic, “Wireless sensor network for animal monitoring using both antenna and base-station diversity,” In Proceedings of 11th IEEE Singapore International Conference on Communication Systems ICCS 2008, pp. 27–33, November 19–21, 2008. [17] http://www.xbow.com, (Last accessed on 18th May 2008). [18] http://www.hyperlinktech.com, (Last accessed on 18th May 2008). [19] A. Papoulis, “Probability, random variables, and stochastic processes,” Mc-Graw Hill, third Edition, 1991. [20] T. S. Rappaport, “Wireless communications principles and practices,” Prentice Hall PTR, second Edition, 2002.
|