Int'l J. of Communications, Network and System Sciences
Vol.3 No.2(2010), Article ID:1272,6 pages DOI:10.4236/ijcns.2010.32025
Online Detection of Network Traffic Anomalies Using Degree Distributions
Department of Computer Science, Wuhan University of Science & Technology, Wuhan, China
Email: wzwang888@163.com, wwdtylwt@163.com
Received October 19, 2009; revised December 24, 2009; accepted January 10, 2010
Keywords: Anomaly Detection, Degree Distributions, Entropy
Abstract
Diagnosing traffic anomalies rapidly and accurately is critical to the efficient operation of large computer networks. However, it is still a challenge for network administrators. One problem is that the amount of traffic data does not allow real-time analysis of details. Another problem is that some generic detection metrics possess lower capabilities on diagnosing anomalies. To overcome these problems, we propose a system model with an explicit algorithm to perform on-line traffic analysis. In this scheme, we first make use of degree distributions to effectively profile traffic features, and then use the entropy to determine and report changes of degree distributions, which changes of entropy values can accurately differentiate a massive network event, normal or anomalous by adaptive threshold. Evaluations of this scheme demonstrate that it is feasible and efficient for on-line anomaly detection in practice via simulations, using traffic trace collected at high-speed link.
1. Introduction
Anomalies are unusual and significant changes in a network’s traffic levels, which can create congestion in the network and stress resource utilization in a router. Network operators need to accurately detect traffic anomalies in a timely fashion. Without this kind of capability, networks are not able to operate efficiently or reliably. Researchers have approached traffic anomaly detection using various techniques from simple volume-based analysis [1–3] to network flow distribution-based analysis [4]. While recent studies demonstrate that entropybased anomaly detection obviously has some advantages [5]. This approach is to capture fine-grained patterns in traffic distributions that simple volume based metrics cannot identify. What's more, the use of entropy for tracking changes in traffic distributions provides two significant benefits. First, the use of entropy can increase the sensitivity of detection to uncover anomalies incidents that may not manifest as volume anomalies. Second, using such traffic features provides additional diagnostic information into the nature of the anomalous incidents (e.g., making distinction among worms, DDoS attack, and scans) that is not available from just volume-based anomaly detection.
In general, most researchers consider flow-header features (e.g., IP addresses, ports, and flow-sizes) as candidates for entropy based anomaly detection. However, Port and address distributions with pair-wise correlation scores greater than 0.95, which arises due to the nature of the underlying traffic patterns [6]. Intrinsically, the anomalies detected by the port and address distributions overlap significantly. Furthermore, anomalous scan, DoS, and P2P activity are not subtly detected by port and address distributions, or only high-magnitude events can be detect that would have appeared as traffic volume anomalies. Considering the limited utility of port and address distributions, we should select traffic distributions as candidates for entropy based anomaly detection with care, and in particular we should look beyond simple port and address based distributions.
In this work we propose an anomaly detection mechanism using degree distributions to improve the detect abilities of port and address. We use inand out-degree distributions to measure the number of distinct destination/source IP addresses that each host communicates with. For each value of in-degree (out-degree), we calculate the entropy to diagnose anomaly. Note that we chose source/destination IP addresses as unique candidate metric, not both address and port. There is no need to use different distributions of possessing same underlying properties to increase overheads of computation. To keep up with on-line traffic analysis, the essence to capture dynamic network traffic, we introduce a sliding windows mechanism with fixed time width.
The rest of this paper is organized as follows. Section 2 surveys related work. Section 3 briefly describes the basic theory of our detection scheme, including computation on the entropy values of degree distributions. Section 4 presents an overview of our scheme and describes the anomaly detection methodology. Section 5 evaluates the effectiveness of the proposed scheme. Section 6 concludes the paper.
2. Related Work
Anomaly detection has been studied widely, and has received considerable attention recently. Most of the work in the recent research and commercial literature (for e.g., [7–9]) has treated anomalies as deviations in the overall traffic volume (number of bytes or packets). Volume based detection schemes have been successful in isolating large traffic changes (such as bandwidth flooding attacks), but a large class of anomalies do not cause detectable disruptions in traffic volume. In contrast, we demonstrate the utility of a more sophisticated treatment of anomalies, as events that alter the distribution of traffic features.
Nowadays, a number of works have focused on using traffic distributions to diagnose anomalies. Feinstein et al. [10] used the distribution of source addresses to detect DDoS attack. Similarly, Karamcheti et al. [11] used inverse distributions of packet contents to detect malicious network traffic and Thottan et al. [12] used statistical distribution of the individual MIB variables to detect abrupt changes of network traffic. We use degree distributions to effectively profile traffic features, which can capture abnormal changes of traffic in a sensitive manner.
A variety of statistical anomaly detection techniques have been proposed to detect network-wide anomalies. Particularly, the entropy-based approaches have been demonstrated the accuracy and efficiency in detecting anomalies in the traffic matrix time series. Lakhina et al. [8] used entropy and subspace methods to mine traffic anomalies from network wide traffic data repositories. Gu et al. [13] used maximum and relative entropy to develop a behavior-based anomaly detection method. In [13], the maximum entropy-based baseline distribution is constructed from pre-labeled training data, but how this baseline is adapting itself to the dynamics of network traffic remains unclear. We propose a mechanism to construct adaptive baseline according to the dynamic network traffic during the measurement period, and adjust the baseline in a particular time span.
Online detection of anomalies suffers to compute realtime statistic from the large of traffic data. Xu et al. [14] used 5-tuple flow distribution (i.e., srcaddr, dstaddr, srcport, dstport, protocol) to do traffic analysis leads to intensive memory and high overhead on processing capacity. Some online intrusion detection systems, such as FlowMatrix [15] and Snort [16] match packets to a pre-defined set of rules, making them unable to detect unknown anomalies. In contrast, we consider the high correlation of address and port, and use address as unique metric, instead of 5-tuple, to compute entropy values of degree distributions for detecting anomalies. Our scheme not only alleviate overhead of computing during online analysis stage, but outperform rule-based approaches to uncover new anomaly types.
3. The Basic Theory
As we know, most traffic anomalies share a common characteristic [17]: they induce abnormal change in flow-header features distribution, such as source and destination addresses and ports, which show dispersed or concentrated distribution.
For example, Figure 1 displays flow-header features distribution of three types of attacks (graphs (a) (b) (c)). Let us highlight some interesting cases of graphs. Figure 1(a) displays a typical distributed denial-of-service (DDoS) attack. In such cases, a lot of hosts send traffic towards a particular (single) host. Similarly, many Internet worms spread by sending random probes (i.e., towards randomly generated a great number of destination IP addresses) from an infected computer to infect other vulnerable computers (Figure 1(b)). In some scan events, a single host scanning the random destination host or a set of random source host scanning a single destination host (Figure 1(c)).
We can conclude some information from the above analysis: In each type of attack, the source or destination
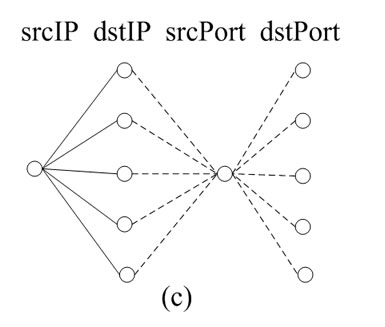
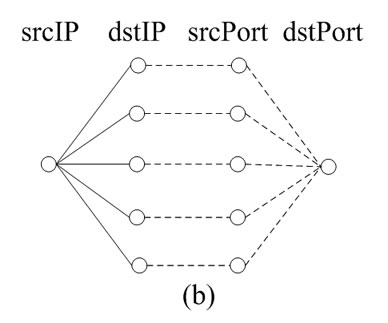
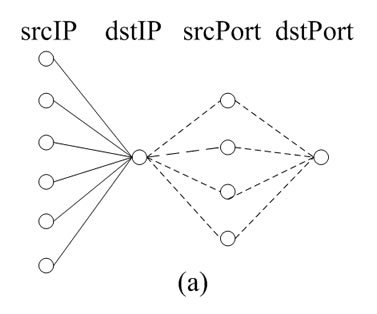
Figure 1. Source/destination IPs and ports distribution patterns of Anomalous events.
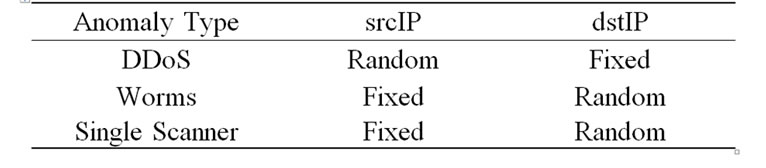
Table 1. IP distributions of anomalous events.
addresses present random or fixed state (shown in Table 1). One may naturally wonder 1) what metrics can accurately profile these anomaly traffic features, and obviously indicate the occurrence of such attacks mentioned above; 2) how to effectively quantify the magnitude of anomaly, and expose unusual traffic behavior.
From the Figure 1(a), we know six source hosts connect a specific destination host. Figure 1(b) illustrates a single source host connects five destination hosts. These inspired us to introduce inand out-degree distributions to state relationship of source and destination address. For an end-host X, the out-degree is the number of distinct IP addresses that X contacts, and the in-degree is the number of distinct IP addresses that contact X. For example, in-degree of the destination host is six in Figure 1(a), out-degree of the source host is five in Figure 1(b).
Intuitively, inand out-degree can effectively encapsulate and capture features of the underlying traffic distribution. In addition, entropy is an appropriate metric to manifest dispersed or concentrated state of degree distribution. The more concentrated it is, the less entropy values it is, or vice versa. Naturally, we use the entropy to determine and report changes of degree distributions, which changes of entropy values can sensitively represent variation of traffic feature distribution and designate unusual changes as an anomaly.
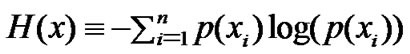
The natural definition of entropy in the context of this paper is the expression as follows:
 (1)
(1)
where x1, ..., xN is the range of values for random variable X, and p(xi) represents the probability that X takes the value xi. For each value of in-degree (out-degree) xi, we calculate the probability
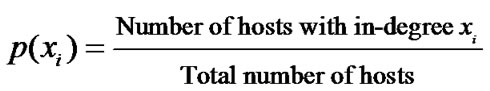 (2)
(2)
Useless otherwise specified, all log function in this paper are to the base 2 and we define 0log0 = 0.
Often it is useful to normalize the value to expediently compare entropy across different measurement periods. For this purpose, we define the standardized entropy (between zero and one) to be H/log t, where t is the number of distinct in-degree (similarly out-degree) values observed during the measurement interval.
4. Diagnosis Methodology
In this section, we first give an overview of the system model and the design notion of our scheme. Second, we describe our strategy of adaptive detection threshold setup. Then we present a proper algorithm for computing the entropy and self-adjusting the threshold to raise an alert when attacks happed. Finally, we show how our scheme works in detail.
4.1. System Model
The overall architecture of our scheme consists of three main functional parts: the processing engine (backend), database and WebGUI (front end). The processing engine carries out an explicit algorithm for communicating between WebGUI and database. The engine implement several aspects of task as follows: 1) it received NetFlow [18] records from capable source, such as routers, switches, firewalls, etc. in a particular manner, and store the data across a buffer into the database, 2) it obtained associated parameters are available to compute entropy values of degree distributions from the raw traffic statistics by using a single SQL query. This is a major benefit of keeping the raw traffic statistics in a database, 3) it can automatically adjust detection threshold according to the network state during the measurement period. The database provides structured storage for the traffic statistics and simplifies the computation about entropy values of degree distributions. The WebGUI frontend provides the flexibility of detection result graphically display.
4.2. Adaptive Detection Threshold Setup
To diagnosis anomalies, we must find a way to clearly differentiate network anomalies from normal behavior. Therefore we introduce a baseline method, which first define baseline values to represent steady “normal” behavior, and non-steady behavior which deviate from the baseline are then flagged at those points in time. But how far the deviation may be identified as anomalies we should take a further analysis.
During the measurement period, we first compute entropy values of degree distributions in each time interval, and then compute mean entropy as baseline in a particular time span. In addition, we use variance to reflect deviation between normal and abnormal behavior.
Let us assume, the measured entropy Y be a random variable with mean  and
and . Then, the Chebyshev inequality states that:
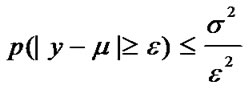 ,
, (3)
(3)
Therefore, we can define a band of  as a normal region, where the proportion of observed entropy values falling in the region is at least 75%. Namely, the threshold is
 . Beyond this normal region, the entropy represents traffic events is anomalous and assigned a severity level depending upon its deviation from the normal region.
Network traffic may change in different time or date. So the baseline will be changeable. One problem is how to automatically adjust the baseline to fit the normal behavior. From our experience, we determine a fixed time span (i.e., 30minutes) to self-adjust baseline according to network environment.
4.3. Algorithm
To keep up with on-line traffic analysis, our algorithm must be lightweight in terms of both store and retrieve data. Firstly, we design a buffer between data source and database to leverage store and retrieve. Secondly, considering many attacks today are only several minutes in duration, such as DDoS attacks generally last for only two minutes, we set a short time window (i.e.,30s) with limited (srcaddr, dstaddr) records to achieve high detection resolution and relatively low constraints on speed of store data and query database.
Conceptually, the algorithm can be divided into three stages. In the first stage we configure Netflow to page out traffic statistic in specific time span, and pre-define a threshold according to the training data to rule out anomalous entropy values, so as to accurately calibrate baseline during the measurement period. Note that adaptive threshold takes into effect in the detection process. In the second stage, processing stage, we repeatedly compute entropy values in fixed time interval with a sliding window. In the post-processing stage, we setup threshold by calculating mean entropy and variance for the next detection process. The pseudo code for this algorithm is shown in Algorithm 1.

4.4. Implementation Details
There are two working procedure in our anomaly detection scheme: deployment and measurement. First, our scheme must be deployed properly, such that it receives NetFlow records on available measurement network. We should configure internal NetFlow sources that handle traffic from corporate hosts to Internet and vice versa such as routers, switches and firewalls to export NetFlows to the processing engine server. For best result and more visibility make sure those sources deal with clear, not NATed traffic. Second, we assume that training traffic is devoid of any attack and the characterization of traffic features acts as a normal profile. The normal profile is used to calculate the pre-define thresholds. And then our scheme enters fully operational mode. In this mode the threshold is constantly compared with the current entropy value of degree distributions derived from incoming NetFlows. Alarms are generated if the entropy values differ beyond allowed tolerances. Note that associated thresholds are self-adjustable as they’re calculated by the processed data itself (NetFlows) in particular time span and periodically update thresholds without requiring dedicated periodic training interval.
5. Performance Evaluation
To evaluate the effectiveness and performance of our scheme, implemented a software prototype that measures the entropy values of inand out-degree and have tested it with real world traffic traces.
The traces we used were drawn from cisco 7609 router at our university’s modern education information center, which handle three campus traffics exchanging with the commodity ISPs (Internet Service Provider). The time of-capture of analyzed traces was selected so that our methodology could be tested against a variety of network conditions.
Throughout our experimentation, both degree distributions show remarkable similarity except for few peaks. These exceptional entropy values represent magnitude of traffic feature’s distributional variations during the measurement period. We picked sample snapshots of time where peaks are observed, and show work mechanism of our scheme in the link measurements.
From the Figure 2, it can be observed that the normal traffic region between lower and upper bound are determined by the threshold in the detection process. Intrinsically, a threshold is directly determined by its baseline. Figure 2 shows the baseline of in-degree and out-degree respectively adjust at points A, B, C or D, E, F according to consecutive network state. Note that baselines are adapting themselves to the dynamics of network traffic by implementing algorithm 1 when our scheme enters fully operational mode. Once entropy values of some event changes in an arbitrary manner, the event was designated in time as an anomaly. In addition, by measuring
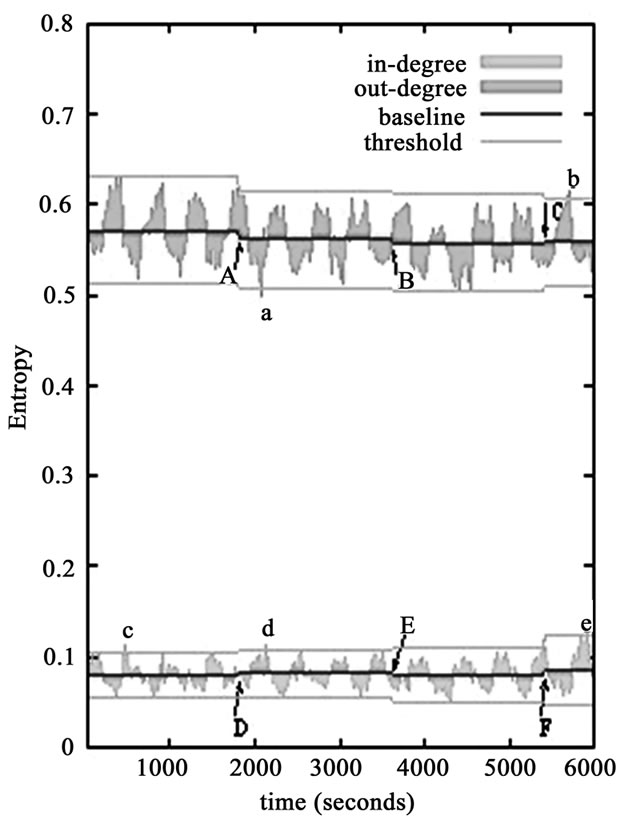
Figure 2. Sample snapshot of anomaly detection system.
the peak height and peak width of the entropy values in time series, one is able to begin to identify anomalous duration and relative intensity. Interestingly, such case happened at points a, b, c, d and e. At points c, d, e, there are peaks in entropy values of indegree but entropy values of out-degree do not show any corresponding peak. This observation has two implications. Firstly, the in-degree and out-degree are weakly correlated with each other. Secondly, entropy values of degree distributions are sensitive to these abnormal changes, even though subtle changes happened.
From the Figure 2, we also can conclude that while a network is not under attack, the entropy values for various degree distributions each fall in a narrow range. While the network is under attack, these entropy values exceed these ranges in a detectable manner.
In the following example, we choose two typical attacks which arouse traffic anomalies to validate efficiency of our approach in detail. Then we further discuss the reason for variation in entropy values of degree distributions.
Figure 3(a) shows the different changes before and during the worm outbreak. Before the outbreak time it can be seen that entropy values of inand out-degree vary in a permitted scale, since source addresses and destination addresses do not obviously appear dispersed or concentrated state. However, during the outbreak of the worm the degree distributions change massively. The most obvious is that inand out-degree plots change their values in different directions. Regarding the individual plots, it can be seen clearly that an obvious increase in entropy of out-degree at point f, while entropy values of
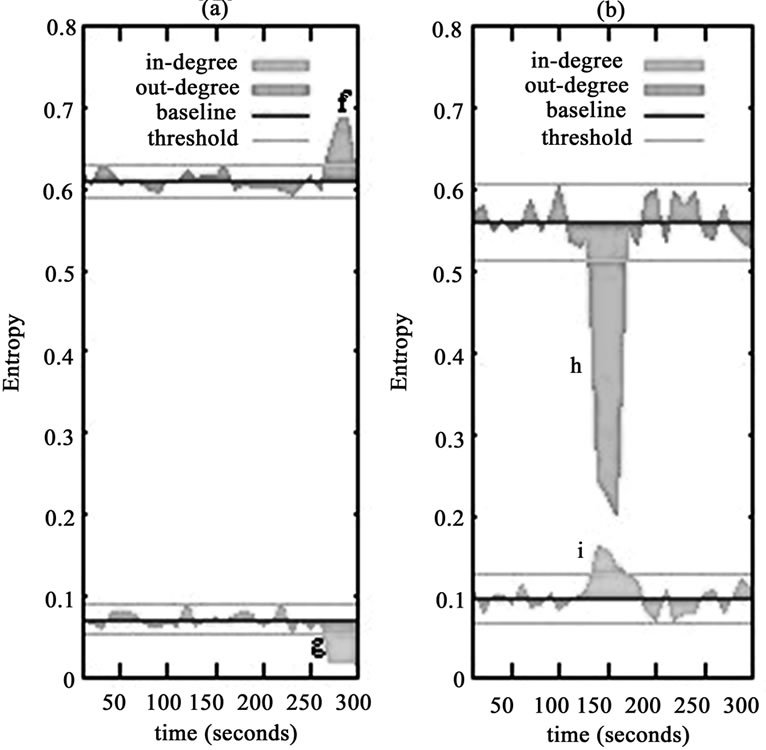
Figure 3. Examples of anomalies which we diagnose from link traffic.
in-degree leading to the opposite effect at point g. This divergent effect can be used to indicate worm anomalies or similar to worms. There is a persuasive reason behind this abnormal behavior. The change in IP address characteristics seen on a flow level (i.e. when packets belonging to a TCP connection or UDP data stream with same source/destination IP address is aggregated into one “flow”) is relatively intuitive: a smaller number of infected hosts scan and connect to other vulnerable hosts in a random fashion. As a result, these flows grow to be a significant part of the set of flows seen in total, which give cause for variation to the whole traffic features distribution. On one hand, the source IP addresses of the infected hosts can be seen in many flows and since they are relatively few hosts. It means that some source IP addresses seen in flows become more fixed than in normal traffic, but the other source IP addresses show more dispersed distribution in the mass, which leading to out-degree distribution more dispersed, and hence the entropy value of out-degree significantly increase. On the other hand the destination IP addresses seen in flows will be much more random than in normal traffic, which causes a lot of hosts with in-degree 1, and hence indegree distribution appears to be more concentrated, entropy value of in-degree tends to decrease obviously.
Figure 3(b) plots an outbound DDoS attacks last less one minute (from 140s to 170s). The presence of these anomalies presents an interesting view in the structure of flow level traffic. These attacks were floods of 40-byte TCP SYN packets destined for the same host or server. The flood was reported as many “degenerate” flows, having only one packet per flow. And the flood packets had a lot of random source addresses and a fixed destination address. As a result, traffic will demonstrate a dispersed distribution for source IP addresses, namely the majority of the hosts with out-degree 1 connect to the same external destination IP addresses. It means that out-degree distribution tends to be more concentrated than in normal traffic, which sharply decreases the entropy value of out-degree at point h. From low to high rate DDoS attacks, the destination IP addresses show a small variation. But the in-degree distribution in the mass still show more concentrated state than in normal traffic, and hence the increases of entropy in in-degree at point i. This can clearly explain the onslaught of DDoS events.
6. Conclusions
In this paper we present degree distributions for detecting network traffic anomalies in IP flow data collected at our University's border router. We evaluate the scheme on network-wide traffic anomalies, which resulting from unusual changes in the real-time traffic features. We showed how to use our scheme to diagnose anomalies from simple and readily available link measurements. Rigorous experiments on real-world traffic validate our scheme obviously possess the following advantages: 1) it is accurate and efficient enough to use a little flow header features for capturing fine-grained patterns in traffic distributions. These not only reduce the on-line processing time but increase the detection abilities. 2) The use of entropy can increase the sensitivity of detection to uncover well-known or unknown anomalies and quantify traffic anomalies. 3) An adaptive threshold is available to lower false alarm rate.
Our ongoing work is further analysis traffic anomalous features, and extending the methodology proposed here to diagnose additional network-wide anomalies. In addition, lower result report latency is one of problems we consider.
7. Acknowledgment
We thank the modern education information center at Wuhan University of Science and Technology for supplying the real world traffic to experiment, and providing some technology support by their network engineers. We are also grateful to Zhi Wang in network laboratory at college of computer science and technology for helpful discussion on the subject matter.
8. References
[1] A. Lakhina, M. Crovella, and C. Diot, “Characterization of network-wide anomalies in traffic flows (short paper),” In IMC, 2004.
[2] D. Brauckhoff, B. Tellenbach, A. Wagner, A. Lakhina, and M. May, “Impact of traffic sampling on anomaly detection metrics,” In Proceeding of ACM/USENIX IMC, 2006.
[3] P. Barford, J. Kline, D. Plonka, and A. Ron, “A signal analysis of network traffic anomalies,” In Proceeding of IMW, 2002.
[4] A. Wagner, and B. Platter, “Entropy based worm and anomaly detection in fast IP networks,” In Proceeding IEEE WETICE, 2005.
[5] A. Lakhina, M. Crovella, and C. Diot, “Mining anomalies using traffic feature distributions,” In Proceeding of ACM SIGCOMM, 2005.
[6] G. Nychis, V. Sekar, D. G. Andersen, H. Kim, and H. Zhang, “An empirical evaluation of entropy-based traffic anomaly detection,” In IMC, 2008.
[7] “Arbor networks,” At http://www.arbornetworks.com/.
[8] A. Lakhina, M. Crovella, and C. Diot, “Characterization of network-wide anomalies in traffic flows (Short Paper),” In IMC, 2004.
[9] “Riverhead networks,” At http://www.riverhead.com
[10] L. Feinstein, D. Schnackenberg, R. Balupari, and D. Kindred, “Statistical approaches to DDoS attack detection and response,” In Proceedings of the DARPA Information Survivability Conference and Exposition, 2003.
[11] V. Karamcheti, D. Geiger, Z. Kedem, and S. MuthukriShnan, “Detecting malicious network traffic using inverse distributions of packet contents,” In Proceeding of ACM SIGCOMM MineNet, 2005
[12] M. Thottan, and C. Ji, “Anomaly detection in IP networks,” In IEEE TRANSACTIONS ON SIGNAL PROCESSING, August 2003.
[13] Y. Gu, A. McCallum, and D. Towsley, “Detecting anomalies in network traffic using maximum entropy estimation,” In IMC, 2005.
[14] K. Xu, F. Wang, S. Bhattacharyya, and Z.-L. Zhang, “A real-time network traffic profiling system,” In DSN, 2007.
[15] “FlowMatrix,” At http://www.akmalabs.com/flowmatrix. php.
[16] M. Roesch, “Snort: Lightweight intrusion detection for networks,” In USENIX LISA, 1999.
[17] T Karagiannis, K Papagiannaki, and M Faloutsos, “BLINC: Multilevel traffic classification in the dark,” In Proceeding of ACM SIGCOMM, 2005.
[18] “CiscoNetflow,” At http://www.cisco.com/en/US/tech/tk 812/tsd_technology_support_technical_references_list.html.