Journal of Water Resource and Protection
Vol.10 No.09(2018), Article ID:87649,21 pages
10.4236/jwarp.2018.109056
Assessing Flood Hazard at River Basin Scale: Comparison between HECRAS-WMS and Flood Hazard Index (FHI) Methods Applied to El Maleh Basin, Morocco
Fatima Zahra Echogdali, Said Boutaleb*, Ahmed Elmouden, Mohammed Ouchchen
Laboratory of Applied Geology and Geo-Environment (LAGAGE), Ibn-Zohr University, Agadir, Morocco

Copyright © 2018 by authors and Scientific Research Publishing Inc.
This work is licensed under the Creative Commons Attribution International License (CC BY 4.0).
http://creativecommons.org/licenses/by/4.0/


Received: June 22, 2018; Accepted: September 27, 2018; Published: September 30, 2018
ABSTRACT
The cartography of floods by two different approaches enabled us to determine the limits and the advantages of each one of them. This cartography has been applied to the El Maleh basin situated in the South-East of Morocco. The HEC-RAS approach consists of a combination of the surface hydrologic model and the digital terrain model data. This combination allows thereafter the mapping of the flood zones by the use of the WMS software. Thus it can predict the probability occurrence of floods at various frequency times and determine the intensity of the flood (depth and velocity of flood water) inside the El Maleh river by using the existing hydrological data. Otherwise FHI method approach introduces a multi-criteria index to assess flood risk areas in a regional scale. Six parameters (flow accumulation, distance from drainage network, drainage network density, slope, land use, and geology) were used in this last method. The relative importance of each parameter for the occurrence and severity of flood has been connected to weight values. These values are calculated following an Analytical Hierarchy Process: AHP, a method originally developed for the solution of Operational Research problems. According to their weight values, information of the different parameters is superimposed, resulting to flood risk mapping. The use of the WMS model allowed us to accurately map the flood risk areas with precisely flood heights in different levels. However, this method is only applicable for a small portion of the basin located downstream of the hydrological station. Otherwise, the FHI method allows it to map the entire basin but without giving an indication of the water levels reached by floods. One method does not exclude the other since both approaches provide important information for flood risk assessment.
Keywords:
Flooding Hazard, El Maleh River, HEC-RAS and WMS, FHI Method

1. Introduction
Flood is considered to be the most common natural disaster worldwide during the past decades, producing many environmental and socio-economic consequences within the affected flood plain [1] [2] . A flood is an overflow of water that submerges land, and may cause damage to agricultural lands, urban areas, and may even result in loss of lives [3] [4] .
Flood hazard maps are useful tools for planning the future direction of city growth, and are usually used to identify flood-susceptible areas [5] . Flood zonation mapping and hazard analysis for different areas often involve multiple criteria/factors that have to be geographically related to one to another [6] .
Hydrodynamic modelling approaches have been used by various researchers to provide flood susceptibility mapping [7] . However, hydrological methods require fieldwork and huge budget for data collection [8] . Combination of HEC-RAS and GIS has a great capability in simulation of flood hazard zoning [9] [10] .
Geographic information system (GIS) and remote sensing (RS) techniques have also made significant contribution in natural hazard analysis [11] [12] . Many studies have been done on flood susceptibility mapping and flood analysis using GIS [13] [14] [15] .
Furthermore, Multi-criteria decision analysis (MCDA) has been recognized as an important tool for analyzing complex decision problems, which often involve incommensurable data or criteria [16] . MCDA methods could be employed to integrate technical, environmental and socio-economic objectives to achieve an optimal decision [17] .
Coupled MCDA-GIS approaches have been employed in spatial modelling and natural hazards analysis [18] . Different studies have demonstrated that these techniques can be used for generating hazard maps [19] [20] . Analytical hierarchy process (AHP) [21] is a popular technique in the field of multi-criteria decision analysis [22] . One of the important problems of the AHP method is the need for exploiting experts’ knowledge in assigning weights, which can be considered as a source of bias. However, the main aim of disaster management is to develop a transferable methodology that can be used globally [14] .
The main objective of this research is to compare between the flood hazard potential zones determined by using AHP and inundated areas determined by hydraulic model of HEC-RAS and WMS. The chosen basin to apply these two approaches is El Maleh river area situated in the south-east part of Morocco.
2. Materials and Methods
2.1. Study Area
The regional focus of this work is on the upper catchment of the oued Drâa in South-East of Morocco. The watershed of El Maleh basin covers an area of 794.3 km2. The surface elevation ranges between 1174 and 3617 m (Figure 1(a)). The total length of the study area is about 47 kilometers. The basin of El Maleh river is compact, with a Gravelius Index of 1.9 and characterized by a dense drainage network (Figure 2(a)). The both slopes of the basin are steeps: 0 to 33 degrees in general, but may be as high as a maximum of 70 to 89 degrees in some areas of the basin (Figure 2(b)). The yield of the maximum flood of the river can exceed

Figure 1. Geographic situation of El Maleh basin: (a) Digital Elevation Model (DEM); (b) Discharge hydrograms of El Maleh River.
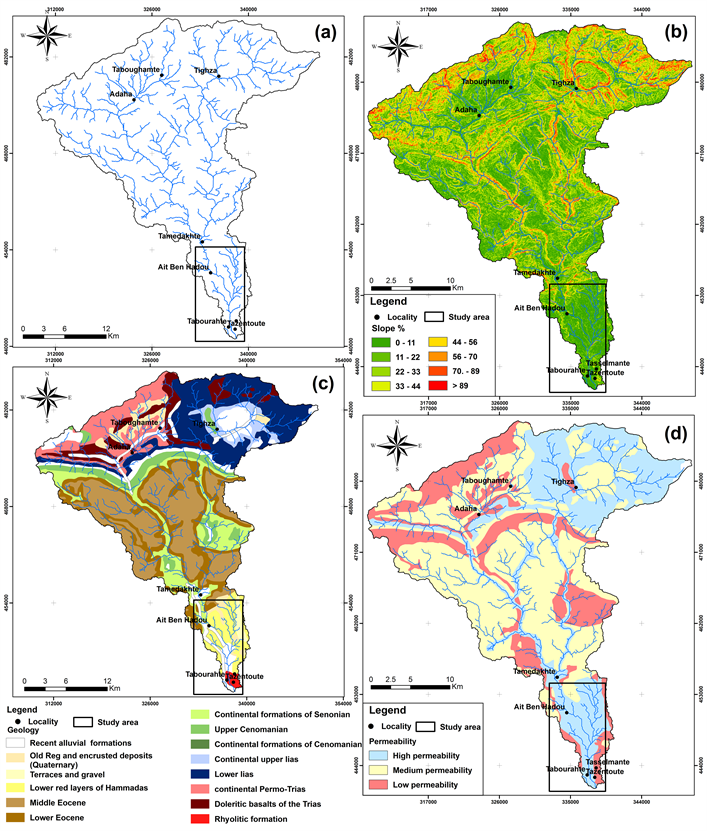
Figure 2. Physical characteristics of the study area: (a) Drainage network map of El Maleh basin; (b) Slope map of El Maleh basin; (c) Geological map of El Maleh basin and (d) Permeability map on the basin.
70 m3/s (Figure 1(b)) and cause damage to agricultural lands and urban areas in the downstream part of the basin.
2.2. Geology
The Oued El Maleh valley is mainly entrenched in Upper cenomanian and Eocene formations in the center of the basin, bordered on the on the NE and NW respectively by lower Liassic and by Paleozoic highlands of the old massif of the Upper Alas Mountains. The rhyolitic formations of the Paleozoic age represent the oldest formations of the basin and are located in the northern part (Figure 2(c)). They are covered by Mesozoic and Cenozoic rocks. [23] describe Mesozoic detritic sediments that hint at rifting within this region. In the Lower Triassic, clastic rocks composed of sandstones, shales, anhydrite and volcanic rocks, as well as continental redbeds, were formed [23] . The Upper Triassic-Lower Jurassic (Lias) series comprises conglomerates, siltstones containing halite and gypsum, sandstones and basalts [24] . In the Lower to Upper Jurassic, the Atlasic trough was connected to the young Atlantic ocean in the west as well as the Tethys in the northeast, resulting in marine deposits. Depending on the position within the trough, a variety of facies occur: proximal dolomites, clastic sediments, limestones and marls as well as distal turbidites [24] . In the Upper Liassic, marls were extensively deposited. Since the Lower Dogger, sedimentation exceeded subsidence and thus a continental depositional system evolved. This evolution is represented by a shift from detrital silico-clastics through marls and sandstones to coarse sandstones and conglomerates. At the western margin of the trough, a shallow marine environment was re-established in the Upper Jurassic, and calcareous, marly-calcareous and marly sediments were deposited. During the Lower Cretaceous the main parts of the High Atlas remained emerged, but during the Upper Cretaceous up to the Eocene, the Tethys transgression again flooded the Atlasic trough [24] . Consequently, marine deposits consist of marly limestones. The Neogene is represented by marine sandstones, marls and limestones [24] . Quarternary sediments of varying facies occur in relatively small intramontane basins and along wadi lines.
2.3. Permeability
The geology of flood hazard areas is an important criterion, because it may amplify/extenuate the magnitude of flood events. Permeable formations favor water infiltration, through flow and groundwater flow. On the contrary impermeable rocks, such as crystalline rock, favor surface runoff. Lower rating has been assigned to alluvial and continental deposits due to their higher infiltration capacity. More than 65% of the basin formations are ranged from medium to low permeability wich amplify the magnitude of flood events (Figure 2(d)).
2.4. Climate
The climate of the Drâa catchment is dominated by its orographic location south of the High Atlas Mountains and the pronounced gradient of altitude and aridity in north-south direction. While the climate varies from semi-arid in the northern part of the region to hyper-arid in the Saharan Foreland, some peaks in the High Atlas Mountains are characterised as sub-humid. Precipitation maxima can be identified in October and November as well as in March. The annual number of rainy days varies between 40 in the High Atlas and 20 in the oued El Maleh in the plain.
2.5. Hydrology
All rivers (or oueds, a local term for wadi) in the upper catchment of the ouarzazat basin show wide, gravely river beds with varying water courses, typical of braided rivers. Due to the high transport capacity during flood events, the river bed changes after each flood and leaves new braid bars behind. Therefore, a discharge measurement is difficult and carries a high degree of uncertainty. Periods of high discharge of El Maleh river correspond to periods of high precipitation; discharge is highest in winter (January and February) (3 m3/s) and spring (1.5 m3/s) (March to May), and lowest in autumn (1 m3/s) (September to December) and in summer (0.4 m3/s) (June to August).
The basic data of the hydrological model consist on the maximum annual discharges measured at Agouilal hydrological station (Table 1). These data cover a 36-years period, from 1976-1977 to 2012-2013. The data have been provided by the Sous Massa Hydraulic Basin Agency.
2.6. Flood Hazard Map by HEC-RAS and WMS Methodology
2.6.1. Hydraulic and Floodplain Modelling
Hydraulic modelling is used to evaluate important elements of free surface fluid flow such as for flood forecasting and producing inundation maps [25] . The models are applied to the floodplain area that is usually inundated by the floods. HEC-RAS is a windows-based hydraulic model developed by the US Army Corps of Engineers Hydrologic Engineering Center [26] designed to perform one-dimensional hydraulic calculations for a full network of natural and constructed channels. In this study, HEC-RAS is used for steady flow water surface profiles, using the energy equation with an iterative procedure called by a standard step method [27] . The energy equation is written as follows:

Table 1. Annual maximum instantaneous discharge rates at El Maleh River.
where: Z1, Z2 are the elevations of the main channel inverts, Y1, Y2 are the depths of water at cross sections, V1, V2 are the average velocities (total discharges/total flow area), α1, α2 are the velocity weighting coefficients, that account for non-uniformity of the velocity distribution over the cross section, g: gravitational acceleration, and he: is the energy head loss.
A steady flow is a condition in which depth and velocity at a given channel location do not change with time. Therefore, gradually varied flow is characterized by minor changes in water depth and velocity from one cross-section to another.
The cross section sub-division for the water conveyance is calculated within each reach using the following equations:
where: K = conveyance for subdivision, n = Manning roughness coefficient, A = flow area subdivision, R = hydraulic radius for subdivision (wetted area/wetted perimeter) and Sf = friction slope
Otherwise, WMS software is a comprehensive environment for hydrologic analysis. WMS 8.1 can perform operations such as automated basin delineation, geometric parameter calculations, GIS overlay computations, cross-section extraction from terrain data, floodplain delineation, mapping, and storm drain analysis. Flood inundation modeling was conducted using one of the tools within WMS, the WMS River tool to construct an HEC-RAS flow model. HEC-RAS also performs a step backwater curve analysis for either steady state or transient conditions to determine water surface elevations and velocities.
2.6.2. Methods for Flood Inundation Mapping
There were three basic steps to obtain the flood inundation map of El Maleh basin:
1) Preparing a triangular irregular network (TIN) which represents the topography for the study area. The TIN is a type of DEM (digital elevation model) created from digital contour data sourced from the GDEM-ASTER website. The contour data have a vertical accuracy of 1 m. In this study, TIN data were generated based on the DEM with a 30 × 30 m spatial resolution, after resampling from the digital contour of 1 m. This is to optimize time on the delineation process. This TIN resolution is suitable to be applied for a floodplain area to assess flood hazards [28] .
2) Preparing water surface elevation data as read in as a scatter point data set with stream stage values which are derived from HEC-RAS and subsequently read into WMS. Water elevation data consist of a series of surface water elevation points defined as x, y, z (where z is the elevation of the water surface). Some parameters required for the hydraulics model in HEC-RAS are stream centerline, main channel banks, cross-section lines, and material zones which are called channel geometry. The geometric data were derived based on the existing satellite imagery from Google Earth. A total of 43 cross sections were taken over the single reach modeled as seen in Figure 3(a). The great number of cross-sections was chosen for more details of flood maps. Reducing the number of cross-sections result in poorer inundation maps [29] . An example of the water surface elevation is given in cross section of Figure 3(b). Roughness coefficients (Manning’s n) used in the study area were 0.03 for river area, 0.10 for agriculture area, 0.08 for urbanized area and 0.04 for bare soil.
3) Mapping of flood inundation areas: After computing water surface elevation along the channel geometry of the El Maleh oued, mapping of flood inundation

Figure 3. (a) Cross-section lines used for modeling with DEM as a background image; (b) Water surface elevations at the outlet for different return periods; (c) Water surface profile along the main channel (El Maleh river) for different return periods.
areas was carried out using the flood analysis function of the WMS package. It involves interpolation of water surface elevation on the cross-sectional area along a 14,340 m radius (Figure 3(c)). The flood depth information for each location within the inundated areas has been identified by clicking at the expected location on the flooded areas. The methodology using the coupled WMS and HEC-RAS is illustrated in Figure 4.
Six methods of frequency distribution widely used in metrological analysis have been used to represent the maximum annual series of flood discharges. To choose between distributions, the visual fitting comparison, although necessary, is highly subjective and misleading. To overcome this subjectivity, several methods are available for the choice between distributions. One can use the moment ratio diagrams whether the ordinary or the linear moments. Another methodology is the one proposed by El-Adlouni et al. [30] . To choose between tested distributions, the Akaike Information Criterion (AIC) [31] and Bayesian Information Criterion (BIC) [32] can be used. Both criteria are based on the deviation between the fitted distribution and the empirical probability with a penalization that is function of the number of parameters of the distribution and the sample size. The distribution having the smallest BIC and AIC is the one that best fits the data. These criteria are defined as:
where: Log Lik represents the log-verosimilitude of parameters associated to data, K stands for the number of independent parameters within the model and N is the number of individuals composing the sample.
2.7. Flood Inundation Mapping by FHI Method
The process of selection of causal factors is a very crucial step in flood hazard, an index model has been developed in a GIS environment that contribute to floods

Figure 4. Schematic diagram of flood model applied for El Maleh basin.
was considered for this study. The developed model performs a multi-criteria analysis incorporating a Flood Hazard Index (FHI).
FHI comprises 6 criteria-factors: slope, flow accumulation, distance from drainage channel, drainage network density, land use and geology [33] [34] . The selection of these factors has been theoretically based on their relevance to flood hazards [35] .
・ Flow accumulation: According to the resulting values of Table 2, flow accumulation is the most important parameter in defining flood hazard. Accumulated flow sums the water flowing down-slope into cells of the output raster. High values of accumulated flow indicate areas of concentrated flow and consequently higher flood hazard. A large proportion of the flow accumulation rates is equal to 2 (Figure 5(a)).
・ Distance from drainage network: The buffering method yielded progressive zones along the drainage network indicating a lesser level of flood risk with each gradual zone away from the drainage network (Figure 5(b)). As the distance increases, flooding potential from broken riverbanks decreases. That explains why distance from the drainage has been assigned a high weight in the methodology. It appears that areas near the river (200 m) are highly flood hazard, whereas the effect of this parameter decreases in distances 700 m.
・ Drainage network density: The drainage network density ranged between 0 and 2.41 m/km2 (Figure 5(c)). A majority of the basin had a drainage network density between the ranges of 0.72 - 2.41 m/km2.
・ Land use: The land use type determines rainfall infiltration in the soil and the resultant runoff. Thus, while vegetation favors infiltration; building residences areas support the overland flow of water. A large proportion of the studied area is covered by soils, which have been assigned rates equal to 6 (Figure 5(d)).
・ Slope: Areas of low slope are located in the south parts of the study area, while high slope areas were in the north parts (Figure 5(e)). Generally, the south parts are more prone to flooding as runoff would travel much slower there than in the north parts.
・ Geology: Permeable formations favor water infiltration, groundwater flow, on the contrary impermeable rocks. Therefore, impermeable formations have been rated with 10 (Figure 5(f)). Lower rating has been assigned to alluvial and continental deposits due to their higher infiltration capacity.
The composite FHI is defined and calculated following Equation (1).
(1)
where wi is the effective weight of each flood causative factor, ri is the score rating of the flood causative factor in each point, and n is the number of flood causative factors.
The composite FHI was compiled using analytical hierarchy process (AHP), which is a multi-criteria decision analysis technique that provides a systematic
Table 2. Classes of the factors and according weights.

Figure 5. Thematic maps of the El Maleh basin factors: (a) Flow accumulation; (b) Distance from drainage; (c) Drainage network density; (d) Land use; (e) Slope; (f) Geology.
approach for integrating and assessing the impacts of various factors, involving several levels of dependent or independent qualitative as well as quantitative information [36] [37] [38] .
AHP considers interrelation and overcomes overlapping between factors, thus easing assessment of each factor’s contribution. All the flood causative factors were spatially defined on a 30-m grid, and each grid point was given a rating score according to the classes defining the local conditions (Table 2). Flow accumulation, drainage network density and rainfall intensity classes were defined using Jenks [39] , natural breaks classification algorithm, which seeks to reduce the variance within classes and maximize the variance between classes [34] . The slope was classified according to the model applied by the IGU Comission for Geomorphological Research and Mapping recommended by Demek [40] , whereas the distance from the drainage network classes was defined based in the buffer thresholds according to Kazakis et al. [34] which introduces a multi-criteria index to asses flood hazard areas in north-eastern part of greece. Land use and geological information for the study area were classified similarly to previous studies [34] . In order to evaluate the weight of each factors, we assigned values in a scale between 2 and 10 as given by Kazakis et al. [34] who applied this method under similar conditions to our basin (Table 2). According to this scale, a matrix of pairwise comparisons of the criteria for the AHP was determined on a 9-point scale (Table 3), where 1 implies equally important factors and 9, that a given factor is extremely more important than the other [38] .
To verify the inconsistency of the matrix, we propose to use the AHP method which consist of the calculation of the consistency ratio (CR) which permit the comparison between the consistency index (CI) of the matrix in question (the one with our judgments) versus the consistency index of a random-like matrix (RI). A random matrix is one where the judgments have been entered randomly and therefore it is expected to be highly inconsistent. More specifically, RI is the average CI of 500 randomly filled in matrices. In AHP, the consistency ratio is defined according to Equation (2). If the value of the CR is 0.10 or less, the matrix is acceptable [41] . If the consistency ratio is greater than 0.10, it is necessary to revise the judgments to locate the cause of the inconsistency and correct it.
(1)
Table 3. Pairwise comparison matrix of different factors.
where CI represents the consistency index computed according Equation (3) and RI is the random index computed from the average consistency index of a randomly generated sample of 500 pairwise comparison matrix as shown in Table 4 [36] .
(3)
with λmax being the maximum eigenvalue of the comparison matrix and n the number of criteria.
For the values of Table 5, CI was calculated for: λmax = 6.54, n= 6 and RI = 1.24. Eventually, the consistency ratio has been calculated CR = 0.08. Since CR’s value is lower than the threshold (0.1) the weights’ consistency is affirmed. This indicated a reasonable level of consistency in the pairwise comparison of the factors.
Following the determination of the initial arbitrary weights, the initial arbitrary flood hazard index was then calculated using Equation (4).
(4)
3. Results and Discussion
3.1. HEC-RAS and WMS Approche
Flood return periods are normally estimated from a flood frequency analysis performed on observed data. This fact shows that the edition of flood map by HEC-RAS Model can only be done for the areas downstream of the Agouilal hydrological station. The Gamma distribution has shown to be the strongest fitting distribution. The results of comparative analysis of adjustments of statistical laws are summarised in Table 6. The distribution having the smallest BIC and AIC is the Gamma distribution which confirm the graphical analysis.
Table 4. Random indices used to compute the consistency ratio.
Table 5. Normalized flood hazard factors: Analytical Hierarchy Process.
Table 6. Results of the application of AIC and BIC criteria to estimation of flash floods of El Maleh river.
P(Mi) = A priori probability, P (Mi/x) = A posteriori probability (Method of Schwarz), AIC= (Akaike Information Criterion), BIC = (Bayesian Information Criterion).
Summary of the flood frequency analysis is presented in Table 7. The peak discharge for different return periods are estimated respectively to 435, 574, 680, 786 and 926 m3/s for 20, 50, 100, 200 and 500 years.
The peak discharge simulated was inputted into and generated by HEC-RAS, the result was imported and readied by WMS for all return periods. The WMS Interpolate the results of water surface elevation data and delineate the flood inundation as shown in Figure 6 for 20 and 500 years. The main advantage of using HEC-RAS model tool is that the river stage data can be transformed to spatial dimension for flood extent mapping.
Most of the flood is concentrated around El Maleh river at Tasselmante, Tabourahte and Assfalou regions. They are higher affected by flood disaster: 324/500 Ha of agriculture surface seems to be inundated in the flood event of 500 years, in which 8.28% are situated in high risk area, 35.46% in medium risk and 56.26% in low risk. Approximately 23.62% of the total area of building residences was flooded.
These damages are due to the fact that during the maximum events of floods, the water levels of the wadi reach high height (11 m) at Tasselmante, Tabourahte and Assfalou areas and consequently, these waters flood laterally large surfaces of the plains surrounding the main channel of the river. The minimum flood depth for all scenarios was almost 0.05 m. The location of building residents, agriculture and infrastructure, in terms of proximity to El Maleh river, provides a measure of exposure to flood hazard. Statistical results show that 7.76% of building residents live less than 100 m from a river, 83.54% are at between 200 and 800 m from a river and 13.43% live not more than 1500 m. In the same sense, we notice that 12.06% of the agriculture areas are located less than 100 m from a river, 79.25% are between 200 and 800 m and 8.70% not more than 1500 m.
Depictions of the 20 years floodplain boundary and 500 years were simulated to provide a representation of the floodplain boundaries that are commonly used
Table 7. Peak discharges for different return periods of the El Maleh river.

Figure 6. Flood map limits of El Maleh river for 20 and 500 years return periods, and water surface elevations of flood at different cross sections.
for flood insurance purposes. As seen in Figure 6, the 20 years floodplain boundary underestimated the extent of flooding in the north part at Assfalou, Ait Ben Hadou and Italwane region, and the 500 year floodplain boundary overestimated the extent of flooding in the downstream of El Maleh river in Tabourahte and Tasselmante.
3.2. Flood Hazard Index (FHI) Approach
The proposed methodology combines the selected factors, taking into account the relative weights. Thematic maps in Figure 5 illustrate the spatial distribution of the parameters values in the basin. The factors applied evaluates the impact of each flood causative factor on the FHI, flow accumulation was considered as the most influencing factor in the FHI followed by distance from drainage, drainage network density, land use and slope, while geology was the least influencing factor. This involves superimposing the thematic maps with different weights in a GIS environment.
The criterion maps were combined by MCDA. To generate criterion values using the rank method for each evaluation unit, the values between 1 and 6 were given, where 6 indicates higher risk and 1 indicates low risk depending on the criteria’s class values. The results of FHI model for 500 years return periods applied to the totality of the basin, shows 5 classes of flood risk (very low, low, medium, high and very high) (Figure 7). The majority of the flooding was located in the broad floodplains extending northward from the main channel of the rivers. Near Adaha, Timssal and Tizgha villages, located at the north part of the basin, the floodplains closest to the river were occupied by agriculture areas and building residence and massive damage was caused to infrastructure including road. Generally, half (50%) of the surface of the basin was highly to medium susceptible to flooding, while the second half (50%) ranged from the low to very low risk. The accuracy flood levels in this area can be attributed, in part, to the high flow accumulation, proximity to the drainage network, drainage network density and low slope.
The pattern of flooding generated by FHI appears similar to that generated using the WMS and HEC-RAS hydraulic modeling approach in the southern part of the basin except for the right bank of the El Maleh river in Tabourahte and Assfalou regions. Indeed, the results of the field validation of this map show that the floods spread over larger areas compared to the result of the model at the right bank in these regions. The coefficients estimated using this approach in this region didn’t provide a reasonable flood extent approximation. We thing that a potentially significant source of error in water surface profile generation is the subjective estimation of Manning’s roughness coefficients [42] . Initially, in this study land use data classified from a Landsat 8 image (30 m × 30 m resolution) were utilized to derive Manning’s roughness coefficients for hydraulic modeling. The poor representation of flooding extent in this is due to several factors including the thematic classification accuracy of the land use categories, inaccurate estimates of roughness coefficients for a given land use type or the coarse resolution of the data layer.
The WMS and HEC-RAS hydraulic model can be calibrated using Manning coefficients, well-designed cross-section cutlines, and prior flood extent data. This capability can provide a more refined representation of flooding extent. If discharge data are available or can be reliably estimated for a tributary, the tributary drainage can be incorporated into the modeling process.

Figure 7. Flood hazard map using the composite FHI in the (1) downstream part of the basin, in the (2) upstream part of the basin and (3) comparison between the results of applied HECRAS-WMS and FHI process in the downstream part of the basin for 500 years return periods.
Advantages of the WMS and HEC-RAS inundation modeling approach are that they are simpler to execute and requires only one stage level data as hydrologic input. However, in areas with greater relief and topographic variability accurate interpolation between gauges may be more problematic. Others limitations of this method are that tributaries are only flooded according to water height from the main channel and not from tributaries. However, the FHI model provides results for the entire basin including all the tributaries in the areas without even without hydrological data’s.
The result presents a vision of the study area to understand the challenge it faced by living in high risk areas, conveys a very strong message to identify the effectiveness of possible countermeasures, provides the foundation upon which well planned risk management strategies can be built. This is also a basic decision material, when building local or national roads, in order to avoid their rupture or their clogging with silt transported by the river.
The developed flood map can be incorporated to land use planning decisions, this may help to reduce potential flood damage in El Maleh river. The GIS analysis may perhaps assist governmental authorities to prepare and avert negative impacts of future flood events.
4. Conclusions
By combining multi-criteria data and hydrodynamic models of varying complexities, this study demonstrated the utility of these tools in emergency response and flood management operations using the El Maleh river basin in Ouazazat as a case study.
In this paper, two methods for delineating the extent of flooding were examined and compared. The first method was based on implementing a hydraulic extension program called WMS. Parameters were extracted using the hydraulic extension program and input into a hydraulic model called HEC-RAS. Water surface profiles for the study area were generated in HEC-RAS. The second method is FHI the simulated flood mapping is given and experiences with key processing elements and important analysis techniques that are used for the extraction of flooded area.
The most areas with high flooding potential were located in the northern parts of the basin. The risk maps determine the degree of susceptibility for the flood areas. It indicates that flooding has been devastating El Maleh river with large scale of destruction and inundate areas along the river banks. In Tabourahte, Tasselmante and Assfalou, the risk is very serious. The FHI map showing observed flood events and their extents were used to subjectively validate the resultant flood models by WMS and HEC-RAS, similar results were obtained when comparing the areas in the highest risk categories and FHI supported the WMS and HEC-RAS results, with proportional distribution of flood risk affected.
The validation with the simulated flood extent from WMS, HEC-RAS model and FHI has been made and it indicates that WMS and HEC-RAS simulated flood extent shows reasonably good agreement with observed result of FHI.
Present approach can be used for preliminary early warning and alerts for regions which lack data for detailed hydrologic and hydraulic simulations. The present study leaves a wide scope for researchers and investigators to explore other aspects of floods by integrating the WMS, HEC-RAS and FHI model with GIS technology. The study can be helpful in making a flood early warning system which includes preparedness, response and recovery and the parameters from the flood model namely flood duration and flood depth can assist in flood index insurance as innovative tool in enhancing agriculture reliance and flood proofing livelihood.
Conflicts of Interest
The authors declare no conflicts of interest regarding the publication of this paper.
Cite this paper
Echogdali, F.Z., Boutaleb, S., Elmouden, A. and Ouchchen, M. (2018) Assessing Flood Hazard at River Basin Scale: Comparison between HECRAS-WMS and Flood Hazard Index (FHI) Methods Applied to El Maleh Basin, Morocco. Journal of Water Resource and Protection, 10, 957-977. https://doi.org/10.4236/jwarp.2018.109056
References
- 1. Heidari, A. (2014) Flood Vulnerability of the Karun River System and Short-Term Mitigation Measures. Flood Risk Manage-ment, 7, 65-80. https://doi.org/10.1111/jfr3.12032
- 2. Foudi, S., Osés-Eraso, N. and Tamayo, I. (2015) Inte-grated Spatial Flood Risk Assessment: The Case of Zaragoza. Land Use Policy, 42, 278-292. https://doi.org/10.1016/j.landusepol.2014.08.002
- 3. Hudson, P., Botzen, W., Kreibich, H., Bubeck, P. and Aerts, J. (2014) Evaluating the Effectiveness of Flood Damage Mitigation Measures by the Application of Propensity Score Match-ing. Natural Hazards and Earth System Sciences, 14, 1731-1747. https://doi.org/10.5194/nhess-14-1731-2014
- 4. Perera, E., Hiroe, A., Shrestha, D., Fukami, K., Basnyat, D., Gautam, S., Hasegawa, A., Uenoyama, T. and Tanaka, S. (2015) Community-Based Flood Damage Assessment Approach for Lower West Rapti River Basin in Nepal under the Impact of Climate Change. Natural Hazards, 75, 669-699. https://doi.org/10.1007/s11069-014-1339-5
- 5. Rahmati, O., Pourghasemi, H. and Zeinivand, H. (2015) Flood Susceptibility Mapping Using Frequency Ratio and Weights-of-Evidence Models in the Golastan Province, Iran. Geocarto International. https://doi.org/10.1080/10106049.2015.1041559
- 6. Poussin, J.K., Botzen, W.J. and Aerts, J.C. (2014) Factors of Influence on Flood Damage Mitigation Behavior by Households. Environmental Science and Policy, 40, 69-77. https://doi.org/10.1016/j.envsci.2014.01.013
- 7. Matkan, A., Shakiba, A., Pourali, H. and Azari, H. (2009) Flood Early Warning with Integration of Hydrologic and Hydraulic Models, RS and GIS (Case Study: Madarsoo Basin, Iran). World Applied Sciences Journal, 6, 1698-1704.
- 8. Fenicia, F., Kavetski, D., Savenije, H.H.G., Clark, M.P., Schoups, G., Pfister, L. and Freer, G. (2013) Catchment Properties, Function, and Conceptual Model Representation: Is There a Corre-spondence? Hydrological Processes, 28, 2451-2467. https://doi.org/10.1002/hyp.9726
- 9. Qafari, G. (2004) Flood Hazard Zoning Using GIS (Case Study: Babolrood River, Mazandaran Province, Iran). M.Sc Thesis of Watershed Man-agement. Faculty of Natural Resources of University of Mazandaran, 126 p.
- 10. Echogdali, F.Z., Boutaleb, S., Jauregui, J. and Elmouden, A. (2018) Cartography of Flooding Hazard in Semi-Arid Climate: The Case of Tata Valley (South-East of Mo-rocco). Journal of Geography & Natural Disasters, 8, 1-11. https://doi.org/10.4172/2167-0587.1000214
- 11. Jaafari, A., Najafi, A., Pourghasemi, H.R., Rezaeian, J. and Sat-tarian, A. (2014) GIS-Based Frequency Ratio and Index of Entropy Models for Landslide Susceptibility Assessment in the Caspian Forest, Northern Iran. International Journal of Environmental Science and Technology, 11, 909-926. https://doi.org/10.1007/s13762-013-0464-0
- 12. Moel, H.D., Vliet, M.V. and Aerts, J.C.J.H. (2014) Evaluating the Effect of Flood Damage-Reducing Measures: A Case Study of the Unembanked Area of Rotterdam, the Netherlands. Regional Environmental Change, 14, 895-908.
- 13. Pradhan, B., Hagemann, U., Shafapour Tehrany, M. and Prechtel, N. (2014) An Easy to Use ArcMap Based Texture Analysis Program for Extraction of Flooded Areas from TerraSAR-X Satellite Image. Computers Geosciences, 63, 34-43. https://doi.org/10.1016/j.cageo.2013.10.011
- 14. Tehrany, M.S., Lee, M.J., Pradhan, B., Jebur, M.N. and Lee, S. (2014) Flood Susceptibility Mapping Using Integrated Bivariate and Multivariate Statis-tical Models. Environmental Earth Sciences, 72, 4001-4015. https://doi.org/10.1007/s12665-014-3289-3
- 15. Tehrany, M.S., Pradhan, B. and Jebur, M.N. (2014) Spatial Pre-diction of Flood Susceptible Areas Using Rule Based Decision Tree (DT) and a Novel Ensemble Bivariate and Multivariate Statistical Models in GIS. Journal Hydrology, 504, 69-79. https://doi.org/10.1016/j.jhydrol.2013.09.034
- 16. Malczewski, J. (2006) GIS-Based Multicriteria Decision Analy-sis: A Survey of the Literature. International Journal of Geographical Information Science, 20, 703-726. https://doi.org/10.1080/13658810600661508
- 17. Ghanbarpour, M.R., Salimi, S. and Hipel, K.W. (2013) A Com-parative Evaluation of Flood Mitigation Alternatives Using GIS-Based River Hydraulics Modelling and Multicriteria Decision Analysis. Flood Risk Management, 6, 319-331. https://doi.org/10.1111/jfr3.12017
- 18. Paquette, J. and Lowry, J. (2012) Flood Hazard Modelling and Risk Assessment in the Nadi River Basin, Fiji, Using GIS and MCDA. South Pacific Journal of Natural and Applied Sciences, 30, 33-43. https://doi.org/10.1071/SP12003
- 19. Kritikos, T. and Davies, T.R.H. (2011) GIS-Based Multi-Criteria Decision Analysis for Landslide Susceptibility Mapping at Northern Evia, Greece. Zeitschrift der Deutschen Gesellschaft für Geowissenschaften, 162, 421-434. https://doi.org/10.1127/1860-1804/2011/0162-0421
- 20. Bui, D.T., Tuan, T.A., Klempe, H., Pradhan, B. and Revhaug, I. (2015) Spatial Prediction Models for Shallow Landslide Hazards: A Comparative Assessment of the Efficacy of Support Vector Machines, Artificial Neural Networks, Kernel Logistic Regression, and Logistic Model Tree. Landslides, 13, 361-378. https://doi.org/10.1007/s10346-015-0557-6
- 21. Saaty, T.L. (1980) The Analytic Hierarchy Process: Planning, Priority Setting, Resource Allocation. McGraw-Hill, New York.
- 22. Pourghasemi, H.R., Pradhan, B. and Gokceoglu, C. (2012) Application of Fuzzy Logic and Analytical Hierarchy Process (AHP) to Landslide Susceptibility Mapping at Haraz Watershed, Iran. Natural Hazards, 63, 965-996. https://doi.org/10.1007/s11069-012-0217-2
- 23. Beauchamp, W., Allmendinger, R.W., Barazangi, M., Demnati, A., El Alji, M. and Dahmani, M. (1999) Inversion Tectonics and the Evolu-tion of the High Atlas Mountains, Morocco, Based on a Geological-Geophysical Transect. Tectonics, 18, 163-184. https://doi.org/10.1029/1998TC900015
- 24. Piqué, A. (2001) Geology of Northwest Africa, 29. Beiträge zur re-gionalen Geologie der Erde, Gebrüder Bornträger, Berlin, Stuttgart.
- 25. Gilles, D. and Moore, M. (2010) Review of Hydrau-lic Flood Modeling Software Used in Belgium, the Netherlands, and the United Kingdom.
- 26. US Army Corps of Engineers (2010) Hydrologic Engineering Center, HEC-RAS River Analysis System, User’s Manual.
- 27. Brunner, G.W. (1995) HEC-RAS, River Analysis System. Hydraulic Reference Manual. US Army Corps of Engineers, Hydrologic Engineering Cen-ter.
- 28. FEMA (2013) Multi-Year Flood Hazard Identification Plan (MHIP). 1-18.
- 29. Aaron, C. and Venkatesh, M. (2009) Effect of Topographic Data, Geometric Configuration and Modeling Approach on Flood Inundation Mapping. Journal of Hydrology, 377, 131-142. https://doi.org/10.1016/j.jhydrol.2009.08.015
- 30. El Adlouni, S., Ouarda, T.B.M.J., Zhang, X., Roy, R. and Bobée, B. (2007) Generalized Maximum Likelihood Estimators for the Nonstationary Generalized Ex-treme Value Model. Water Resources. Research, 43, 1-13. https://doi.org/10.1029/2005WR004545
- 31. Akaike, H. (1973) Information Theory and an Extension of the Maximum Likelihood Principle. In: Petrovand, B.N. and Csaki, F., Eds., 2nd International Symposium on Information Theory, Akademiai Kiado, Budapest, 267-281.
- 32. Schwarz, G. (1978) Es-timating the Dimension of a Model. Annals of Statistics, 6, 461-464. https://doi.org/10.1214/aos/1176344136
- 33. Elkhrachy, I. (2015) Flash Flood Hazard Mapping Using Satellite Images and GIS Tools: A Case Study of Najran City, Kingdom of Saudi Arabia (KSA). The Egyptian Journal of Remote Sensing and Space Sciences, 18, 261-278. https://doi.org/10.1016/j.ejrs.2015.06.007
- 34. Kazakis, N., Kougias, I. and Pat-sialis, T. (2015) Assessment of Flood Hazard Areas at a Regional Scale Using an Index Based Approach and Analytical Hier-archy Process: Application in Rhodope-Evros Region, Greece. Science of the Total Environment, 538, 555-563. https://doi.org/10.1016/j.scitotenv.2015.08.055
- 35. Haan, C.T., Barfield, B.J. and Hayes, J.C. (1994) Design Hy-drology and Sedimentology for Small Catchments. Elsevier, New York.
- 36. Saaty, T.L. (1977) A Scaling Method for Priori-ties in Hierarchical Structures. Journal of Mathematical Psychology, 15, 234-281. https://doi.org/10.1016/0022-2496(77)90033-5
- 37. Saaty, T.L. (1990) How to Make a Decision: The Analytic Hierarchy Process. European Journal Operational Research, 48, 9-26. https://doi.org/10.1016/0377-2217(90)90057-I
- 38. Saaty, T.L. (2008) Decision Making with the Analytic Hier-archy Process. International Journal of Services Sciences, 1, 83-98. https://doi.org/10.1504/IJSSCI.2008.017590
- 39. Jenks, G.F. (1967) The Data Model Concept in Statistical Map-ping. International Yearbook Cartography, 7, 186-190.
- 40. Demek, J. (1972) Manual of Detailed Geomorphological Map-ping. Academia, Prague.
- 41. Saaty, T.L. (2012) Decision Making for Leaders: The Analytic Hierarchy Process for Decisions in a Complex World. Third Revised Edition, RWS Publications, Pittsburgh.
- 42. Dodson, R. and Li, X. (2000) The Accuracy and Efficiency of GIS-Based Floodplain Determinations. In: Maidment, D. and Djokic, D., Eds., Hydrologic and Hydraulic Modeling Support with Geographic Information Systems, ESRI Press, New York, 29-52.