Journal of Water Resource and Protection
Vol.6 No.11(2014), Article
ID:48929,8
pages
DOI:10.4236/jwarp.2014.611098
Effects of Water Distribution Uniformity on Waxy Corn (Zea mays L.) Yield: Preliminary Results
Lucia Bortolini, Marco Martello
Department of Land Environment Agriculture and Forestry (TESAF), University of Padova, Padova, Italy
Email: lucia.bortolini@unipd.it
Copyright © 2014 by authors and Scientific Research Publishing Inc.
This work is licensed under the Creative Commons Attribution International License (CC BY).
http://creativecommons.org/licenses/by/4.0/


Received 25 June 2014; revised 21 July 2014; accepted 12 August 2014
ABSTRACT
To face climatic changes, the increase of frequency and severity of droughts, and economic development pressures, Water Management Institutions point at the necessity of water conserving. A sustainable demand-led approach is the most viable option, focusing on achieving more efficient irrigation practices instead of less sustainable expansion of supply. The aim of this work is to investigate on some aspects of the rational water management for the irrigation of corn in order to evaluate the actual possibility of introduction of drip irrigation systems on the Venetian Plain. Trials were carried out on a farm located in Isola della Scala (Verona, Italy) in an area of about 13 ha (12 ha with a drip irrigation system and 1 ha with a solid-set sprinkler system); the effects of the performance of the two systems on waxy corn yield were considered. In particular, water distribution uniformity, water use efficiency, and yield performance of irrigation systems were evaluated. DUlq and CU coefficients for distribution uniformity and IWUe and WUEb indexes for water use efficiency were calculated. To visualize and better analyze the distribution uniformity, the crop yield and the efficiency parameters, ArcGIS 10 (ESRI®) with IDW interpolation were used to create maps. First results show a good water uniformity distribution in the drip irrigation system but only with a careful and proper design of the entire system. As regards the water use efficiency, drip irrigation values are lower than those of sprinkler irrigation (−46% for IWUe and −25% for WUEb), probably due to different irrigation management and water volumes used: in fact, drip irrigation was scheduled every three days, while only supplemental operations were done for sprinkler irrigation. No statistical correlation was found between application rate and yield for both irrigations systems, while a significant correlation was found between irrigation volume and crop water use efficiency. The profitability of the two irrigation systems was compared. The results show that the income of drip irrigation is slightly lower than sprinkler irrigation, mostly due to the use of “throw away” drip lines.
Keywords:Drip Irrigation, Sprinkler Irrigation, Profitability, Efficiency, GIS

1. Introduction
In 2050 an increase in water consumption up to 11% and a duplication in food production needs have been predicted [1] . For this reason the correct choice of irrigation method along with a rational irrigation water management will be essential to increase the water use efficiency. Therefore a reduction in water losses and a utilization of low irrigation volume are needed, integrating the irrigation practice into a sustainable cultivation with a rational water use [2] [3] .
The irrigation system performance is evaluated in the study area on the basis of adaptability, efficiency and distribution uniformity. The distribution uniformity is a parameter to indicate the irrigation system capability to apply the same application rate to a surface unit for the surface and sprinkler methods, or to discharge the same water volume from each emitter for the microirrigation methods. Without an appropriate uniformity distribution it is impossible to irrigate in an appropriate and efficient manner and with good water use efficiency. In fact, with a scarce distribution uniformity some zones will be over-watered and other ones will be under-watered [4] -[6] .
The irrigation uniformity can affect the crop yield and influence more or less heavily the environmental impact of the irrigation [7] .
Corn is a very important crop in the North of Italy, especially in the Po Valley Plain where it is cultivated with high water and fertilizer use and often with high energy consumption.
The limitation of high crop yield is especially due to an incorrect use both of water and fertilizer elements. For these reasons, it is advisable to use fertigation technique that allows for an optimum use of water and the fertilizers are easily and uniformly distributed near the roots in the correct time and quantities.
The proper use of production inputs is an indispensable condition not only for the farm finances but even for the collectivity, and especially for irrigation water, evermore subjected to use limitation and withdrawal restriction, and its efficient use has to involve both engineering aspects of the distribution system and the management strategies of the irrigation operations [8] .
The scope of this work is to quantify the impact of water distribution uniformity of a drip irrigation system on the waxy corn yield and on water use efficiency, by comparing this system with the more traditional sprinkler irrigation system, even on the profitability basis, in order to evaluate its real possible use in the Venetian Plain.
2. Materials and Methods
The trials were carried out during summer 2012 on the farm of Società Cooperativa Agricola Zootecnica “La Torre” located in Isola della Scala (Verona, Italy), in a drip irrigated plot of 12 ha, subdivided into 3 irrigation zones of 4 ha, and in a gun sprinkler irrigated plot of 1 ha.
The soil is a sandy loam (USDA classification), with a good organic matter content. A 30 cm plough was done during autumn burying 42 t/ha of cattle slurry, corresponding to about 170 units of nitrogen. A FAO 600 cultivar was seeded, with a plant spacing of 0.16 m and row spacing of 0.75 m.
Fertigation in three different applications was done in the drip irrigated area using N 30 liquid fertilizer, while urea was distributed during hoeing operation in the sprinkler irrigated area, for a total of about 100 units of nitrogen per ha in each. The waxy corn harvesting was done on the 9th of August.
The drip system was made up of a centrifugal pump with a 37 kW diesel engine, a hydrocyclon and self-cleaning screen filter of 120 mesh, and a Venturi fertigation pump. The drip lines were Aqua-Traxx® PC drip tape of 22 mm of diameter with 1.14 L/h of flow rate at 0.8 bar and 20 cm emitter spacing, installed 5 cm underground, located in the furrow and in every other row, supplied by a layflat 5” manifold.
The solid-set sprinkler system was made up of a multistage centrifugal pump containing three impellers with a flow rate of 67 m3/h, a head of 70 m and an engine of 130 kW. The sprinklers were turbine gun sprinklers with a nozzle of 28 mm operating at 5 bar pressure (measured with a Pitot tube) with a flow rate of 1096 L/min, positioned with 40 × 40 m spacing and supplied by aluminum pipes of 100 mm of diameter.
To define the distribution uniformity of the drip irrigation system the discharge was measured at 24 points within each irrigation zone according to ISO 9261 [9] ; as the sprinkler system, 100 catch cans were positioned with a grid of 5 m apart, covering an area of 160 m2 equal to the distance between gun sprinklers and the application rate was measured at each survey point (Figure 1 and Figure 2).
The waxy corn yield was carried out weighing the whole epigeous part of the crops harvested in each survey point for drip system and in 16 points for sprinkler system (all plants of two rows × 1.2 m of length), excluding the borders, and then transformed in kg/ha.
In order to observe the soil water content variations, even to calculate the water use efficiency indexes, fiber glass tubes were positioned at various points and located between rows and on rows in order to use the soil moisture profile probe (a device with 4 FDR sensors at 10 - 20 - 30 - 40 cm depth).
The irrigation was scheduled from the 14th of June to 7th of August distributing 15 mm every three days (corresponding to about 5 mm of daily crop ET) for drip irrigation. Regarding sprinkler system, only supplemental irrigations were chosen according to the procedure typically used in Venetian Plain.
To calculate the non-irrigated waxy corn yield six rows were not irrigated.
2.1. Distribution Uniformity and Efficiency Parameters
To evaluate the distribution uniformity two indexes suitable for drip irrigation were used. The first one is the Low Quarter Distribution uniformity DUlq which emphasizes the areas which receive the least irrigation by focusing on the low quarter [4]
 (1)
(1)
where:
qavglq = average discharge rate of the lowest one-fourth of the field data readings (L/h)
qavg = average discharge rate of all field data checked (L/h)
The second index calculated is the uniformity coefficient CU developed by Christiansen [10] that treats overirrigation and underirrigation equally compared to the mean:
 (2)
(2)
where: x is the total absolute value of deviations from average of the application rate M (mm/h) of each survey point regarding the average application rate M measured in n control points. To determine this, catch cans were distributed according to a grid within the irrigated area.
For drip system CU coefficient modified by Merriam and Keller [11] was used
 (3)
(3)
where:
z = discharge rate of each emitter (L/h)m = average discharge rate of total emitters (L/h).
The values of the parameters depend on constructive and hydraulic features, and the age of the emitters and are influenced by the obstruction level of the emitters. By means of these indexes it is possible to evaluate the efficiency of water filtration system and the system maintenance. For this reason these indexes should be used with both new and old systems.
To determinate the water use efficiency, the WUEb index, which considers the total amount of water distributed, and the IWUe index, used to characterize the yield increase in relation to the water applied during irrigation, were calculated [6] .
The two indexes are illustrated with the following formulas
 (4)
(4)

Figure 1. Map of the survey points in each zone of the plot with drip irrigation system.
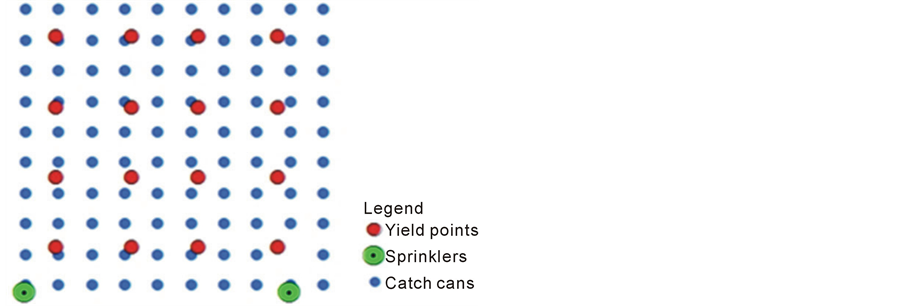
Figure 2. Map of the survey points of the area with sprinkler irrigation system.
where:
WUEb = water use efficiency at biomass-basis (kg/m3)Y = crop yield (kg/ha)P = rainfall (m3/ha)IR = irrigation volume (m3/ha)ΔSW = soil water stock (m3/ha).
 (5)
(5)
where:
IWUe = irrigation water use efficiency (kg/m3)Yi = irrigated crop yield (kg/ha)Yd = non-irrigated crop yield (kg/ha)IR = irrigation volume (m3/ha).
To visualize and better analyze the distribution uniformity, the crop yield and the efficiency parameters, ArcGIS 10 (ESRI®) with IDW (Inverse Distance Weighting) geostatistical interpolation technique (the most suitable given the quantity and distance of the survey points) were used to create the maps.
2.2. Profitability
The profitability of the two irrigation systems was calculated and compared. As regards sprinkler irrigation, in order to simplify analysis and at the same time make the results more useful, a travelling gun system was considered. The parameters used for the choice of the most appropriate model to the acquired data were: gun sprinkler with a nozzle of 28 mm, pressure 5 bar at the sprinkler, PE pipe with diameter of 100 mm and length of 300 m.
The cost of the system is € 20,000 of which € 12,000 for the travelling gun system and € 8000 for the pump. From these data an annual amortization in 12 years of € 58 per ha with a 6 h/ha management time for labour of seven irrigation operations was obtained [12] .
For the drip system, the real costs sustained were for the purchase of the drip system components. With the same procedure used for the sprinkler system, fixed costs of the system head were calculated considering a 6 years amortization for the manifolds. It is important to note that, for this type of microirrigation system, it is necessary to consider variable costs regarding the purchase of lateral drip tapes.
For the Value of Production (VP) a price of € 40 per ton of silo maize was considered. Regarding diesel consumption, real costs of 1 €/L were used.
Finally, the profitability of both irrigation systems was calculated taking into consideration the VP and total costs.
3. Result
3.1. Uniformity Distribution and Efficiency
The analysis of the distribution uniformity for the drip system shows that both the indexes present good but not optimum results, indicating a discrete variability of the discharge rates probably due to elevated length of the area, and therefore the consequent lost of pressure along the water distribution lines. In fact, considering the three irrigation zones individually (Table 1), it can be noted that the second zone, with an inferior length of the manifold, achieves the best distribution uniformity. The third zone has suffered a loss of load due to the greater length of both the manifold and the lateral lines, given the worst performance.
As regarding the crop yield, the non-irrigated plot was unproductive, because the plants were completed wilted after flowering, while it was observed in the irrigated part that the third zone has given the best average yield (respectively, +10% compared to the first zone and +3% compared to the second one).
It is interesting to note the difference between the three zones, principally caused by the actual discharge rate of the drippers. The third zone, with an inferior total irrigation volume distributed, gives a better efficiency: in fact, the WUEb is more than 15% compared to the first zone and 12% regarding the second zone, while the IWUe was more than 19% regarding the other two zones.
By observing both application rate and crop yield maps (Figure 3) it can be noted that, in the zone in which the irrigation volumes distributed were higher, the yields obtained were lower. In hypothesis, these results are due to prolonged and repeated moments of water saturated soil in which the plants were in anoxia caused by excessive irrigation volumes distributed.
It must be noted that, in spite of these differences, the average yield was 89.7 t/ha, therefore very high.
Even observing the water use efficiency maps it is evident that, both for the IWUe and for the WUEb indexes, in the area where the distributed volume were lower both indexes are better.
As regards the sprinkler system, both distribution uniformity parameters are very low, above all the DUlq (Table 2). In fact, in Figure 4 it can be noted that there is a wide zone opposite to the sprinklers, where the application rate was up to 50% lower regarding the average value.
In the same maps it can be noted that the zone with higher application rate has obtained lower yield regarding the central part where the application rate was near the average value. It possible to hypothesize that in the over-irrigated part, even in this case, the lower yield was caused by the soil water saturation conditions, therefore the plants suffered anoxia. However, the waxy corn yields were more than 80 t/ha, underlining the superior production of irrigated corn in the studied area (Table 2).
In the water use efficiency maps (Figure 4) it can be noted that the area immediate to the gun sprinklers has lower values due to high application rate and inferior average yields, while in the central zone it was found to be higher. In the opposite zone higher IWUb values were obtained, due to low application rate, even if the crop yield was near average.
3.2. Profitability
Table 3 shows that the Value of Production (VL) is higher for the drip irrigation system of € 316 per ha, equal to 9% more than travelling gun system. On the contrary, the travelling gun system has an amortization lower

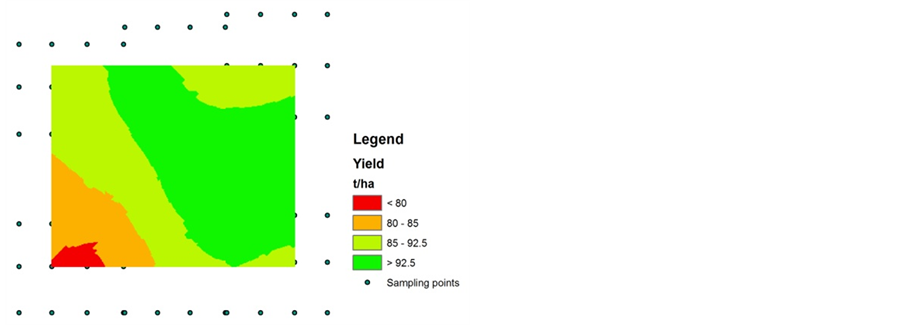
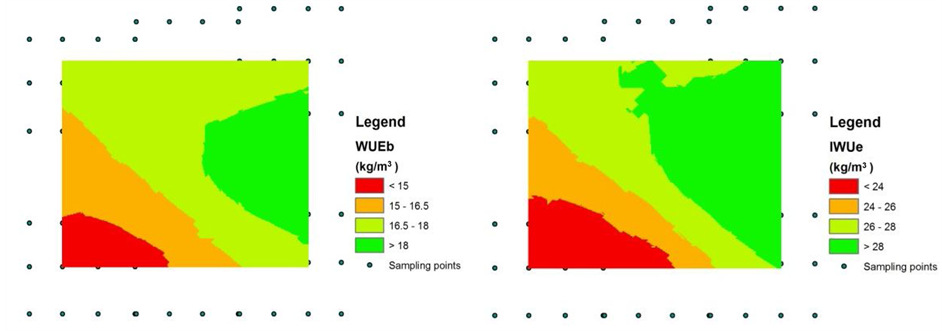
Figure 3. Maps with surface interpolation of Application rate, Yield, WUEb, and IWUe of the drip irrigation system.

Table 1. Average crop yields, seasonal irrigation volumes, total water supplies, distribution uniformity and efficiency parameters of the three drip irrigation zones.
Table 2. Comparison between drip and sprinkler irrigation of average crop yields, seasonal irrigation volumes, total water supplies, distribution uniformity and efficiency parameters.
than 35% and almost half of the variable costs. The higher cost of the drip system is caused by the cost of the drip tapes (€ 450 per ha), as for travelling system, costs are more connected to diesel consumption that were 44% higher than drip system. Instead, as regards labour, due to time needed for installation and dis-installation of the drip lines, the costs are higher by 56% for the drip system.
The income is slightly higher for the travelling gun system (+0.5%), despite the cost of diesel, demonstrating the importance of the cost of the drip tapes on the total costs.


Figure 4. Maps with surface interpolation of Application rate, Yield, WUEb, and IWUe of the sprinkler irrigation system.
Table 3. Profitability of the drip and sprinkler (travelling gun) irrigation systems.
4. Discussion
Comparing the two irrigation methods (see Table 2) it can be noted that the average yield of the drip irrigation system was higher by only 8.6% in regard to sprinkler system, even if the seasonal irrigation volume distributed was more than 50%.
This difference is shown in WUEb value where a superior value of 25% of the sprinkler system can be seen. Comparing the two irrigation methods in IWUe terms, it turns out that water use efficiency is 45% higher than for the drip system, showing that the rational management of the irrigation volumes has a greater influence than the uniformity distribution.
Observing results, for the both systems it can be hypothesized that in the over-irrigated part the inferior crop yield was caused by periods in which the soil was saturated, with a subsequent state of anoxia, while better production were obtained in the areas with average application rate.
The profitability of the two systems shows that the income is better by 0.5% for the travelling gun system in respect of drip irrigation system. From the calculation, it turns out that the annual cost of the drip lines are elevated, while for the travelling system elevated costs are due to diesel consumption. In latter case, lower cost could be found by simply using a pump with a lower kW engine, more useful for the flow rate and pressure needs of the system.
5. Conclusions
The trials carried out during summer 2012 have shown how the drip irrigation system easily allows for a good distribution uniformity, but careful designing is necessary in order to reduce the head loss into the drip lines.
The drip irrigation management with pre-scheduled irrigation plan based on hypothetical average crop daily ET does not optimize the use of water, lowering the water use efficiency.
Despite of a particularly dry summer, in general irrigation has allowed for very high yields on average, even if relatively lower in the over-irrigated zones.
The income of the drip irrigation system is slightly lower than the sprinkler irrigation system, mostly due to the use of “throw away” drip lines (i.e. used only for one crop season) that can have future consequence only if supported by justifiable financing because of a rational use of water, energy, fertilizers, including the possibility to distribute the liquid fraction of slurry.
It is very important to evaluate the correct irrigation volumes and operation times in order to reduce to a minimum the number and the duration of irrigation, and consequently the energy consumption. Furthermore, to better compare the two irrigation systems, it may be more appropriate to extend the area of solid-set sprinkler system. For this reason new trials should be performed in the future.
References
- UNESCO-WWAP (2003) Water for People Water for Life. UNESCO, Paris.
- Castaldi, R. (2009) Bassi volumi irrigui per un uso razionale dell’acqua. Informatore Agrario, 45, 36-40.
- Bortolini, L. (2008) Irrigazione razionale: Da sfruttamento a uso strategico. Informatore Agrario, 19, 31-33.
- Burt, C.M., Clemmens, A.J., Strelkoff, T.S., Solomon, K.H., Bliesner, R.D., Hardy, L.A., Howell, T.A. and Eisenhauer, D.E. (1997) Irrigation Performance Measures: Efficiency and Uniformity. Journal of Irrigation and Drainage Division ASCE, 123, 423-442. http://dx.doi.org/10.1061/(ASCE)0733-9437(1997)123:6(423)
- Camp, C., Sadler, E. and Busscher, W. (1997) A Comparison of Uniformity Measures for Drip Irrigation Systems. Transaction of the ASAE, 40, 1013-1020. http://dx.doi.org/10.13031/2013.21353
- Lameck, O., William, L. and Dean, E. (2011) Irrigation Efficiency and Uniformity, and Crop Water Use Efficiency. University of Nebraska Lincoln Extension, Lancaster.
- Salmeron, M., Urrego, Y., Isla, R. and Cavero, J. (2012) Effect of Non-Uniform Sprinkler Irrigation and Plant Density on Simulated Maize Yield. Agricultural Water Management, 113, 1-9. http://dx.doi.org/10.1016/j.agwat.2012.06.007
- Ghinassi, G. (2012) Comparazione dell’efficacia agronomica ed economica dell’irrigazione effettuata con macchine irrigatrici semoventi e linee gocciolanti. DEISTAF, Università degli Studi di Firenze, Florence.
- ISO 9261, 2004 (2010) Agricultural Irrigation Equipment—Emitters and Emitting Pipe—Specification and Test Methods. Austrian Standards Institute, Wien.
- Christiansen, J.E. (1942) Irrigation by Sprinkling. University of California Agricultural Experiment Station Bulletin n. 670, 124.
- Merriam, J.L. and Keller, J. (1978) Farm Irrigation System Evaluation: A Guide to Management. Utah State University, Logan, Utah.
- Ghinassi, G. and Zammarchi, L. (2010) Irrigazione a goccia o a pioggia? Confronto costi e PLV su mais. Informatore Agrario, 23, 40-43.