Journal of Water Resource and Protection
Vol. 5 No. 9 (2013) , Article ID: 37434 , 7 pages DOI:10.4236/jwarp.2013.59094
Groundwater Annual Dynamics in the Basins of Woro and Chago (Eastern Niger) as Affected by Seasonal Variability and Anthropic Activities
1Abdou Moumouni University of Niamey, Niamey, Niger
2Institut National Polytechnique HB, Yamoussoukro, Ivory Coast
Email: moustapha_a@yahoo.com
Copyright © 2013 Adamou Mahaman Moustapha et al. This is an open access article distributed under the Creative Commons Attribution License, which permits unrestricted use, distribution, and reproduction in any medium, provided the original work is properly cited.
Received July 18, 2013; revised August 18, 2013; accepted August 29, 2013
Keywords: Basin; Groundwater; Drought; Evapotranspiration; Variation
ABSTRACT
The Sahelian region is known to have extremes climatic constraints since the end of the seventies. The studied zone is characterized by an extreme spatial and temporal variability of the environmental factors, complicating the understanding of the mechanisms governing the functioning of the hydrological system in the basin. The evapotranspiration was very high (1975 mm/an), whereas the local annual rainfall was around 300 mm/year. The piezometric data showed a rise of the groundwater level during the rainy season and a decrease in the dry season. The water balance obtained using the Penman-Monteith method showed the predominance of the evapotranspiration (75% to 80% of the rainfall) on the drainage (20% to 25% of the precipitations).
1. Introduction
Niger Republic covers an area of 1,267,000 km2 with a population estimated to 18 million [1]. The country is characterized by arid and semi-arid climate, with harsh environmental conditions, additionally to the rapid population growth, overexploitation of natural resources and widespread land degradation that lead to lower productivity and hence food insecurity.
Dune areas of Damagaram, were previously fixed by vegetation but are gradually being degraded due to the combined effects of drought and human activities [2]. This desertification process has led to the remobilization of sand dunes with a subsequent important silting of basins, the main source of agricultural production in these regions where agricultural potential is very limited. Currently, only 300 basins are being used out of the 900 recorded in 1977 by the Department of Agriculture. Agropastoralism is the most developed activity in these basins [2].
Overexploitation of these basins combined with climatic conditions has resulted in the loss of fertile farmland and their siltation, the declining of groundwater levels thus threatening the long-term water supply for the vegetation. The consequence of all these problems is the disappearance of certain species and several basins. Soghetta in Wazir [3] reported a gradual decline in groundwater level in the studied area during the years 1890, 1900 and 1920, a slight increase from 1920 to 1945 and since the drought periods of 1973-1974 and 1983-1984 there has been a declining trend in rainfall that feeds the layers, resulting in a significant water deficit.
The objective of this study was to evaluate the impact of human activities and climate on the water provision of basin by rainfall, the relationship between precipitation, evapotranspiration and the changes in the groundwater level.
2. Presentation of the Study Area
The Department of Goure covers an area of 89,404 km². It is situated in the Sahel region of Niger between 9˚20' and 12˚0' of longitudes East and 13˚8' and 17˚20' north latitude. In this department, two (2) villages were selected for the study: Tchago and Woro located respectively in the North-West and East (Figure 1).
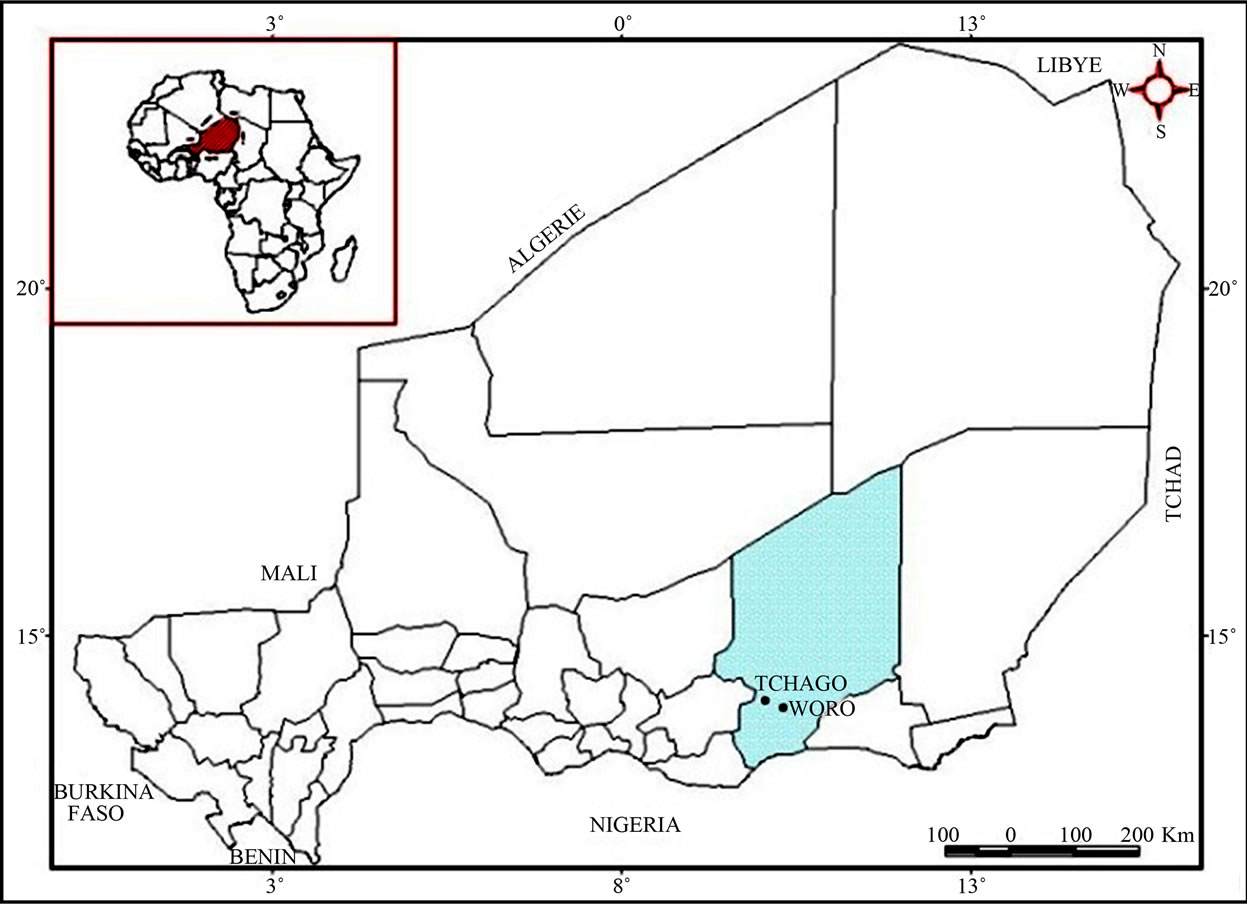
Figure 1. Location of the sites of the study.
In this part of Niger, the climate is Sahelian and characterized by reduced rainfall (20 to 400 mm per year) with a very high temporal and spatial variability. The rainy season covers 3 - 4 months per year in the southern part of the department, but the rainfall decreases toward the North. Precipitation is characterized by a high spatial and interannual variability. This trend has emerged since the drought of the 70s with a significant lowering of the isohyets 200 mm to the south. During 1968-1985 years the isohyet 400 mm coincided with 600 mm corresponding to the wet period (1950-1967) [4]. This has led to the transition of the area under rainfed crops (300 mm) into the pastoral zone [5]. The air temperatures range from 19˚C to 22˚C in winter (mid-December to mid-February) and 28.6˚C to 35˚C in the hot season (March to midDecember).
The annual average wind speed is around 6 m/s. At this speed, the wind is considered effective, i.e. able to initiate wind erosion.
For both sites, soils were quite homogenous because of the large extension of sandy blankets. These dunes can often hide various rocks under thin silting. Soils of dune systems are of brown-red type mainly developed on sands, except the soils of basins which have salty-sandy texture. At both locations, water and wind erosion generate different soil types. In the south-east side of the Woro basin fine sediment are transported to the center of the basin [6].
According to the classification of groundwater in eastern Niger established by Gavaud [7], the groundwater in the study area is continuous and fed along its northern part by the hydraulic system of the continental infill Sahara [8]. A second source discovered by Pirard cited by Bocquier [8] on the Manga border is represented by a zone of permanent lakes separated by dunes between Kargeri Mainé-Soroa, wherea groundwater flushes probably supplied by Komadougou Yobe from Nigeria.
Overall the shrub savanna woodland evolves from South to North in shrub-steppe dominated by Leptedania pyrotechnica, then to a Mimosaceae dominated steppe before reaching the big dunes in the north. The woody strate is made of Acacia albida, Acacia raddiana, Balanites aegyptiaca, in the bottom of the basin there are various fruit trees (Dattiers, guava, Mango, Lemon) and other plants (Henne and Baobab).
There is no permanent water flow throughout the study area. Few ponds can be found located in low-lying areas with impervious surface fed by runoff or near the branches of former river systems or the foothills. These pools are not permanent and are for the water needs of animals during the rainy season. Also, the beginning of the rainy season in late November water availability for livestock is significantly increased. From December onwards, ponds dry up and the animals gather around wells located in the basins.
The main activity of the Worro village is livestock with around 3400 Tropical Livestock Units [9]. In the dry season, these animals are around water points and basins for their water needs and grazing. The Worro bassin is called pastoral. By contrast, at Tchago, agriculture is the main activity. Rainfed crops (millet, sorghum, cowpea) are cultivated on the dunes sides and vegetable crops (tomato, cabbage, lettuce, squash, pepper, pepper, cassava, potato) and fruit (Dattiers, guava, Mango, Lemon, etc.) are produced in the basins.
3. Materials and Methods
3.1. Equipment Used
The experimental sites were equipped with two weather stations. The main station was installed on a dune around the basin, and the second station was placed in the middle of the basin. Both the two stations were equipped with a datalogger (Campbell CR 10X type). Solar panel energy supplies each station. Daily climate data from 1980 to 2005 for the department Gouré were obtained from the NOAA website (www.ncdc.noaa.gov).
3.2. Methods of Data Collection and Analysis
3.2.1. Hydrological Assumptions
The study area is characterized by the absence of surface runoff; rainfall is the main source of the Quaternary groundwater recharge, with 1 - 4 m depth. Thus in this study, for the water balance calculations, we assumed that after a rain when the usable water reserves of the soil is reached, any water excess percolates along the depth of the plant root. It was considered that the main crop in the area is millet, which has a well developed root system in sandy area and all the vegetation transpires as millet. For this study we restricted root depths to 0.6, 0.8 and 1 m.
3.2.2. Water Balance Calculations
The water balance was calculated using the equation: P = ETR − Dr ± Dru (mm) where P: precipitation, ETR: actual evapotranspiration, Dr: drainage, Dru: variation of the stock of water. Losses consist of ETR and Dr, which represent the water passing through the soil profile and are thus lost to the system “soil-plant-atmosphere”, the term Dru refers only changes in the stock of water in the soil.
Reference evapotranspiration (ETo) was determined from the Penman-Monteith equation recommended by FAO [10]:
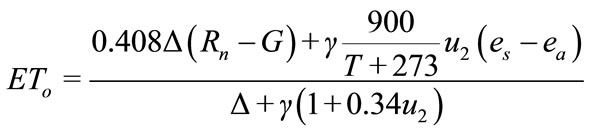
with : reference evapotranspiration (mm/day), R: net radiation of the reference surface (MJm/day) G: heat flux into the soil (MJm/day) at a daily time step, T: average daily temperature of the air at 2 m (˚C): average wind speed of 2 meters (m/s): saturation vapor pressure (kPa): actual vapor pressure (kPa): lack of saturation vapor pressure (kPa); slope of the curve of the saturation vapor pressure (kPa): psychrometric constant (kPa/˚C).
Drainage (Dr) is estimated from the values of ETo, ETR and TAW (the amount of water in the root zone and directly usable by the plant) determined using the equation of Pennman-Monteith.
Change in the stock of water in the soil (Dru) is determined by the time step water balance calculations. It can be positive if the balance is in surplus, negative if in deficit.
3.2.3. Piezometric Measurenments
The lack of a suitable network for monitoring groundwater has not yielded sufficient information to make a good distribution of measuring points throughout the study area. Thus for measurements of groundwater levels, eight (8) wells were identified of which five (5) in Tchago and three (3) in Woro.
The level readings were performed with a string (synthetic yarn) and a graduated float. These measurements were performed on the wells (traditional and modern) located in the basins.
4. Results and Discussion
4.1. Water Balance
● Evapotranspiration: in 2004 the annual cumulative value was 1832 mm: 711 mm for the rainy season (June to October) and 1121 mm for the dry season (November to May). The ET0 values were lower from July to September and maximum in March and April. These variations were mainly related to temperature and winds in the area [10].
● The actual values of evapotranspiration in the Tchago area varied from 0 to 1 mm/day during the dry season, reaching 4 - 5 mm/day during the winter season. The high value of ETR observed during the rainy season was due to the presence of water in the top layers of soil after rainfall and also by high vegetation activity during the months of July and August as confirmed by the results of the analysis of satellite images NOAA NDVI (Vegetation Index Normalized Difference) of the area.
● Precipitation: water intake in the basins was mainly composed of the drainage of rainwater. Like other climatic factors, there is a strong spatial and temporal variability of rainfall in the area. The annual average is 350 mm and the intensity and distribution of rainfall have had a greater impact on groundwater recharge.
● Evaporation flux from the groundwater: the study area was subject to high potential evaporation, thus promoting water seepage in the basement, and high evaporation during the dry season and winter. Evaporation values were estimated for the Sahel groundwater in Niger [11], to 1 - 10 mm/year depending on aquifers and static depths [12]. For unconfined aquifers of the study area, the evaporative flux theoretically acceptable was estimated using the equation developed by A. Coudrain cited by Massuel [13]. These flows were independent of the nature of the soil and evaporative conditions of the atmosphere. This formula has the advantage of not involving many parameters (porosity, permeability, etc.). The depth of the water in the basins were ranging between 4 and 6 m, the evaporative flow was very high and ranged from 5 to 9 mm/year, while at the level of sand dunes, particularly those belonging to Worro had a depth varying from 26 to 30 m, and an evaporation flux estimated to 0.45 and 0.59 mm/year.
The results of the water balance at the Tchago site for 2004, gave an idea of the importance of actual evapotranspiration in the Sahelian context. These values of high evapotranspiration were related to the evaporation rate of soil in the Sahel. They vary between 75% and 80% of the total precipitation. The drainage values were between 20% and 25% of rainfall. The major drainage in the area was due to the rising water in case of a significant rainfall in the area. However, in addition to the quantitative importance of rainfall, the temporal distribution is more important for the water balance.
4.2. Evolution of Groundwater Level
Sand dune groundwater experienced a decline for decades. This behavior compromises the long-term water supply for the local population and the existence of agropastoral basins called “Kore” (inters dune depressions with groundwater flush or sub-flush). Access points to the water wells are located in low areas where the groundwater level is low and drilling for deep horizons. Several types of wells can be distinguished in the area: sumps, pits traditional wooden (PT1), traditional wells cemented (PT2), modern wells (PM).
Investigations with villagers and piezometric measurements carried out show the total points a variation of groundwater levels depending on the time and place. Some of the sites experienced a rise of the static level shortly after the rainy season. The second rise peak in groundwater level, less than the first, was between December and January. This slight increase could partly be explained by the cold weather of the moment (the average temperature was 20˚C) and reduced water consumption by people, animals and vegetation. Figures 2 and 3 show the evolution of the groundwater level at Tchago
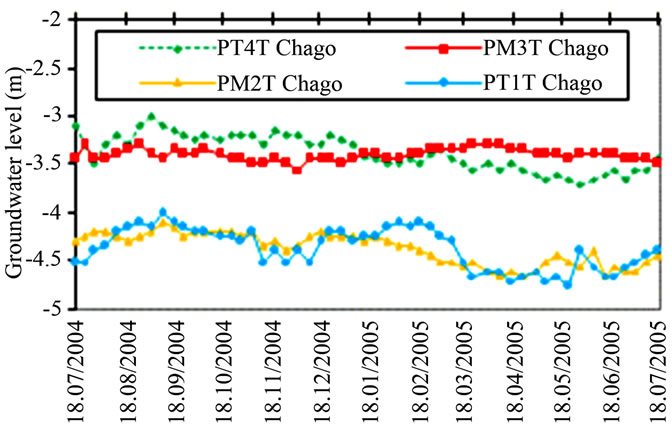
Figure 2. Evolution of the level of groundwater wells at Tchago.
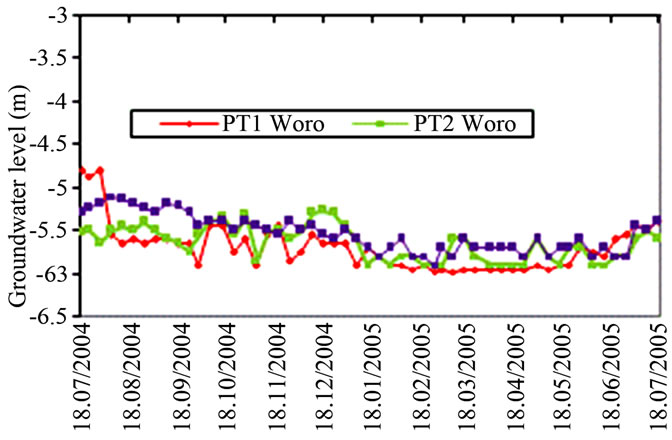
Figure 3. Evolution of the level of groundwater wells at Woro.
and Woro respectively.
At the end of February, there has been a general decline in groundwater levels throughout most of the area. This was the period of intensive exploitation of water resources in the area: irrigation of vegetable crops, harvesting and watering domestic animals. Users frequently witness the drying up of wells during this period. This phenomenon can be explained by the particular endorheic systems functioning where the water flush or subflush, would be likely to experience significant losses through evapotranspiration (6 mm/day) during drought spells.
The only records of the water level carried out on two sites do not allow to study the dynamics in relation to rainfall for a long period. Nevertheless, these surveys showed that the roof of the dune groundwater was going down, especially during the dry period. At Tchago, there are two classes of wells according to the fluctuation of the groundwater level:
● The first category includes wells PT1, PT4 and PM2 (all located in the village of Tchago) under high pressure due domestic uses, livestock watering and gardening. These last two were increased in the dry season because during the rainy season, animals drink at the pools. This explains the lower level of the water during the period January-June;
● The second category is well represented by the PM3 wells, located near the live dune in East Tchago. The stability of the groundwater level in this well was due to the non-use of wells, their water being of poor quality. Indeed, the very low position of the well edges, led to frequent floods after the rains. The villagers do use it only when other wells dry up.
● At Worro, the level of the water varied from one well to another. In this pastoral village, animals drink almost always water from wells, except during the rainy season. In this basin, there are a few plots of vegetables. These agropastoral activities could explain the consistently low level of the water in the basin from February to June.
4.3. Sequence Analysis of Changes in Groundwater Levels
Results are divided in two parts for each site: 1) the behaviour of the groundwater during the dry season, and 2) the groundwater recharge capacity during the rainy season.
At Tchago: well used is the PT1Tchago, because of its location near the village. It is highly sought for domestic purposes, watering and irrigation of vegetable crops. Figures 4-7 show the variations of the groundwater level during the rainy season and the dry season.
During the rainy season, there is an increasing trend of groundwater levels reaching a peak in early September. In late September, the level decreased gradually. Level of fluctuation between morning and evening was regular: the maximum variation between the average in the morning and in the evening was about 0.1 m during the rainy season, while reaching 0.25 m during the dry season. This could be related to the first rain in the area where all the inhabitants of the village were in the fields for planting. In general, we found that the rise of the water took place during the rainy season and was strictly related to
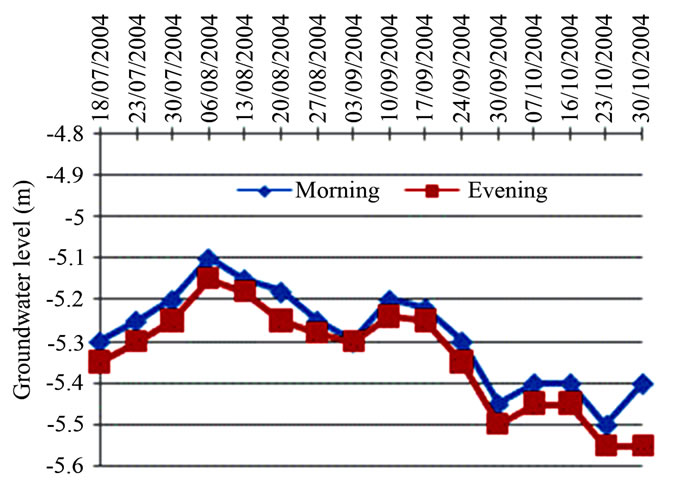
Figure 4. Fluctuation of table water level in morning and evening in Tchago during rainy season.
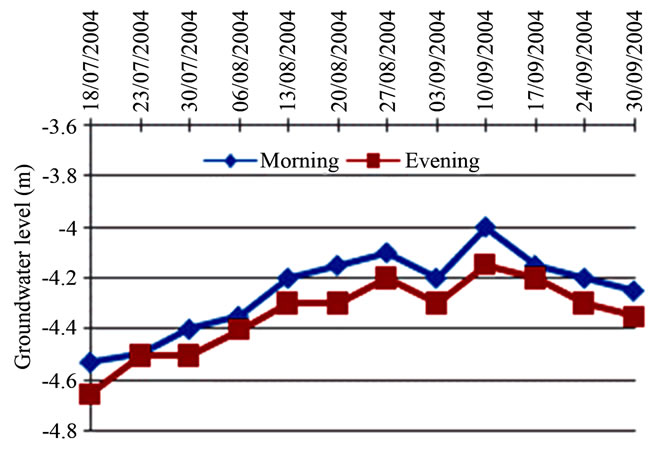
Figure 5. Fluctuation of groundwater level on morning and evening in Woro during the rainy saison.
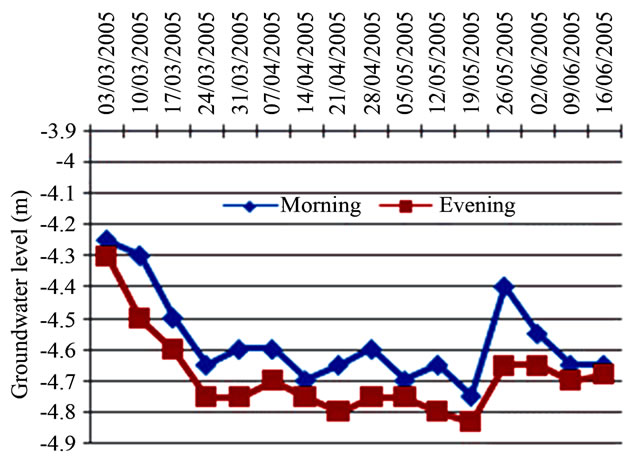
Figure 6. Fluctuation of groundwater level on morning and evening in Tchago during the dry saison.
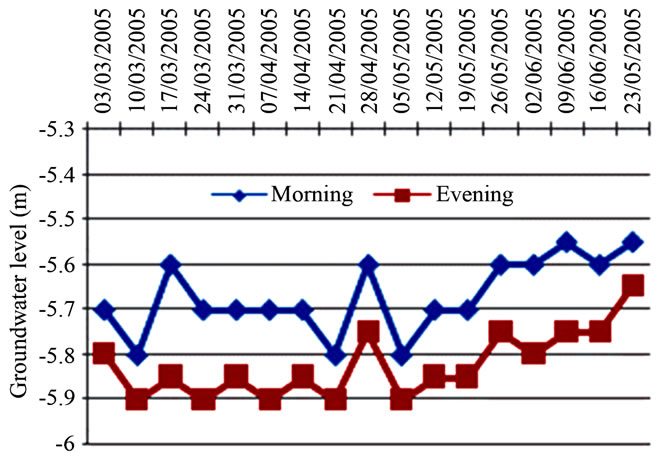
Figure 7. Fluctuation of groundwater level on morning and evening in Woro during the dry saison.
rainfall. Discharge levels observed in late September could be explained in part by the end of the rains in this period and other pressure on village wells for livestock watering and gardening. Favreau [11] showed that the influence of bailing wells at Banizoumbou (western Niger) for certain specific records of the static water level at the end of the night was of few centimeters or decimetres; except in early July where the same level of the groundwater was observed in the morning and evening.
At Woro: Figures 4-7 show the variation of the groundwater level between the morning and evening during the rainy and dry periods. During the rainy season, the rising water was saw tooth.
The level changed from the second half of July to early August; the maximum corresponding to the period of concentration of rainfall. This rise continued until September. Periods of recharge and discharge of the water during this sequence were observed. The variations between the morning and evening are low and regular. The variation of groundwater level between morning and evening during the rainy season was about 0.05 m at Woro, which means that during this period the wells are less used and the drainage of rainwater contributed to the charging of the groundwater.
The maximum variation of the water in the dry season was around 0.20 m. This fluctuation can be explained by the returning the animals to the wells like at Tchago. Watering during this period took place throughout the day and continued until the night for some herders passing through this area. These results are conforming to the studies conducted in sedimentary basins through Nigeria republic [14-17].
5. Conclusion
In the Sahel, particularly the Southeast Niger, the lasting crisis of groundwater fluctuation caused by low rainfall and ecosystem degradation, reinforces the need for sound management of water resources. The present study which focused on the issue of groundwater levels decline has developed, despite the lack of long period data, a methodology for estimating the evapotranspiration and percolation in the studied area using the Penman-Monteith model. This model allowed quantifying reference values of evapotranspiration for two different environments (basin, dune), the actual rate of evapotranspiration and the estimation of percolation in the studied zone through rainfall data on a long period. The results were used to characterize the climate of the studied area. However, the short duration of data collection, the malfunction of certain measuring devices and the peculiarity of the year of study, do not allow tangible conclusions.
6. Acknowledgements
This study was carried out in the framework of the Inter University Targeted Research on silting basins: processes, impacts and control methods. Funded by the University Commission for Development, this project brings together scientists from Belgium (Université de Liège, Université Catholique de Louvain and the University Faculty of Agronomic Sciences of Gembloux) and Niger (University of Niamey).
REFERENCES
- Institut National de la Statistique, “Résultats Provisoires du Recensement Général de la Population et de l’Habitat,” RGP/H, 2013, 2 p.
- PROJET PIC, “Envahissement des Cuvettes par Apports Eoliens dans l’Arrondissement de Gouré: Analyse des Processus, Etude d’Impacts, Moyens de Lutte et Remé- diation,” Rapport, 2002, 83 p.
- M. Waziri, “Les Cultures de Contre Saison dans le SudEst de la Région de Zinder,” Thèse de Doctorat, de 3ème Cycle; 2000, 212 p.
- P. Ozer and M. Erpicum, “Méthodologie Pour une Meilleure Représentation Spatio-Temporelle des Fluctuations Pluviométriques Observées au Niger Depuis 1905,” Revue Sécheresse, No. 6, 1995, pp. 103-108.
- P. Ozer, “Contribution à l'Etude de la Désertification en Région Sahélienne. Le cas du Niger. Problèmes Posés par les Précipitations et les Lithométéores,” Mémoire de Licence en Sciences Géographiques, Université de Liège Faculté des Sciences Liège Belgique, 1993, 177 p.
- A. D. Tidjani, “Impact de l’Occupation du sol par l’Ensablement des Cuvettes par Apports Eoliens dans le Damagaram Est (Sud-Est du Niger),” Mémoire de DEA, Université Catholique de Louvain, 2005, 85 p.
- M. Gavaud, R. Maignien, P. Goffre and E. Duverger, “Etude Pédologique des Plaines de Foulasso et Lelasso,” ORSTOM, Dakar, 1960, 62 p.
- G. Bocquier and M. Gavaud, “Etude Pédologique du Niger Oriental,” Edition ORSTOM, 1964, 73 p.
- M. Boutari, “Etude Socio-Economique des Cuvettes de Gouré. Mémoire d’Ingénieur des Techniques Agricoles,” Université Abdou Moumouni, 2004, 56 p.
- FAO, “Crop Evapotranspiration—Guidelines for Computing Crop Water Requirement,” Bulletin de la FAO “Irrigation and Drainage” No. 56, 1994, 123 p.
- G. Favreau, et al., “Groundwater Recharge Increase Inducted by Land—Use Change: Comparaison and Isotopic Estimates in Semiarid Niger,” 2001, 47 p.
- C. Leduc, J. Bromley and P. Schroeter, “Water Table Fluctuation and Recharge in Semi-Arid Climate: Some Results of the Hapex-Sahel Hydrodynamic Survey (Niger),” Journal of Hydrology, Vol. 188-189, 1997.
- S. Massuel, “Modélisation Hydrologique de la Nappe Phréatique Quaternaire du Bassin du Lac Tchad,” DEA en Sciences de l’Eau dans l’Environnement Continental, Université de Montpellier II, 2001, 87 p.
- C. N. Enuvie, P. C. Lare and T. C. Egeonu, “Anomalous Delay in the Response of Groundwater Level to Seasonal Rainfall Variations, in Parts of Imo State, Nigeria, A Preliminary Study,” Journal of Mining Geology, Vol. 27, 2005, pp. 6-10.
- A. C. Ekwe, N. N. Onu and K. M. Onuoha, “Estimation of Aquifer Characteristics from Electrical Sounding Data, the Case of Middle Imo River Basin Aquifers S.E. Nigeria,” 2000, pp. 28-32.
- K. M. Ibe, G. I. Nwankwor and S. O. Onyekuru, “Assessment of Groundwater Vulnerability and Its Impact to the Development of Protection Strategies for Water Supply Aquifer in Owerri S.E. Nigeria,” Environmental Monitoring and Assessment, Vol. 67, No. 3, 2001, pp. 323- 360.
- A. A. Onunkwo, A. P. Uzoije, B. I. B. Igbokwe and I. L. Okoroji, “Unerground Water and Pollution Vulnerability Assessment of Lower Imo Sedimentary Basin of South Eastern Nigeria: A Case Study of Nwangele Local Government Area of Imo State, Nigeria,” Journal of Environmental Science and Water Resources, Vol. 1, No. 4, 2012, pp. 105-114.