Journal of Water Resource and Protection
Vol. 3 No. 6 (2011) , Article ID: 5741 , 11 pages DOI:10.4236/jwarp.2011.36053
Influence of Temperature on Equilibrium, Kinetic and Thermodynamic Parameters of Biosorption of Cr(VI) onto Fish Scales as Suitable Biosorbent
Department of Chemical Engineering, Indian Institute of Technology Guwahati,
Guwahati, India
Email: kmohanty@iitg.ernet.in
Received March 29, 2011; revised May 4, 2011; accepted June 6, 2011
Keywords: Biosorption, Chromium; Kinetics, Low-Cost Biosorbent, Wastewater Treatment
ABSTRACT
In this work the potential of fish scales as a suitable biosorbent for removal of Cr(VI) ions from aqueous solutions was investigated at various temperatures. The influence of temperature on equilibrium, kinetics as well as thermodynamic parameters was investigated. Various isotherm models such as Langmuir, Freundlich, R-P, D-R, Temkin and Halsey were used for the mathematical description of the biosorption of Cr(VI) ions onto fish scales. It was observed that Freundlich model exhibited the best fit to experimental data. Amongst the various kinetic models tested, the pseudo-first-order kinetic model represented the best correlation for the biosorption of Cr(VI) onto fish scales at various temperatures. In addition, various thermodynamic parameters such as ∆Go, ∆Ho and ∆So were also determined. The biosorption of Cr(VI) was found to be a spontaneous and endothermic process.
1. Introduction
Water pollution by heavy metals has been a major cause of concern for the environmental scientists all over the world since almost three decades. One such heavy metals of concern is chromium. Elemental chromium is a transition-group metal belonging to group VIB of the periodic table and has oxidation states ranging from –2 to +6, of which the divalent, trivalent, and hexavalent forms are the most important. Elemental chromium does not occur naturally in the environment. The divalent (chromous) state is readily oxidized to the more stable trivalent (chromic) state. Although the hexavalent (including chromates) state is more stable than the divalent state, it is rarely found in nature. Cr(VI) compounds are strong oxidizing agents and are highly corrosive. Strong exposure of Cr(VI) causes cancer in digestive tract and may cause epigastric pain, nausea, vomiting, severe diarrhea and hemorrhage. Cr(VI) has an adverse potential to modify the DNA transcription process [1,2].
Hexavalent Chromium is known to be human carcinogen based on sufficient evidence of carcinogenicity in humans. Epidemiological studies in various geographical locations have consistently reported increased risks of lung cancer among workers engaged in chromate production, chromate pigment production, and chromium plating. Chromium and its compounds are widely used in metal finishing and chrome plating, in leather tanning, and in wood preservative industries producing large quantities of toxic pollutants and also used in textile dyeing processes, printing inks, drilling muds, pyrotechnics, water treatment, and chemical synthesis [3,4,5].
Of the various treatment techniques available for chromium removal, the most commonly used ones are ion exchange, electro-dialysis, membrane filtration, chemical precipitation and adsorption. These methods suffer from disadvantages such as high reagent and energy requirements, incomplete metal removal, and generation of large quantity of toxic waste sludge [6,7]. However, these technologies are most suitable in situations where the concentrations of heavy metal ions are relatively high. Some of these treatment methods involve high operating and maintenance cost and also produces secondary pollution there by limiting their applications. Therefore, there is a need to look for some alternative technique, which is efficient as well as cost effective.
Biosorption is currently gaining importance as one of the most promising technique for removal of heavy metals. The major advantages of biosorption over other conventional treatment methods are: low operating cost, high efficiency of metal removal even at low concentrations, easy to operate, no additional nutrient requirements, short operation time and improved selectivity for removal of heavy metals from effluent irrespective of toxicity [1,5,7]. Biosorption is an energy-independent method of binding metals to the cell wall of biomass and utilizes the ability of biological materials to accumulate heavy metals from waste streams by either metabolically mediated or purely physico-chemical pathways of uptake [8]. Biosorption has gained increased credibility during recent years, as it offers a technically feasible and economical approach.
Several biological materials were investigated for the removal of heavy metals using this technique. A wide range of non living biomass like bark, lignin, peanut hulls as well as live biomass like fungi, bacteria, yeast, moss, aquatic plants and algae has been used as biosorbent [9-12]. For removing heavy metals both live and dead biomass can be used, but dead biomass offers advantages, as it is not subjected to operational environmental shocks like change in pH, temperature, presence of inhibitors etc. Moreover, nutrient supply is not required, and metal recovery is easy. Such biosorbents are very efficient in biosorption due to various functional groups present on their cell walls which helps in the process of adsorption.
The major objective of this study was to investigate the effect of temperature on biosorption of Cr(VI) while evaluating the potential of fish scales as the biosorbent. The fitness of biosorption equilibrium data for various isotherm models were used for the mathematical description of the adsorption of Cr(VI) ions onto fish scales depending on temperature. Different kinetic models were used to identify the possible mechanism of biosorption. The thermodynamic parameters were also evaluated from the biosorption experiments.
2. Materials and Methods
2.1. Preparation of the Biosorbent
Fish scales (predominantly Catla catla with little amount of Labeo rohita) were collected from the fish market located in Amingaon near IIT Guwahati. Collected Fish scales were washed repeatedly with water to remove impurities from their surface. After cleaning fish scales were rinsed with deionized water and dried for two days under the sun. The dried fish scales were converted into fine powder by grinding in a grinder (Bajaj, Model GX7) and kept in the oven at 70˚C for 2 h for removing moisture. The fine powder was sieved through 100 µm, 120 µm, 150 µm, 200 µm and 240 µm using screen seiver to obtain homogeneous known particle size of different fractions. These powdered biosorbent is then preserved in airtight polyethylene containers for further use. All the chemicals/reagents used in these studies were of analytical reagent grade and purchased from Merck, Germany; S. D. Fine Chem. Ltd., India and Rankem, India.
2.2. Preparation of Stock Solution
The stock Cr(VI) solution (1000 mg·L–1) was prepared by dissolving 2.8269 g of potassium dichromate (K2Cr2O7) in 1000 mL of deionized water and shaking it for complete dissolution. This stock solution was diluted to obtain standard solutions, of various concentrations.
2.3. Batch Sorption Experiments
Batch sorption experiments for kinetic studies were carried out in 250 mL conical flasks at natural solution pH (5.85). Dry native biosorbent were thoroughly mixed individually with 100 ml of stock solution with different initial concentrations and the suspensions were shaken at different temperature (20 to 60˚C) using an incubator shaker (Daihan LabTech Co. Ltd, Model LSI-3016R). Samples of 5 mL were collected from the conical flasks at required time intervals viz. 20, 40, 60, 80, 100, 120, 150, 180, 210 and 240 min and were filtered through Whattman No. 1 filter paper. The filtrates were analyzed by UV-Spectrophotometer (Perkin Elmer, Model Lamda 35) for residual chromium concentration in the solution. The isotherm studies were carried out by varying temperatures from 20 to 60˚C at the natural pH of the solution by adding optimum dose of the biosorbent. From our initial experiments it was found that 0.05 g·L–1 is the optimum biosorbent dose. All the data presented in this manuscript are average of three experimental runs.
2.4. Metal Uptake
The biosorption equilibrium uptake capacity for each sample was calculated according to mass balance on the metal ion expressed as,
 (1)
(1)
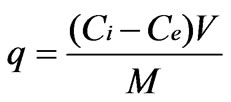
where q is the equilibrium metal uptake capacity (mg g–1), V is the volume of the solution (l) and M is mass of biosorbent (g), Ci is the initial metal ion concentration (mg·L–1) and Ce is the equilibrium or final metal ion concentration (mg·L–1).
The extent of sorption in percentage is found from the relation,
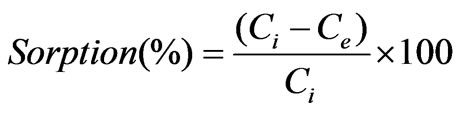 (2)
(2)
2.5. Estimation of Standard Error
All the model parameters were evaluated by non-linear regression using MS Excel. The optimization procedure requires an error function to be defined in order to be able to evaluate the fit of the equation to the experimental data [12]. Apart from the correlation coefficient (R2), the residual or sum of squares error (SSE) and the standard error (S.E) of the estimate were also used to measure the goodness-of-fit.
SSE can be defined as:
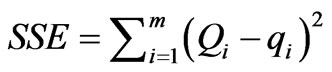 (3)
(3)
Standard error (S.E) of the estimate can be defined as:
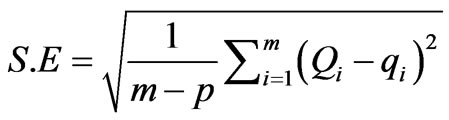 (4)
(4)
where qi is the observation from the batch experiment i, Qi is the estimate from the isotherm for corresponding qi, m is the number of observations in the experimental isotherm and p is the number of parameters in the regression model. The smaller S.E. value indicates the better curve fitting.
3. Results and Discussion
3.1. Effect of Temperature on Metal Uptake
The contact time was evaluated as one of the most important factors affecting the biosorption efficiency and it is important that the experimental solution be allowed significant time to attain equilibrium. The biosorption efficiency increases with rise in contact time up to 180 min at 20 to 60˚C and after that it is almost constant. Figure 1 shows the biosorption efficiency as a function of contact time and temperature. It can be concluded that the rate of Cr(VI) binding with biosorbent is more at initial stages, which gradually decreases and become almost constant after an optimum period of 180 min at various temperatures (20 to 60˚C). The optimum contact time was selected as 180 min for further experiments. Below equilibrium time, an increase in the temperature leads to an increase in the Cr(VI) adsorption, which indicates kinetically controlled process [4,6].
3.2. Effect of Initial Cr(VI) Concentration
The biosorption of Cr(VI) was carried out at five different temperatures (20 to 60˚C) for three different concentrations (10, 30 and 50 mg·L–1). Figure 2 shows the effect of initial Cr(VI) concentration on uptake capacity on fish scales at different temperature by using three different concentration. At 20˚C, when the initial Cr(VI) concentration increased from 10 to 50 mg·L–1, the uptake capacity of fish scales increased from 2.51 to 4.28 mg·g–1. With the change in temperature from 20 to 60˚C, the uptake capacity and biosorption yield increased from 2.51 to 8.27 mg·L–1 for various concentrations respectively.
The increase of the biosorption yield and biosorption capacity at increased temperature indicated that the adsorption of Cr(VI) ions by fish scales may involve not only physical but also chemical sorption [7,8]. This effect may be due to the fact that at higher temperature an increase in active sites occurs due to bond rupture. The adsorption capacity increases with increase in solution temperature. This indicates that the adsorption of Cr(VI) on fish scales is an endothermic process [13].
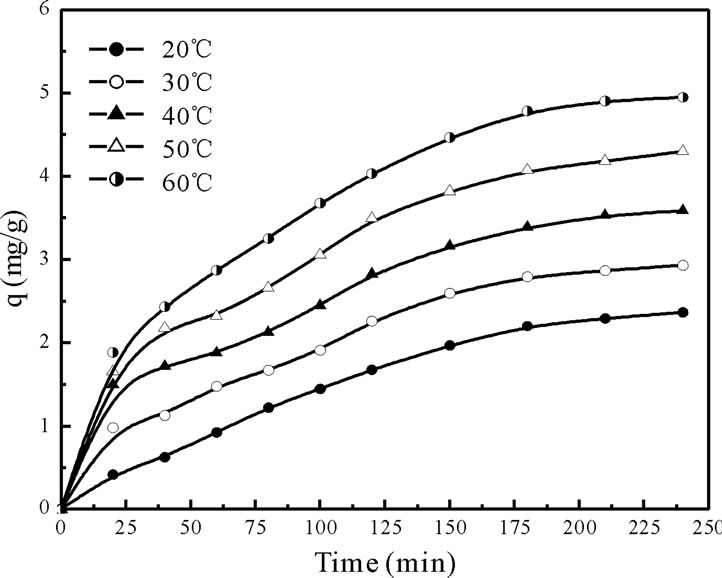
Figure 1. Effect of contact time on the removal of Cr(VI) onto Fish scales at different tempertures.
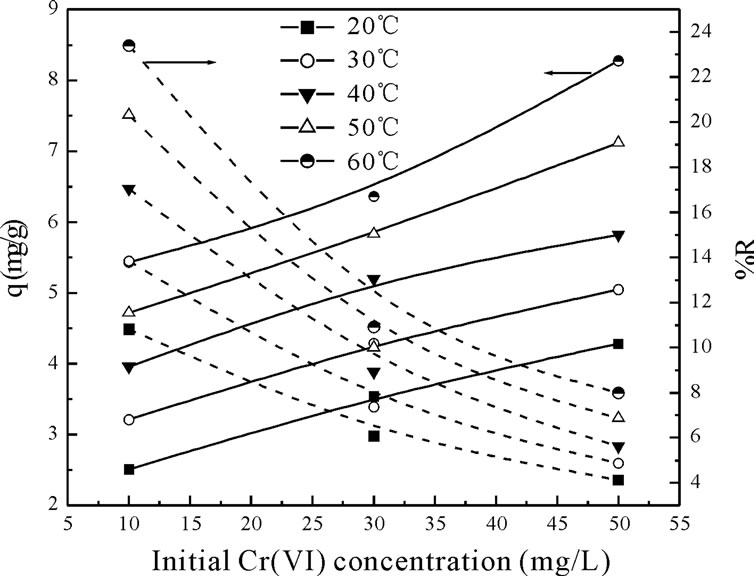
Figure 2. Effect of initial Cr(VI) concentration on uptake capacity on Fish scales at different temperature by using three different concentration.
The temperature also remarkably influenced the equilibrium metal uptake as shown in Figure 2. The increase in the equilibrium sorption of Cr(VI) with temperature indicates that Cr(VI) ions removal by adsorption on fishscales favors at higher temperatures. This may be a result of increase in the mobility of the Cr(VI) ion with temperature. An increasing number of molecules may also acquire sufficient energy to undergo an interaction with active sites at the surface. Furthermore, increasing temperature may produce a swelling effect within the internal structure of the fish scales enabling large metal ions to penetrate further [4]. The increase of Cr(VI) removal with the initial Cr(VI) concentration is due to higher availability of Cr(VI) ions in the solution. The initial Cr(VI) concentration in the solution provides an important driving force to overcome mass transfer resistance of metal ions between the aqueous and solid phases [8].
3.3. Biosorption Kinetics
To evaluate biosorption dynamics one of the major parameter is kinetics and the kinetic models like fractional power, zeroth-, first-, second-, pseudo-first-, pseudo-second-order and intraparticle diffusion are used to test the experimental of biosorption data.
A simple kinetic analysis for sorption of Cr(VI) on to fish scales has been tested according to fractional power model [14].
 (5)
(5)
 (6)
(6)
where qt is amount of sorbate sorbed at time t (mg g-1); k and  are fractional power model constants and Table 1 shows the estimated parameters of the model. The constant
  was less than 1, correlation coefficients values were high (i.e. R2 > 0.9534) and standard error values were low. The results indicate that the fractional power model was unable to describe the time-dependent Cr(VI) sorption by fish scales.
Experimental data were tested by the following zero-first-and second-order kinetic models:
 (7)
(7)
 (8)
(8)

 (9)
(9)
The linear form of first-and second-order rate Equation is the most widely used for the sorption of a solute from a liquid solution and is given as:
 (10)
(10)
 (11)
(11)
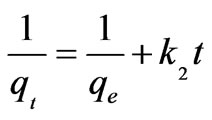
where qt is amount of sorbate sorbed at time t (mg·g–1); qe is amount of adsorbate adsorbed at equilibrium (mg·g–1); k0, k1 and k2 are zeroth, first and second order sorption rate constants. The kinetic constants are to be used to optimize.
The residence time of a biosorption process. The values of kinetic constants k0, k1 and k2 are of zeroth, first and second order Equations respectively, for the sorption of Cr(VI) by fish scales are presented (figures are not shown) in Table 1 The result indicate that, all the three kinetic models were having low correlation coefficient values and the standard error values were very high in order of zeroth > first > second order. The experimental values of qe,exp also do not match the theoretical values of qe. Due to this reason these kinetic models were not applicable in the present case. Further to analyze the adsorption kinetics of Cr(VI) ions, three widely used kinetic models, viz., the pseudo-first-order, pseudo-secondorder and intraparticle diffusion were tested.
Table 1. The fractional power, zeroth, first and second order rate constants.
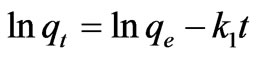
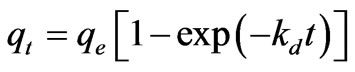
The linear form of pseudo-first-order rate Equation is generally used for the sorption of a solute from a liquid solution and is given as [15]:
 (12)
(12)
 (13)
(13)
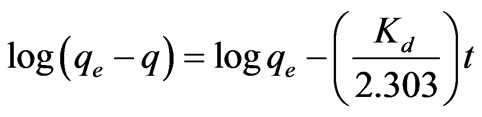
where qe and qt are the amount of the Cr(VI) ions adsorbed per unit mass at equilibrium and at time t (mg·g–1) and Kd is the pseudo-first-order sorption rate constant (min–1).
Figure 3 shows the experimental data fitting for pseudo-first-order Equation at various temperatures. The linear plots of time t versus log (qe-qt) at different temperatures indicate the applicability of the Equation. The values of Kd along with regression coefficients and standard errors and the related parameters are summarized in Table 2. The result indicate that correlation coefficients were good (i.e. R2 > 0.9708), standard error values were low and the experimental values of qe,exp are very close to the theoretical qe values. Based on these results it can be concluded that pseudo-first-order kinetic model fitted well for the biosorption of total chromium onto fish scales at various temperatures.
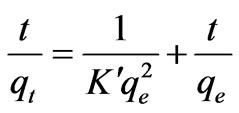
The pseudo-second-order kinetic model is expressed in the following form [16,17]:
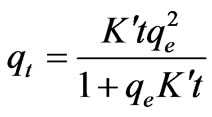 (14)
(14)
 (15)
(15)
where qe is the maximum adsorption capacity (mg·g–1) for the pseudo-second-order adsorption; qt the amount of Cr(VI) ions adsorbed at equilibrium at time t (mg·g–1); K is the equilibrium rate constant of psedo-second-order adsorption (g·mg–1·min–1). Pseudo-second-order kinetic model is used to predict the kinetic behavior of adsorption with chemical sorption being the rate-controlling step [16,17] and also this model is widely used to describe non-chemical and non-physical equilibrium. This model assumes that two reactions are occurring, the first one is fast and reaches equilibrium quickly and the second is a slower reaction that can continue for long time [12]. The reactions can occur either in series or in parallel. The initial sorption rate has been widely used for evaluation of the sorption rates. The linear plots of t/qt versus t for the pseudo-second-order kinetic model at various temperatures (20 to 60˚C) were shown in Figure 4 The values of the reaction rate constants and correlation coefficients and standard errors are listed in Table 2 The results indicate that standard error values were high, the correlation coefficients values were low. (i.e. R2 < 0.9733) and qe values were not very close to qe,exp values.
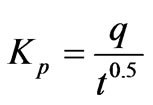
The kinetic results were also analyzed by using the intra-particle diffusion model because the psedo-first-order and pseudo-second-order kinetic models could not identify the adsorption mechanism clearly. According to this model, intra-particle diffusion is the rate-controlling step if the lines passes through origin and the plot should be linear. Otherwise it is an indicative of some degree of boundary layer control which indicates that intra-particle diffusion is not only the rate-limiting step, but also other mechanisms (like physical adsorption, ion-exchange etc.) may control the rate of adsorption [6]. The intra-particle diffusion model given by Weber and Morris [18] is:
 (16)
(16)
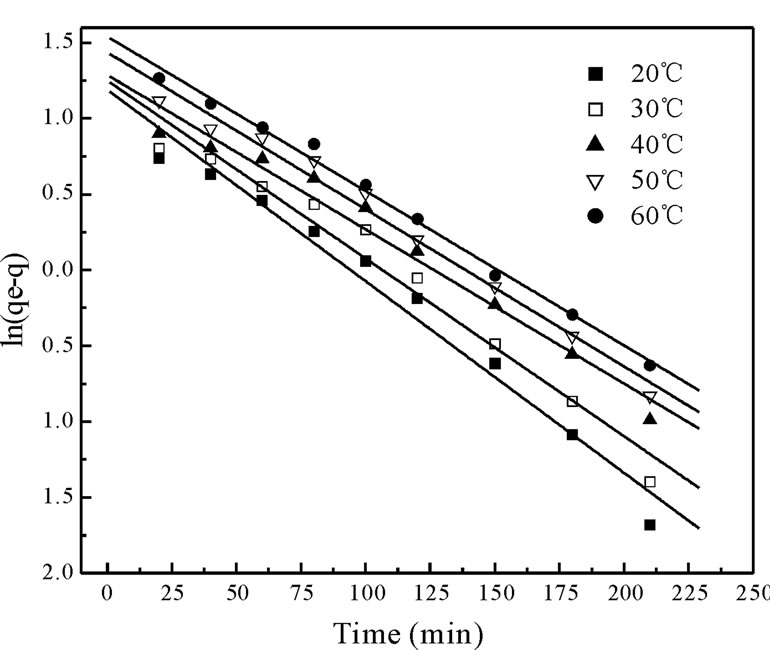
Figure 3. The plot of the pseudo first order biosorption kinetics of chromium on Fish scales at different temperatures.
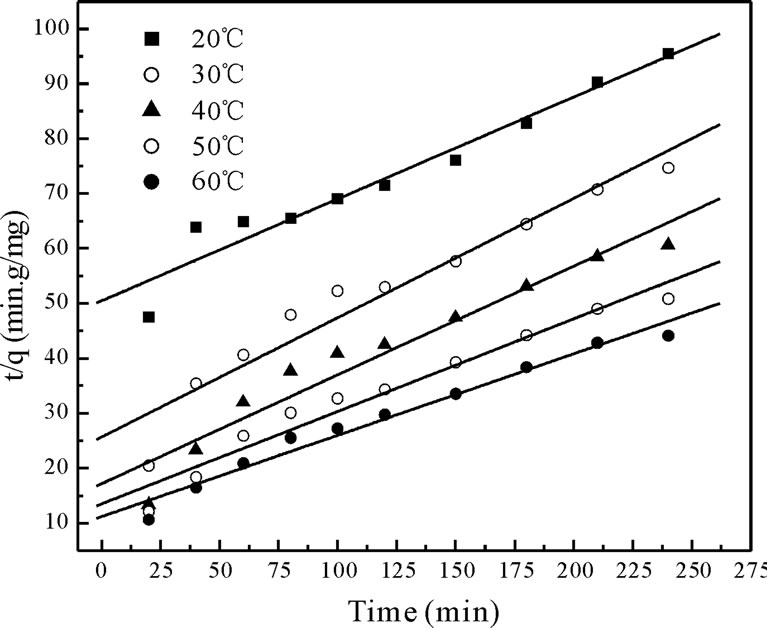
Figure 4. The plot of the pseudo second order biosorption kinetics of chromium on Fish scales at different temperatures.
where qt the amount of Cr(VI) ions adsorbed at equilibrium at time t (mg·g–1); Kp is initial rate of the intraparticle diffusion (mg·g–1·min–0.5). The initial portion of the plot indicated an external mass transfer whereas the second linear portion is due to intra-particle or pore diffusion Figure 5 The intercept of the plot provides an estimation of the thickness of the boundary layer, i.e. the larger the intercept value the greater is the boundary layer effect. By using Equation (16) the slope of the plot was calculated as intra-particle diffusion rate constant Kp (mg·g–1·min–0.5). In addition the theoretical qe values were close to the experimental qe,exp values, the standard error values were low and the correlation coefficients values were also high (0.9534 > R2 < 0.9931) as shown in Table 2.
The pseudo-second-order model’s qe values were far off from the qe,exp values with a higher standard error values and low correlation coefficients (R2 < 0.9733). The intra-particle diffusion model gave better qe values compared to the pseudo-second-order model along with a better standard error values and correlation coefficients. The above results suggested that the pseudo-first-order kinetic model represented the best correlation for the biosorption of total chromium onto fish scales at various temperatures.
3.4. Biosorption Isotherms
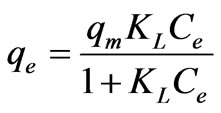
Equilibrium data, generally known as adsorption isotherms, are one of the most important data to understand the mechanism of the adsorption. Adsorption equilibrium data which expresses the relationship between mass of adsorbate per unit weight of adsorbent and liquid phase equilibrium concentration of adsorbate are represented by adsorption isotherms and provide important design data for adsorption system. Different isotherms were tested for their ability to correlate with the experimental results by comparing theoretical plots of each isotherm with the experimental data for the biosorption of Cr(VI) ions on fish scales at different temperatures. To describe the equilibrium between adsorbed Cr(VI) ions on fish scales (qe) and Cr(VI) ions in solution (Ce) at various temperatures different classical adsorption isotherm two-parameter models namely Langmuir, Freundlich, Redlich-Peterson, Dubinin-Radushkevich (D-R), Tem kin and Halsey were used (plots not shown here). The isotherm constants, correlation coefficient (R2), the residual or sum of squares error (SSE) and the standard error of the estimate (SE.) of these models for sorption of Cr(VI) on fish scales at different temperatures (20 to 60˚C) were presented in Table 3 scales will be in equilibrium with Cr(VI) ions in bulk solution. The model assumes uniform energies of adsorption on to the surface and no transmigration of adsorbate in the plane of the surface [19,20]. The Langmuir adsorption isotherm assumes that adsorption occur at specific homogeneous sites within the adsorbent and has found successful application in many monolayer adsorption process.
The Langmuir model assumes that the uptake of Cr(VI) ions once a homogenous surface by monolayer adsorption without any interaction between adsorbed ions. At different temperatures, Cr(VI) ions held onto the fish.
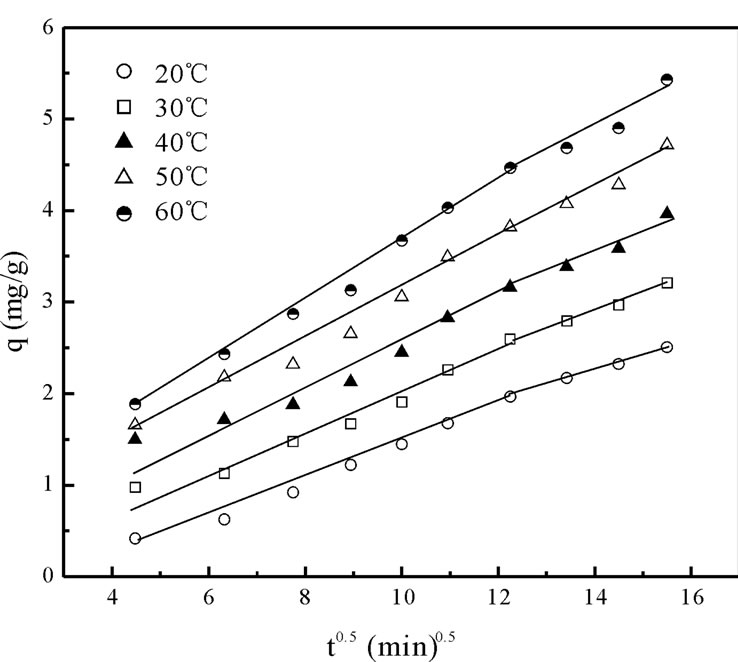
Figure 5. Intraparticle diffusion plots for the biosorption kinetics of chromium on Fish scales at different temperatures.
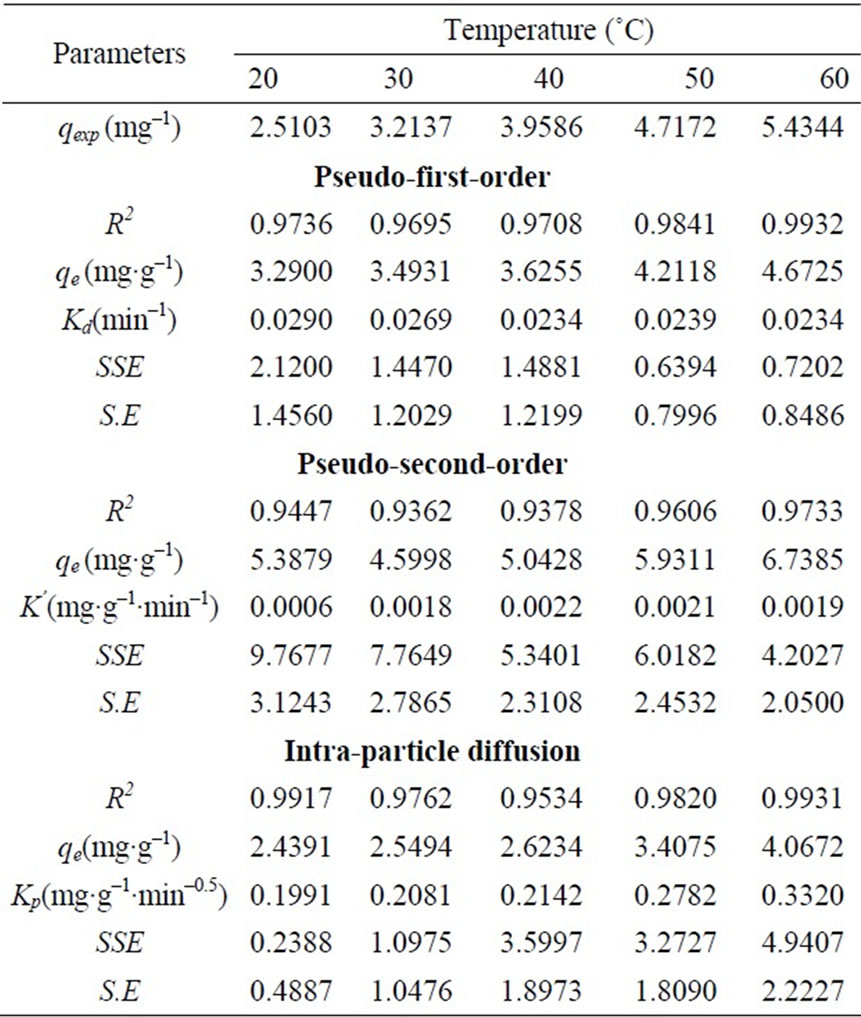
Table 2. The pseudo-first order Lagergren, Pseudo-secondorder and Weber & Morris constants.
Langmuir isotherm can be defined according to the following formula:
 (17)
(17)
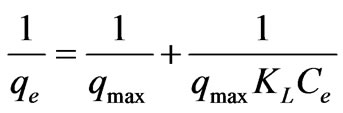
The linear form of the Langmuir isotherm equation is:
 (18)
(18)
where Ce is the equilibrium concentration (mg·L–1); qe the amount of metal ion sorbed (mg·g–1); qm is qe for a complete monolayer (mg·g–1); KL is Langmuir biosorption constant (L·mg–1) and is related to the free energy of biosorption. A plot of 1/qe versus 1/Ce for the adsorption gives a straight line of slope 1/(qmaxKL) and intercept 1/qmax. Equation (17) can be linearized in logarithmic form Equation (18) and the Langmuir constants can be determined. The KL values were increased from 0.0943 to 0.2019 (L·mg–1) and the maximum biosorption capacity (qm) was found to be 5.0581 to 8.4603 (mg·g–1) with increase in temperature from 20 to 60˚C and the correlation coefficients, standard error values were shown in Table 3. The effect of isotherm shape has been discussed with a view to predict whether the biosorption system is favorable or unfavorable. The rise in sorption capacity with temperature was because of rise in the kinetic energy of sorbent particles. Thus, the collision frequency between sorbent and sorbate increased, which resulted in the enhanced sorption on to the surface of the sorbent. Due to bond rupture at high temperature, there may be an increase in number of active sorption sites, which may lead to enhanced sorption.
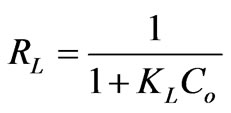
The essential characteristics of the Langmuir isotherm can be expressed in terms of dimensionless constant separation factor RL, calculated using the following equation:
 (19)
(19)
where KL is the Langmuir constant (L·mg–1) and Co the initial Cr(VI) concentration (mg·L–1).
The maximum adsorption capacity (qmax) of biosorbent calculated from Langmuir isotherm Equation defines the total capacity of the biosorbent for Cr(VI). The biosorption capacity of biosorbent increased with increasing the temperature. The highest value of qmax obtained at 60˚C is 8.4603 mg·g–1. It appears to be the highest in comparison with the uptake obtained at the other temperatures (Table 3). The value of RL calculated from Equation (19) is presented in Table 3. RL is a positive number whose magnitude determines the feasibility of the biosorption process. As the RL values lie between 0 and 1, the biosorption process is favorable [2,13]. Further, the RL values for this study at all temperatures studied are between 0.5145 and 0.3311; therefore, the adsorption is spontaneous.
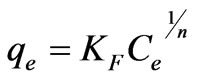
Freundlich isotherm is used for modeling the adsorption on heterogeneous systems. The Freundlich isotherm model can be explained as follows [21]:
 (20)
(20)
 (21)
(21)
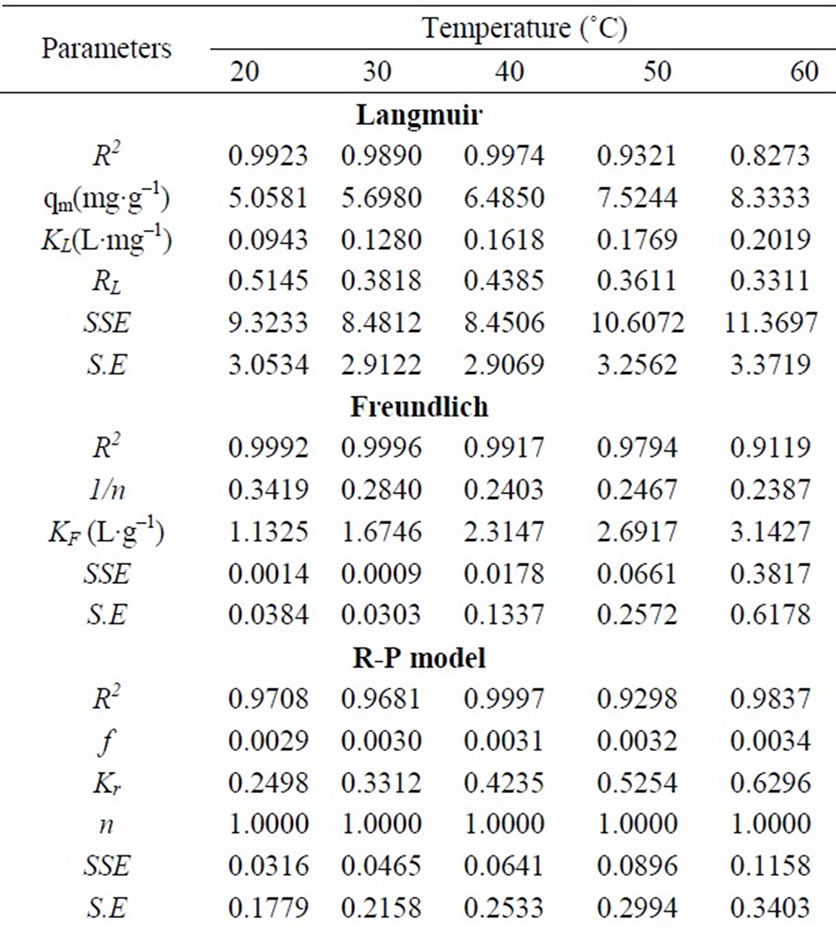
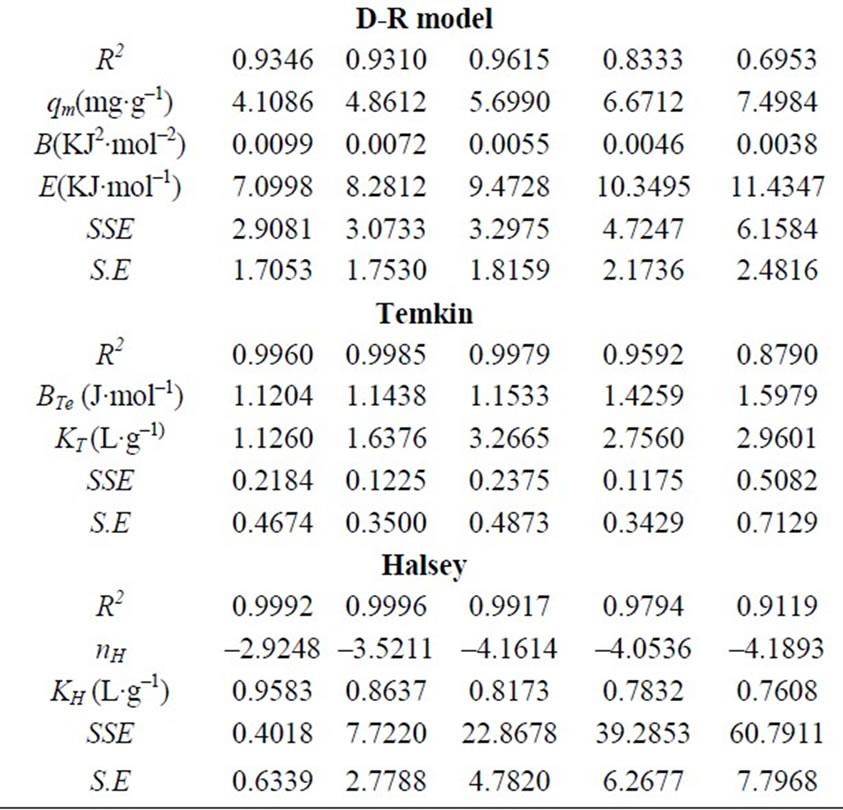
Table 3. Langmuir, Freundlich, R-P, D-R, Temkin and Halsey model constants.
where qe is the amount of Cr(VI) adsorbed at equilibrium (mg·g–1); Ce is the equilibrium concentration of chromium in solution (mg·L–1); KF and 1/n are the Freundlich adsorption isotherm constants indicates the sorption capacity and sorption intensity, respectively. Equation (20) can be linearized in logarithmic form Equation (21) and the Freundlich constants can be determined. The plot of ln qe versus ln Ce for the adsorption was employed to calculate KF and n from the intercept and the slope values, respectively shown in Table 3, where KF indicates the biosorption capacity of the biosorbent and n is a measure of the deviation from linearity of the adsorption [5,22]. The n values were greater than unity, indicating that Cr(VI) ions are favorably adsorbed by fish scales. The values of KF at equilibrium varied from 1.1325 to 3.1427 (L·mg–1) and the numerical values of n lied in between 2.9248 to 4.1893 at different temperatures (20 to 60˚C). The n values were greater than unity along with better R2 values and standard error values. From these results, it is cleared that the Freundlich isotherm model was considered as the best to describe the experimental adsorption data for fish scales at various temperatures (20 to 60˚C).
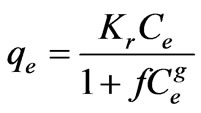
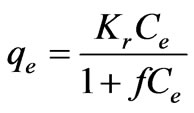
The Redlich-Peterson isotherm contains three parameters and incorporates the features of the Langmuir and the Freundlich isotherms. The Redlich-Peterson isotherm has a linear dependence on concentration in the numerator and an exponential function in the denominator. It can be described as follows [23]:
 (22)
(22)
It has three isotherm constants, namely, Kr, f, and g (0 < g < 1), which characterize the isotherm. Its limiting behavior is summarized. where g = 1; i.e. the Langmuir form results and the constants Kr and f are much greater than unity.
 (23)
(23)
i.e. the Freundlich form results; where g = 0
 (24)
(24)
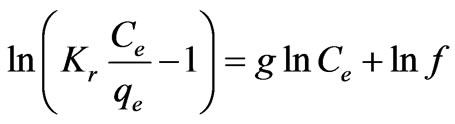
i.e. the Henry’s Law form results. Equation (23) can be converted to a linear form by taking logarithms:
 (25)
(25)
Three isotherm constants, Kr, f, and g can be evaluated from the linear plot represented by Equation (22) using a trial and error procedure, which are required to determine the isotherm parameters. To maximize the coefficient of determination, R2, obtain a series of best values of Kr by the linear regression of ln(Ce) on ln[Kr(Ce/qe) – 1] was performed using MS Excel solver. Table 3 shows that the values of Kr at equilibrium varied from 0.2498 to 0.6296 (L·mg–1), as temperature increases f values increased from 0.0029 to 0.0034 along with good R2 values, the numerical values of n was nearly 1 and standard error values were low.
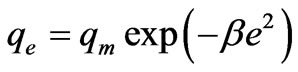
The Dubinin-Radushkevich (D-R) isotherm is more general than the Langmuir isotherm because it does not assume a homogeneous surface or constant adsorption potential. It was applied to distinguish between the physical and chemical adsorption of Cr(VI) ions. The sorption data was also subjected to Dubinin-Radushkevich model represented as follows [24]:
 (26)
(26)
The linear form of (D-R) isotherm Equation is:
 (27)
(27)
 (28)
(28)
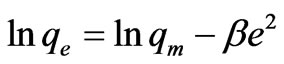
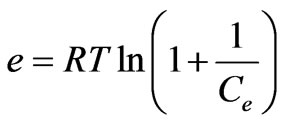
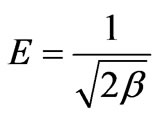
where β is a constant related to the mean free energy of adsorption per mole of the adsorbate (mol2·J–2); qe is the amount of metal ions adsorbed on per unit weight of biomass (mg·L–1); qm is the theoretical saturation capacity (mg·g–1); e is the Polanyi potential; R (J·mol–1·K–1) is the gas constant; and T (oK), the absolute temperature. By plotting ln qe versus e2 it is possible to generate the value of qm (mg·g–1) from the intercept, and the value of β from the slope [2]. The mean biosorption energy (E; kJ·mol–1) can be related to , when it is transferred to the surface of the solid from infinity in the solution and the mean biosorption energy (E; kJ·mol–1) can be calculated using the following relationship:
 (29)
(29)
The mean free energy E (kJ·mol–1) of adsorption was connected with Dubinin-Radushkevich (D-R) adsorption isotherm and calculated from Equation (29). This parameter gives information about physical or chemical ion exchange adsorption mechanisms. The magnitude of E < 8 kJ·mol–1 indicates that the adsorption process is of physical nature and for the values of E between, 8 and 16 kJ·mol–1, the adsorption process follows chemical ion-exchange mechanism [1,6,8]. Table 3 shows R2 values were low, standard error values were high, when the temperature increases from 20 to 60˚C, qm values were increased from 4.1086 to 7.4984 mg·g–1 and the numerical value of adsorption of the mean free energies increased from 7.0998 to 11.4347 kJ·mol–1, which may correspond to a chemical ion-exchange mechanism.
Temkin isotherm is based on the assumption that the heat of adsorption would decrease linearly with the increase of coverage of adsorbent and the model is used to evaluate the adsorption potentials of the adsorbent for adsorbates. Temkin and Pyzhev (1940) considered the effects of indirect adsorbate adsorbent interactions on adsorption isotherms. The heat of adsorption of all the molecules in the layer would decrease linearly with coverage due to adsorbate/adsorbent interactions [25]. The sorption data was subjected to Temkin model represented as follows:
 (30)
(30)
The linear form of Temkin isotherm Equation is:
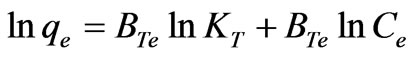 (31)
(31)
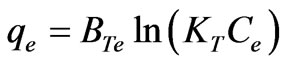
where qe is the amount of Cr(VI) adsorbed at equilibrium (mg·g–1); Ce is the equilibrium concentration of chromium in solution (mg·L–1); BTe is constant in Temkin adsorption isotherm (J·mol–1); KT is Temkin isotherm constant. The coefficient of determination (R2) and standard error values for Temkin isotherm model were reported in Table 3. The R2 values were good, standard error values were low, KT values lied between 1.1260 - 2.9601 (L·mg–1) and BTe values 1.1204 - 1.5979 (J·mol–1) with increasing temperature (20 to 60˚C).
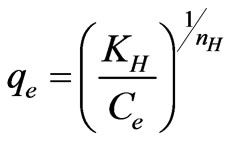
Biosorption data was subjected to Halsey model given as follows [26]:
 (32)
(32)
where qe is the amount of Cr(VI) adsorbed at equilibrium (mg·g–1); Ce is the equilibrium concentration of chromium in solution (mg·L–1); KH and nH is Halsey isotherm constants. Table 3 shows that from the intercept of the plots, the KH values were found to be 0.9583 to 0.7608 (L·g–1) at different temperatures (20 to 60˚C), R2 values were good and standard error values were high. The results from isotherm analysis suggested that the Freundlich model provided the best correlation to describe the adsorption of Cr(VI) onto the scales of fish at various temperatures.
3.5. Biosorption Thermodynamics
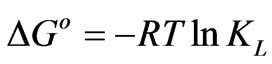
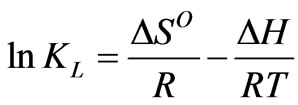
To describe thermodynamic behavior of the biosorption of Cr(VI) onto fish scales, thermodynamic parameters including the change in free energy (∆Go), enthalpy (∆Ho) and entropy (∆So) were calculated as per the following equations:
 (33)
(33)
 (34)
(34)
where R is the universal gas constant (8.314 Jmol–1·K–1), T is the temperature (oK) and KL is the Langmuir constant (L·mg–1).
The values of ∆Ho and ∆So were determined from slope and intercept of the plot of ln KL vs 1/T as shown in Figure 6 and are reported in Table 4. The negative values of ∆Go at different temperature studied, are due to the fact that the biosorption of Cr(VI) is spontaneous in nature [1,6,27,28]. The increase in the magnitude of ∆Go with increase in temperature showed an increase in the feasibility of biosorption at higher temperatures. The positive value of ∆Ho suggested the endothermic nature of the biosorption process. This was also supported by the increase in uptake capacity of Cr(VI) with increase in temperature [4,5,7]. The magnitude of ∆Ho gives an indication on the type of biosorption, which can be either physical or chemical. If the heat of biosorption is between 2.1 - 20.9 kJ·mol–1, then the process is physical
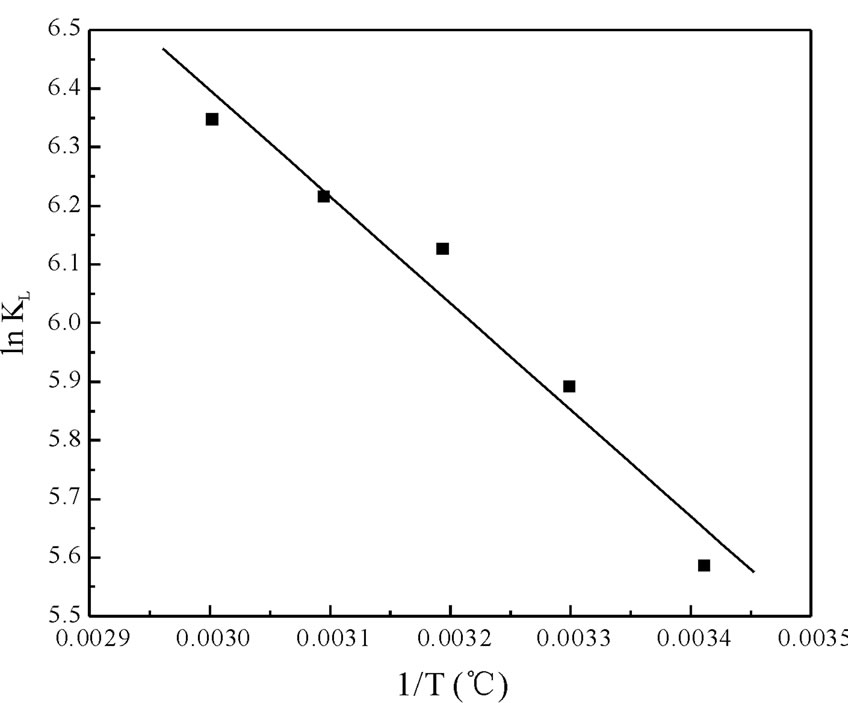
Figure 6. Plot of ln KL vs 1/T for the estimation of thermodynamic parameters for biosorption of Cr(VI) onto Fish scales.
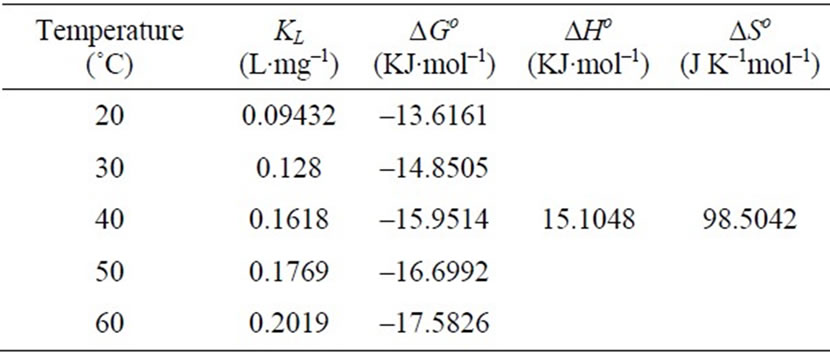
Table 4. Thermodynamic parameters for biosorption of Cr(VI) on Fish scales.
and if is between 20.9 - 418.4 kJ mol–1, then the process is chemical. For the present study, the value of ∆Ho is 15.1048 KJ·mol–1, which indicate that the adsorption followed the chemical process. The values of E calculated from the D-R isotherm Equation also confirm this. The positive value of ∆So suggested the increased randomness at the solid/solution interface during the biosorption process and also reflects the affinity of fish scales for Cr(VI) [8,12,13].
4. Conclusions
Fish scales were used as the biosorbent to remove Cr(VI) from aqueous solutions at various temperatures. The results showed that the adsorption capacity increases with increasing temperature. Various kinetic models were tested to analyze the mechanism of biosorption and it was found that pseudo-first-order kinetic model agreed very well with the dynamic behavior for the biosorption of Cr(VI) onto fish scales. The Langmuir, Freundlich and D-R, Temkin, Halsey and R-P isotherm models were used for the mathematical description of the adsorption of Cr(VI) ions onto fish scales at various temperatures and the results suggested that the biosorption equilibrium data fitted well to the Freundlich model. Thermodynamic constants were also evaluated using equilibrium constants changing with temperature. The negative value of ∆Go indicated the spontaneity and it confirm a favorable adsorption of Cr(VI) onto fish scales. The positive values of ∆Ho and ∆So showed the endothermic nature and irreversibility of Cr(VI) biosorption, respectively. This study has revealed that fish scales can be efficiently used to remove Cr(VI) ions from aqueous solutions.
REFERENCES
- A. Sari and M. Tuzen, “Biosorption of Total Chromium from Aqueous Solution by Red Algae (Ceramium Virgatum): Equilibrium, Kinetic and Thermodynamic Studies,” Journal of Hazardous Materials, Vol. 160, No. 2-3, 2008, pp. 349-355. doi:10.1016/j.jhazmat.2008.03.005
- M. Jain, V. K. Garg and K. Kadirvelu, “Chromium(VI) Removal from Aqueous System Using Helianthus Annuus (sunflower) Stem Waste,” Journal of Hazardous Materials, Vol. 162, No. 1, 2009, pp. 365-372. doi:10.1016/j.jhazmat.2008.05.048
- H. Ucun, K. Y. Bayhan, Y. Kaya, A. Cakici and F. O. Algur, “Biosorption of Chromium(VI) from Aqueous Solution by Cone Biomass of Pinus Sylvestris,” Bioresource Technology, Vol. 85, No. 2, 2002, pp. 155-158. doi:10.1016/S0960-8524(02)00086-X
- E. Malkoc and Y. Nuhoglu, “Potential of Tea Factory Waste for Chromium(VI) Removal from Aqueous Solutions: Thermodynamic and Kinetic Studies,” Separation and Purification Technology, Vol. 54, No. 3, 2007, pp. 291-298. doi:10.1016/j.seppur.2006.09.017
- X. S. Wang, Z. Z. Li and R. T. Sheng, “Removal of Chromium (VI) from Aqueous Solution Using Walnut Hull,” The Journal of Environmental Management, Vol. 90, No. 2, 2009, pp. 721-729. doi:10.1016/j.jenvman.2008.01.011
- Özcan, S. Tunali, T. Akar and I. Kiran, “Determination of the Equilibrium, Kinetic and Thermodynamic Parameters of Adsorption of Copper (II) Ions onto Seeds of Capsicum Annuum,” Journal of Hazardous Materials, Vol. 124, 2005, pp. 200-208.
- N. Ertugay and Y. K. Bayhan, “Biosorption of Cr (VI) from Aqueous Solutions by Biomass of Agaricus Bisporus,” Journal of Hazardous Materials, Vol. 154, No. 1-3, 2008, pp. 432-439. doi:10.1016/j.jhazmat.2007.10.070
- L. Deng, Y. Zhang, J. Qin, X. Wang and X. Zhu, “Biosorption of Cr(VI) from Aqueous Solutions by Nonliving Green Algae Cladophora Albida,” Minerals Engineering, Vol. 22, No. 4, 2008, pp. 372-377. doi:10.1016/j.mineng.2008.10.006
- K. Mohanty, M. Jha, B. C. Meikap and M. N. Biswas, “Biosorption of Cr(VI) from Aqueous Solutions by Eichhornia Crassipes,” Chemical Engineering Journal, Vol. 117, No. 1, 2006, pp. 71-77. doi:10.1016/j.cej.2005.11.018
- R. Nadeem, T. M. Ansari and A. M. Khalid, “Fourier Transform Infrared Spectroscopic Characterization and Optimization of Pb(II) Biosorption by Fish (Labeo rohita) Scales,” Journal of Hazardous Materials, Vol. 156, No. 1-3, 2008, pp. 64-73. doi:10.1016/j.jhazmat.2007.11.124
- M. Venkata subbaiah, S. Kalyani, G. Sankara reddy, M. V. Boddu and A. Krishnaiah, “Biosorption of Cr(VI) from Aqueous Solutions Using Trametes Versicolor Polyporus Fungi,” Chemical Engineering Journal, Vol. 5, 2008, pp. 499-510.
- Y. Khambhaty, K. Mody, S. Basha and B. Jha, “Kinetics, Equilibrium and Thermodynamic Studies on Biosorption of Hexavalent Chromium by Dead Fungal Biomass of Marine Aspergillus Niger,” Chemical Engineering Journal, Vol. 145, No. 3, 2009, pp. 489-495. doi:10.1016/j.cej.2008.05.002
- S. Chakravarty, S. Pimple, S. Hema., T. Chaturvedi, S. Singh and K. K. Gupta, “Removal of Copper from Aqueous Solution Using Newspaper Pulp as an Adsorbent,” Journal of Hazardous Materials, Vol. 159, No. 2-3, 2008, pp. 396-403. doi:10.1016/j.jhazmat.2008.02.030
- Y. S. Ho and G. McKay, “Sorption of Dyes and Copper ions onto Biosorbents,” Process Biochemistry, Vol. 38, No. 7, 2003, pp. 1047-1061. doi:10.1016/S0032-9592(02)00239-X
- S. K. Lagergren, “About the Theory of So Called Adsorption of Soluble Substances,” Kungliga Svenska Vetenskapsakademens Handlinger, Vol. 24, 1898, pp. 1-39.
- Y. S. Ho, “Second-order Kinetic Model for the Sorption Processes,” Process Biochemistry, Vol. 34, No. 5, 1999, pp. 451-465. doi:10.1016/S0032-9592(98)00112-5
- Y. S. Ho, “Second-order Kinetic Model for the Sorption of Cadmium onto Tree Fern: A Comparison of Linear and Non-linear Methods,” Water Research, Vol. 40, No. 1, 2006, pp. 119-125. doi:10.1016/j.watres.2005.10.040
- W. J. Weber and J. C. Morris, “Kinetics of Adsorption on Carbon from Solution,” Journal of Sanitary Enneering, Vol. 89, 1963, pp. 31-60.
- Langmuir, “The Constitution and Fundamental Properties of Solids and Liquids,” Journal of the American Chemical Society, Vol. 38, 1916, pp. 2221-2295. doi:10.1021/ja02268a002
- Langmuir, “The Adsorption of Gases on Plane Surfaces of Glass, Mica and Platinum,” Journal of the American Chemical Society, Vol. 40, No. 9, 1918, pp. 1361-1403. doi:10.1021/ja02242a004
- H. M. F. Freundlich, “Uber Die Adsorption in Lasugen,” Journal of Physical Chemistry, Vol. 57, 1906, pp. 385- 470.
- G. McKay, H .S. Blair and J. K. Gardener, “Adsorption of Dyes on Chitin, Equilibrium Studies,” Journal of Applied Polymer Science, Vol. 27, No. 8, 1982, pp. 3043-3057.doi:10.1002/app.1982.070270827
- O. Redlich and D. L. Peterson, “A Useful Adsorption Isotherm,” Journal of Physical Chemistry, Vol. 63, No. 6, 1959, pp. 1024-1028. doi:10.1021/j150576a611
- J. P. Hobson, “Physical Adsorption Isotherms Extending from Ultrahigh Vacuum to Vapor Pressure,” Journal of Physical Chemistry, Vol. 73, No. 8, 1969, pp. 2720-2727. doi:10.1021/j100842a045
- M. J. Temkin and V. Pyzhev, “Recent Modifications to Langmuir Isotherms,” Acta Physical Chemistry, Vol. 12, 1940, pp. 217-222.
- G. Halsey, “Physical Adsorption on Non-uniform Surfaces,” Journal of Physical Chemistry, Vol. 16, 1948, pp. 931-937. doi:10.1063/1.1746689
- Y. S. Ho and A. E. Ofomaja, “Biosorption Thermodynamics of Cadmium on Coconut Copra Meal as Biosorbent,” Biochemical Engineering Journal, Vol. 30, No. 2, 2006, pp. 117-123. doi:10.1016/j.bej.2006.02.012
- Y. Liu and Y. Juan, “Biosorption Isotherms, Kinetics and Thermodynamics,” Separation and Purification Technology, Vol. 61, No. 3, 2008, pp. 229-242. doi:10.1016/j.seppur.2007.10.002