Journal of Water Resource and Protection
Vol.2 No.5(2010), Article ID:1801,9 pages DOI:10.4236/jwarp.2010.25054
Support of Space Techniques for Groundwater Exploration in Lebanon
National Council for Scientific Research-Remote Sensing Center, Beirut, Lebanon
E-mail: geoamin@cnrs.edu.lb
Received December 1, 2009; revised January 26, 2010; accepted February 10, 2010
Keywords: water shortage, aquifer, satellite image, Lebanon
ABSTRACT
Lebanon is known by the availability in water resources whether on surface or among the existing rock formations. However, the status-quo does not reflect this availability due to a number of physical factors, as well as the mismanagement of these resources. Hence, the per capita has been reduced by about 50% in the last three decades. There are sixteen exposed rock formations in Lebanon, two of them are major aquifers and they are characterized by highly fractured and karstified carbonate rocks. Recently, challenges for groundwater in Lebanon have been developed. These are the: overexploitation, climate change and the acute geologic setting, which led to decline in rainfall rate, and thus exacerbated water demand. The existing challenges resulted with a number of problems in ground water resources management, namely: quality deterioration, impact on springs and groundwater behavior, loss of groundwater o the sea, saltwater intrusion and exacerbated by the lack of data and mismanagement in water sector. In this respect, new technologies can be utilized as a helpful instrument in managing groundwater resources to treat the unfavorable situation. Space techniques and GIS have been recently raised in several topics on water resources management, including, mainly exploration and monitoring. They proved to be capable to extract hydrogeologic information and thus to manipulate this information in creditable approaches of analysis. This study introduced the present status on the Lebanese groundwater resources and the existing challenges and problems. Thus, it extends an application from Lebanon on the used new approaches for exploring groundwater.
1. Introduction
Water shortage has become a serious national problem in many regions worldwide and it is in continues exacerbation. Thus, demand for water has increased with population growth and the change in climatic conditions. This is well pronounced in arid and semiarid regions such as the Middle East, which is the utmost influenced region by water shortage and Lebanon is a typical example.
Lebanon, with 10400 km2 surface area, is located between the following geographic coordinates: 33°01′07′′; 34°39′40′′ and 35°07′30′′; 36°37′15′′ (Figure 1). It is described as the “water tower”; however, it is still suffering of water deficit, and demand for water has become crucial. There are tremendous surface and subsurface water resources of the Lebanese territory where rainfall rate ranges between 800 to 1500 mm, snow covers around 2000 km2, more than 2000 major springs and 15 flow rivers exist, as well as a large number of subsurface water-bearing conduits and aquiferous rock formations occur. Therefore, the present naturally available water in Lebanon can provide enough water to the present population.
Unfortunately, there are many conflicting physical and anthropogenic factors. Hence, many regions in Lebanon are witnessing severe water scarcity and the available water supply is not sufficient to cope even with major domestic needs. Also, water contamination is a common criterion and has been added as a negative impact on several resources whether on surface or subsurface. In the light of this status, it is not exaggeration to say that Lebanon is a country under water stress and all obtained analyses, trends and scenarios indicted unfavorable incoming events, notably for the future needs of water.
Other than surface water resources, groundwater in Lebanon is widely exploited and the two major aquifers are subjected to intensive water abstraction and tremendous aspects of contamination. This is well observed from
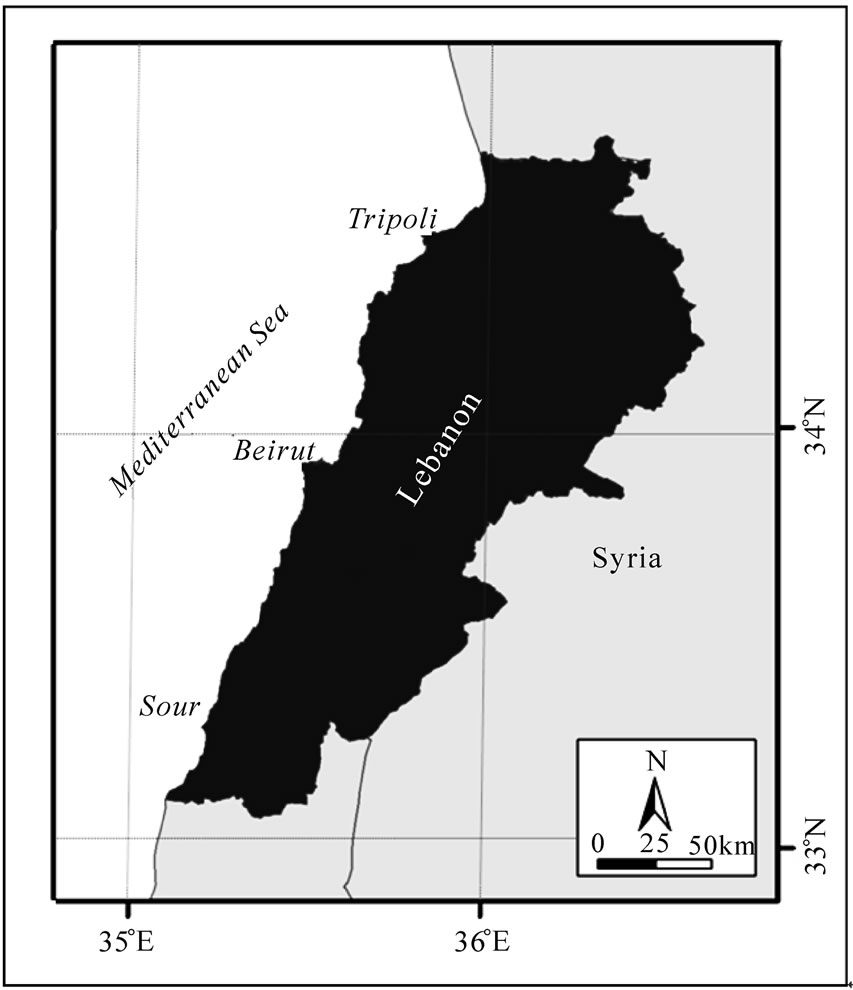
Figure 1. location map of Lebanon.
the large number of drilled wells. For example in the capital Beirut, the distribution density of water wells ranges between 400 and 500 wells/km2 [1], and most of these wells are private owned and are chaotically located. This resulted remarkable depletion in water table and dryness of many springs as well as acute saltwater intrusions in the coastal aquifers, which became a wide phenomenon.
In the early 1960s and 1970s, a number of studies and projects were done to evaluate and exploit groundwater resources in Lebanon. Such as the project obtained by UNDP in 1962 [2], and put the major hydrgeological elements of Lebanon. Additionally, several case studies were carried out then on different topics on groundwater resources. However, and after three decades this needs updating and new analysis to evaluate groundwater regime, which has been totally changed in terms of quantity and quality.
Unfortunately, recent studies on groundwater resources in Lebanon are rare and sometimes lacking to scientific creditability, and only theoretical descriptions are known. Yet, conventional approaches are often used to explore groundwater, but the success in locating groundwater storage is a matter of chance. In addition, monitoring groundwater flow regime and storage almost missed, notably groundwater discharge to the sea along fractures and karstic conduits. Therefore, it can be said that: the present hydrogeologic regime of Lebanon needs more investigation.
This study aims to diagnose groundwater of Lebanon, and focus on the major existing challenges and problems. Consequently, it will describe the applied new techniques, with a special emphasis on space tools to study groundwater regime, including storage and flow.
2. Groundwater in Lebanon
The exposed stratigraphic succession of Lebanon, starting from Middle Jurassic, exhibits sedimentation in the marine environment until the Middle Eocene. There are sixteen geologic formations where Carbonate rocks building up the largest part of the stratigraphic column (~65%) and separated by continental sands and clastics deposits at the base of the Cretaceous (Nubian facies) and some intercalated volcanics up to the Pliocene. The exposed succession totals a thickness of about 5650 m [3].
In ground water assessment, terrain characteristics must be primarily considered in order to understand groundwater behavior. However, depending only on precipitation rate for water balance assessment may create errors. This is the status quo in Lebanon, where precipitation (including rain and snow) is well pronounced and making groundwater as a renewable resource, but the hydrogeological characteristics do not properly serve in water retention.
Among the sixteen rock formations in Lebanon, six are aquiferous, and the rest are aquicludes or aquitards. Two out of the six are considered as excellent aquifers (Figure 1) and have long been tapped. They are attributed to the: Cenomanian (Cretaceous) and Kimmerdjian (Jurassic) ages. The rest four (of the six aquiferous formations) are considered as semi-aquifer and can be described as follows:
1) Callovian Dolomitic Limestone: It is relatively deep, and exposed in rare patches.
2) Neocomina Sandstone: It exists with clayey intervening and almost exposed on surface, which results large numbers of seepages.
3) Albian Dolomite: It has a cliffy exposure, which extensive vertical jointing and thus unable to store water.
4) Eocene Limestone: It often appears with marl and chalky facies.
In Lebanon, Intensive fracture systems, secondary porosity and karstification are characterizing the major aquifers. This increases the degree of permeability and porosity, which is about 50% in some regions [4].
The principal stratigraphic characteristics of the two major aquifers in Lebanon can be summarized as follows [5]:
1) Kimmeridjian: Massive, thick bedded, highly fissured, jointed and well karstified limestone and dolomitic limestone, interbedded with thin marly limestone, as well as frequent horizons of chert nodules.
2) Cenomanian: Massive to thin bedded, highly fractured, jointed, and karstified dolomitic limestone and limestone with some thin beds of marly limestone.
These two aquifers have good hydrogeologic characteristics, and the groundwater exploitation is dominant from the Cenomanian one. This is due to the wide exposure of this aquifer (i.e. 4190 km2) as well as its relative shallow water table (i.e. 300-350 m).
Considering the areal extent, total rock succession, depth to water and porosity, therefore the volume of groundwater can be assessed. For example, the volume of groundwater in the largest aquifer of Lebanon (i.e. Cenomanian) is estimated at 687 million m3. Also, the Eocene rock succession, which is considered as a semi-aquifer, has a considerable amount of groundwater storage as shown in Figure 2, and estimated as 150 million m3 and much more than that in the excellent aquifer of the Kimmerdjian succession. However, exploitation from the later (Eocene) is almost negligible due to the depth-to-water as well as due to the quality in some cases.
However, water resources in Lebanon are being subjected to several challenges that result unfavorable impact on groundwater sector. These are anthropogenic challenges:
1) Over-exploitation due to population size increase, which is estimated at 2%.
2) Change in climatic conditions, and this is viewed from a decrease in rainfall by (~150-200 mm) and snow coverage (from 2500 to 1950 km) in the last four three decades, as well as increase in the average temperature about 1.5 to 2.0℃ [6].
3) The geologic setting of Lebanon is not favorable for water retention. This is represented mainly by the steep sloping lands and dense fracture systems, including faults and fissures.
4) Quality deterioration is another problem in groundwater in Lebanon. This includes chemical and microbiological contamination. In addition, the problem of saltwater intrusion has been added lately, and thus the salinity reached 226 mlg/L in the mountainous regions and 611 mlg/L in Beirut [2].
5) Groundwater flow to the sea is one of the most known challenges along the Lebanese coastal aquifers. It was found that the majority of discharge implies flow of
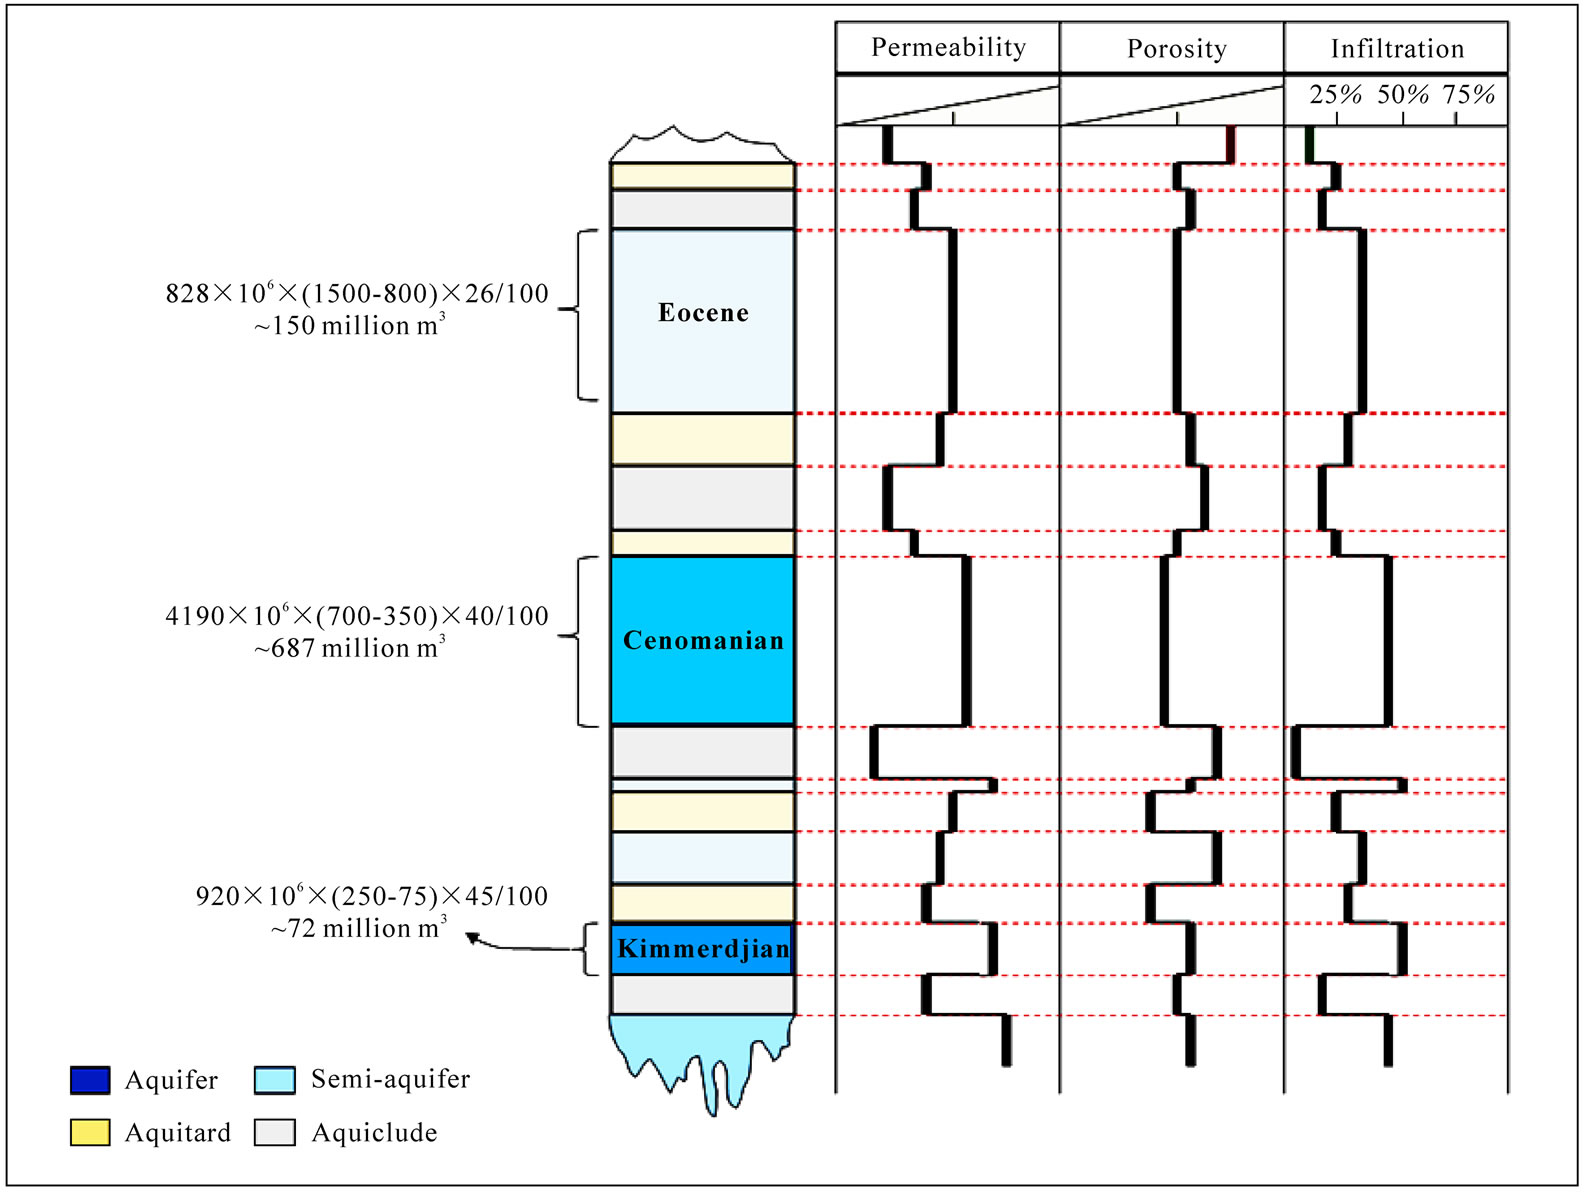
Figure 2. Schematic presentation of the hydrostratigraphic succession of Lebanon.
groundwater along faults, karstic galleries and titling rock beds of the coastal aquifers.
3. Space Techniques in Groundwater Assessment
There are many advanced techniques, which have been recently occurred, but not all of these techniques are accessible to use because they either expensive or due to the lack of experts who can use these techniques. In addition, many of these techniques serve in-situ investigating, thus detailed fieldwork is needed to cover a large area. However, remote sensing (space-based) techniques fill this gap, and they can play a role in groundwater assessment, since they are cheap, time consuming and can cover large areas.
3.1. Remote Sensing and GIS
Generally, remote sensing is considered as a set of techniques making possible the acquisition of information from space in a comprehensive vision. It is usual to confine discussion of remote sensing to those techniques that involve the recording information by satellite or airborne sensors.
Usually, remotely sensed data is used to provide information on terrain surface, suspicious signatures, as well as in monitoring approaches. However, Geographic Information System (GIS) is a supporting tool to remote sensing. It has the capability to manipulate and store data in digital forms.
It worth mentioning that remote sensing application must be accompanied with field verification to confirm the reliability of extracted data from satellite images or aerial photos. Moreover, field verification is often carried out to recognize remarkable feature, which cannot be observed directly on Earth’s surface.
Normally used in remote sensing applications, satellite images are processed by using special software types, most commonly ERDAS Imagine, ENVI and PCI, which have a miscellany of digital and optical advantages, such as band combination, directional filtering, contrast, sharpness, etc. In addition, optical characteristics of images, such as: spatial resolution (capability to distinguish objects on Earth’s surface), number of bands, including, for example, the visual and thermal bands, as well as revisit time (date of acquiring images) are primarily considered. The most common used satellite images are IKONOS, Spot, Aster, Landsat 7 and Modis, with spatial resolution of 1 m, 5 m, 15 m, 30 m and 250 m; respectively.
3.2. Major Elements Identification
Data acquired from space techniques has been recently utilized in several applications on water resources assessment. In spite of groundwater in rocks is invisible resource, yet studying its flow regime and storage by remote sensing has proved to be effective. Therefore, identification of surficial signatures on Earth’s surface can be used to indicate lithological and structural elements that control groundwater behavior. In other words, studying groundwater by remote sensing is an indirect approach of analysis.
In hydrogeological assessment using space techniques, there are several elements of identification. The major ones are:
1) Texture: On satellite images or aerial photos, texture refers to the arrangement and frequency of tonal variation in particular area or shape. Likewise the color, it is a function of spatial uniformity of scene target. Most of texture models are based on grey-level image analysis, and often classified as: fine, medium, coarse, rough, smooth, stippled or mottled (Figure 3).
Therefore, texture in remotely sensed data can identify rock type, hardness and surface roughness. This in turn helps discriminating different lithological charcterstics and thus proposes their hydrologic properties.
2) Linear Features: Aspects of linear features that appear on satellite images or aerial photos are usually detected and described as “Lineaments”. In geological studies, lineaments are those linear signatures, which can be obviously traced from space and are attributed to geological structures (often breaks in rocks)/or and lithologic contacts. However, they often represent fault alignments or local fractures, which are both useful in hydrogeological assessment in order to recognize groundwater flow regime and storage. Figure 4 shows an example of lineaments identification from satellite images.
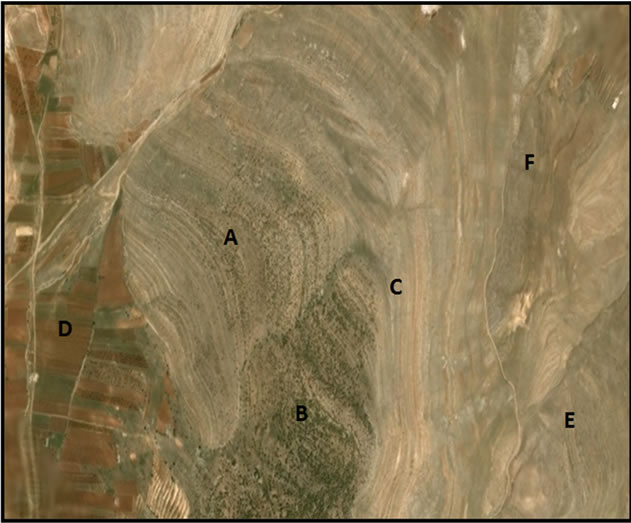
Figure 3. Satellite image showing different textures. For example, (B) represents rough texture and (D) represents smooth texture.
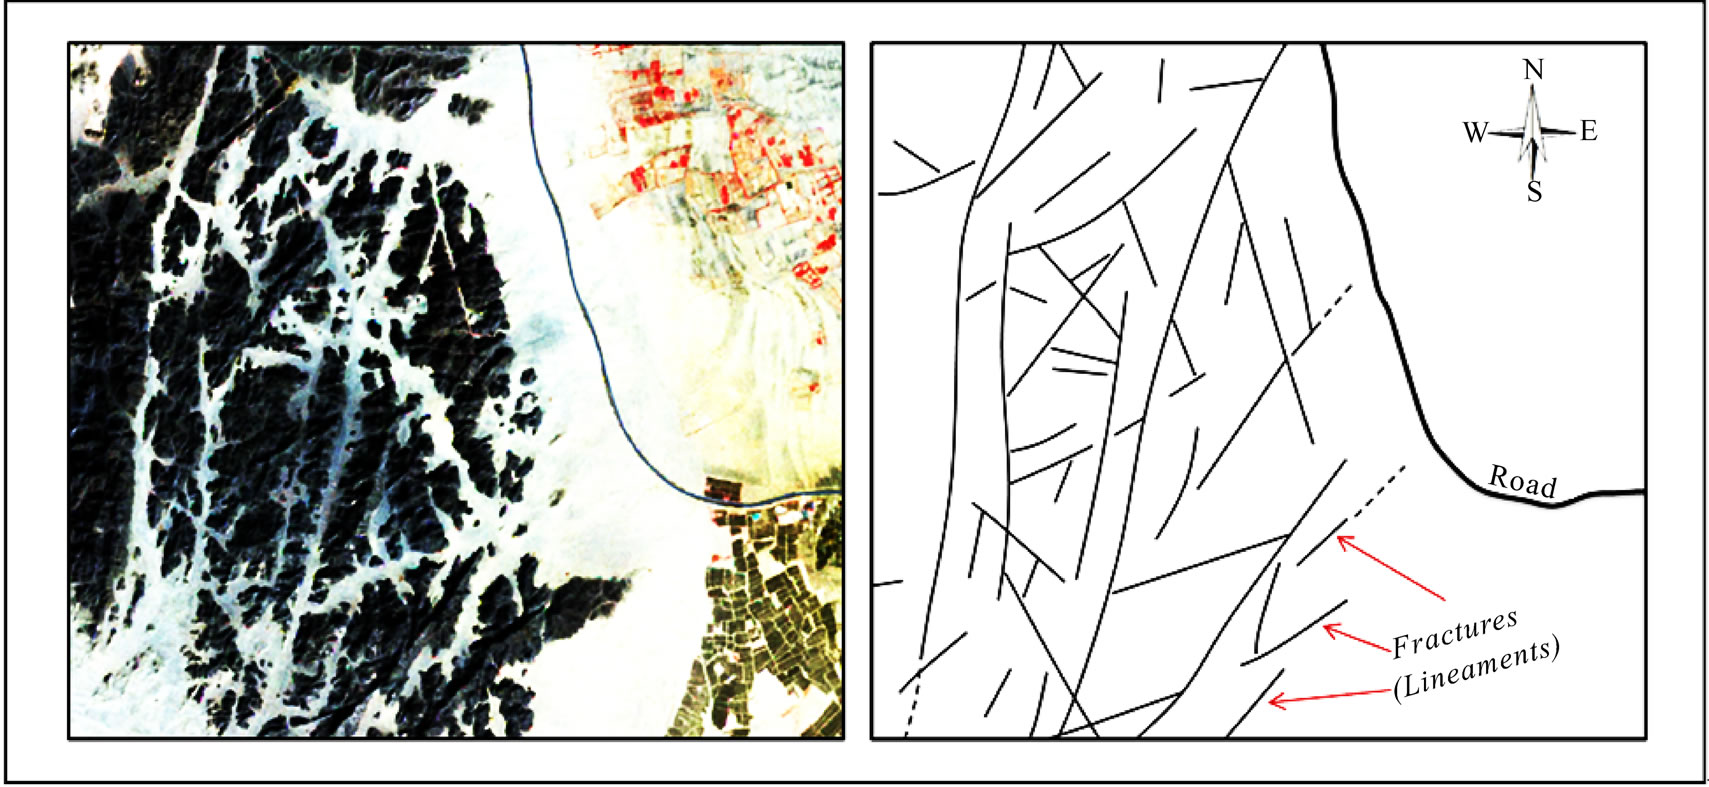
Figure 4. Example showing the extraction of fractures from satellite images.
3) Thermal Differentiation: thermal differentiation in rocks can be detected from digital satellite images, since these images composing thermal bands. In this regard, thermal differentiation, for example, can be applied in using band 6 (60 m resolution) in Landsat 7 ETM+ and bands 10-14 (90 m resolution) in ASTER images.
Normally, difference in rock temperature is considered as a significant element in rock characterization. Thus, it is an important indicator for water retention and moisture content in different lithologies. Difference in temperature in rocks also helps identifying burned fracture systems, which supposed to result wet horizons. Additionally, temperature difference can be used to identify freshwater plumes flow into the seawater.
4. Space Techniques for Exploring Groundwater
Several studies on groundwater in Lebanon have been raised since the early sixties. All these studies depended on site investigation/or geologic maps, thus followed the conventional approaches of groundwater assessment. However, the hydrogeologic regime has been obviously changed due to the previously mentioned challenges. This includes, in a broad sense, the storage and flow regime.
Recently, space techniques have became a great deal in hydrological and hydrogeological studies in many regions worldwide. Lebanon is one region where space techniques have been recently involved in several disciplines, with a special focuses on water resources management. These applications differ according to the available tools and used approaches, as well as they are dependent on the characteristics of the region to be studied. This study introduces an empirical approach for groundwater examples explorations using space tools in Lebanon.
The major concept implies tracing water journey from terrain (as surface water) until trapped and stored into subsurface media as groundwater. It includes: 1) Surface water recharge; 2) Groundwater flow and 3) Water storage, as shown in Figure 5. In this case, space techniques can play a role in the identification of the controlling factors, especially those appear/or have delineations on terrain surface (Table 1).
4.1. Determining Surface Water Recharge Zones
Recharge property is attributed to behavior of terrain surfaces to allow surface water percolating downward through rocks and soil. Hence, surface with high recharge potential is considered as the first media to groundwater storage and flow. Therefore, factors controlling this media must be primarily determined.
In this topic, five major factors controlling recharge property were identified. These are: lithology, drainage, fractures systems, karstification and land cover/use. The hydrologic-related characteristics of these factors were adopted from satellite images. For this purpose, Landsat 7 TEM+ and Aster images were processed using ENVI. 4.3-software.
Image subsets were selected to focus on the area of concern from the entire image scene. Most analysis was performed by applying spectral features in the software. Among these applications, various steps were applied, including directional filtering, contrasting, and sharpness. In addition to the previous procedures, single-band and multiband enhancement were carried out by interrelating each group of three bands as one set. These applications
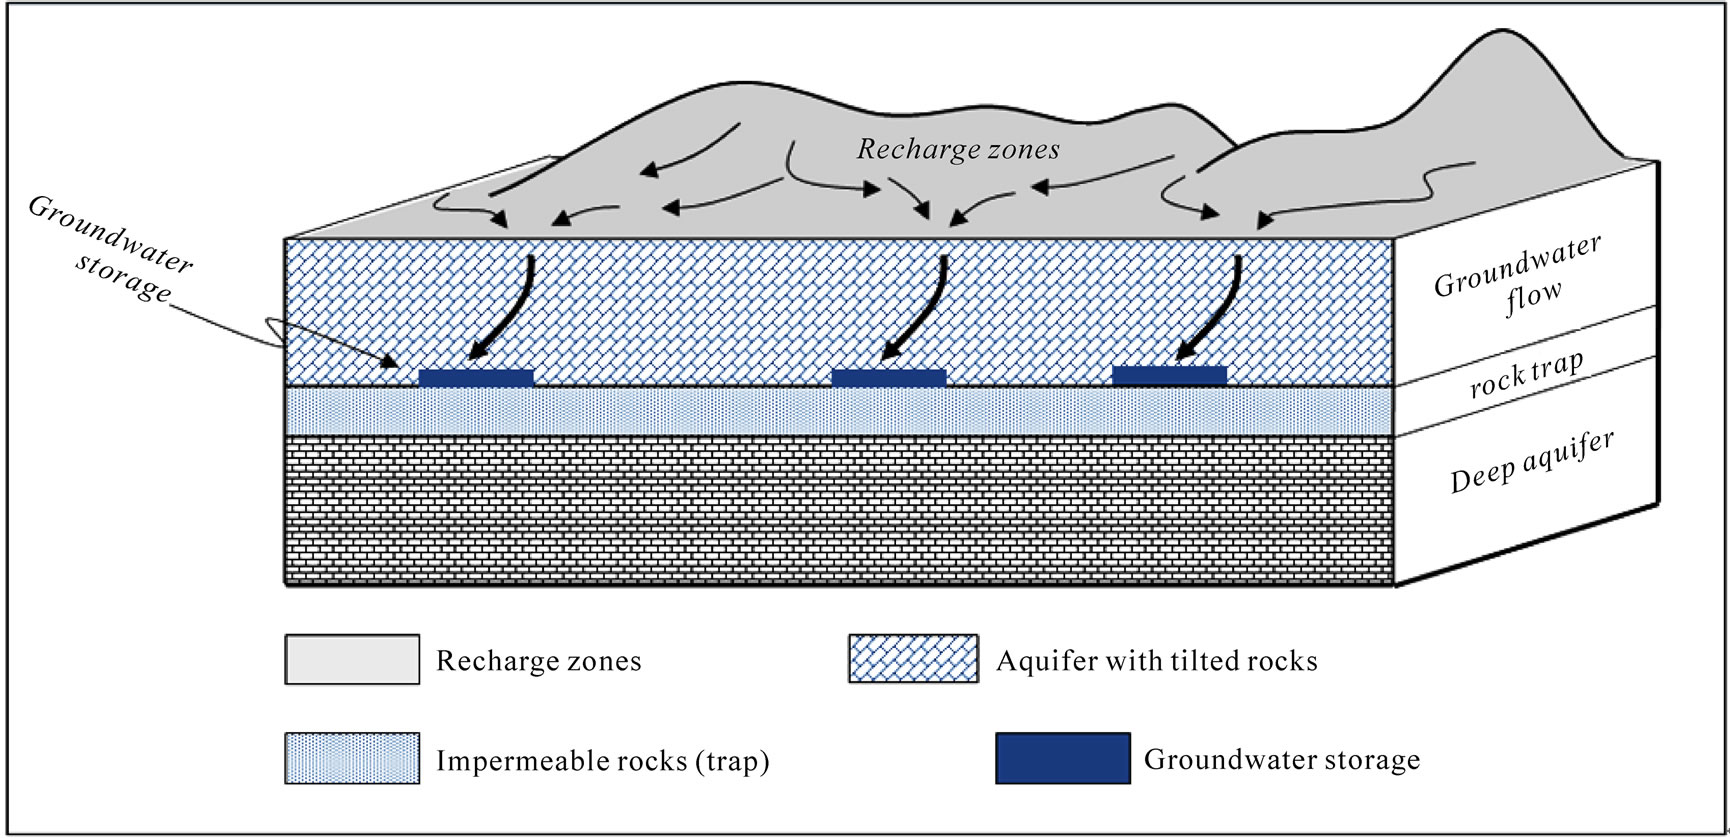
Figure 5. Schematic figure showing the major steps of water journey from surface till storage in rock stratum.
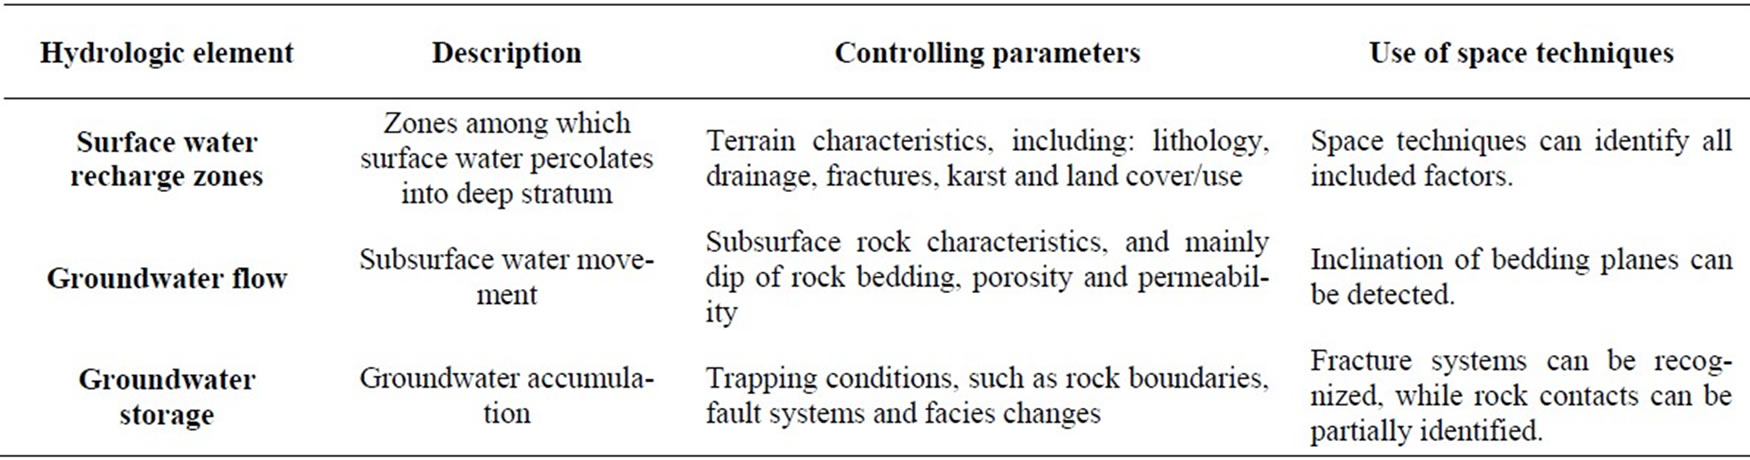
Table 1. Major hydrologic elements in groundwater journey and their identification by space techniques.
provided information to reveal differentiation in color, pattern, texture, and temperature, the so-called marine anomaly, which characterized the behavior and dimensions of marine pollution. In addition, the data from thermal band, i.e., band 6 (120 m × 120 m resolution), was used to determine differences in coastal marine waters.
Using Arc-GIS software; thus featuring the components of each factor was adopted and represented on digital spatial forms. Hence, “thematic layers” for each factor were produced. Consequently, the integration of all layers together in the GIS system was applied and each layer (i.e. factor) was given a weight of influence (Figure 6).
Results show that approximately 57% of Lebanon is a terrain with very high to high recharge potential. The most effective recharge potential zones are found in regions where hard, fractured and karstified limestone and dolomite of the Jurassic and Cenomanian rock formations exist [7].
4.2. Groundwater Flow
Identification of recharge zones in the previous section, notably those characterized by high recharge property, will be the first clue in tracing groundwater flow. Thus, consequent investigation on these zones must be carried out to recognize the behavior of water flow into deeper rock stratum. Using space techniques for this purpose is principally dependent on a number of indicators appear on terrain surface. These are: the inclination of bedding planes (i.e. dip), faults and rock formation boundaries.
These three hydrologic indicators can be identified from space tools, notably by using satellite images. The application of different digital and optical advantages on satellite images enables detecting such indicators. The same approach of image processing used in zoning surface water recharge will be used followed to delineate groundwater flow direction.
In this procedure, rock beds inclination will be relatively determined and not on the exact basis, but it can point out to the predominant direction of beds’ tilting.
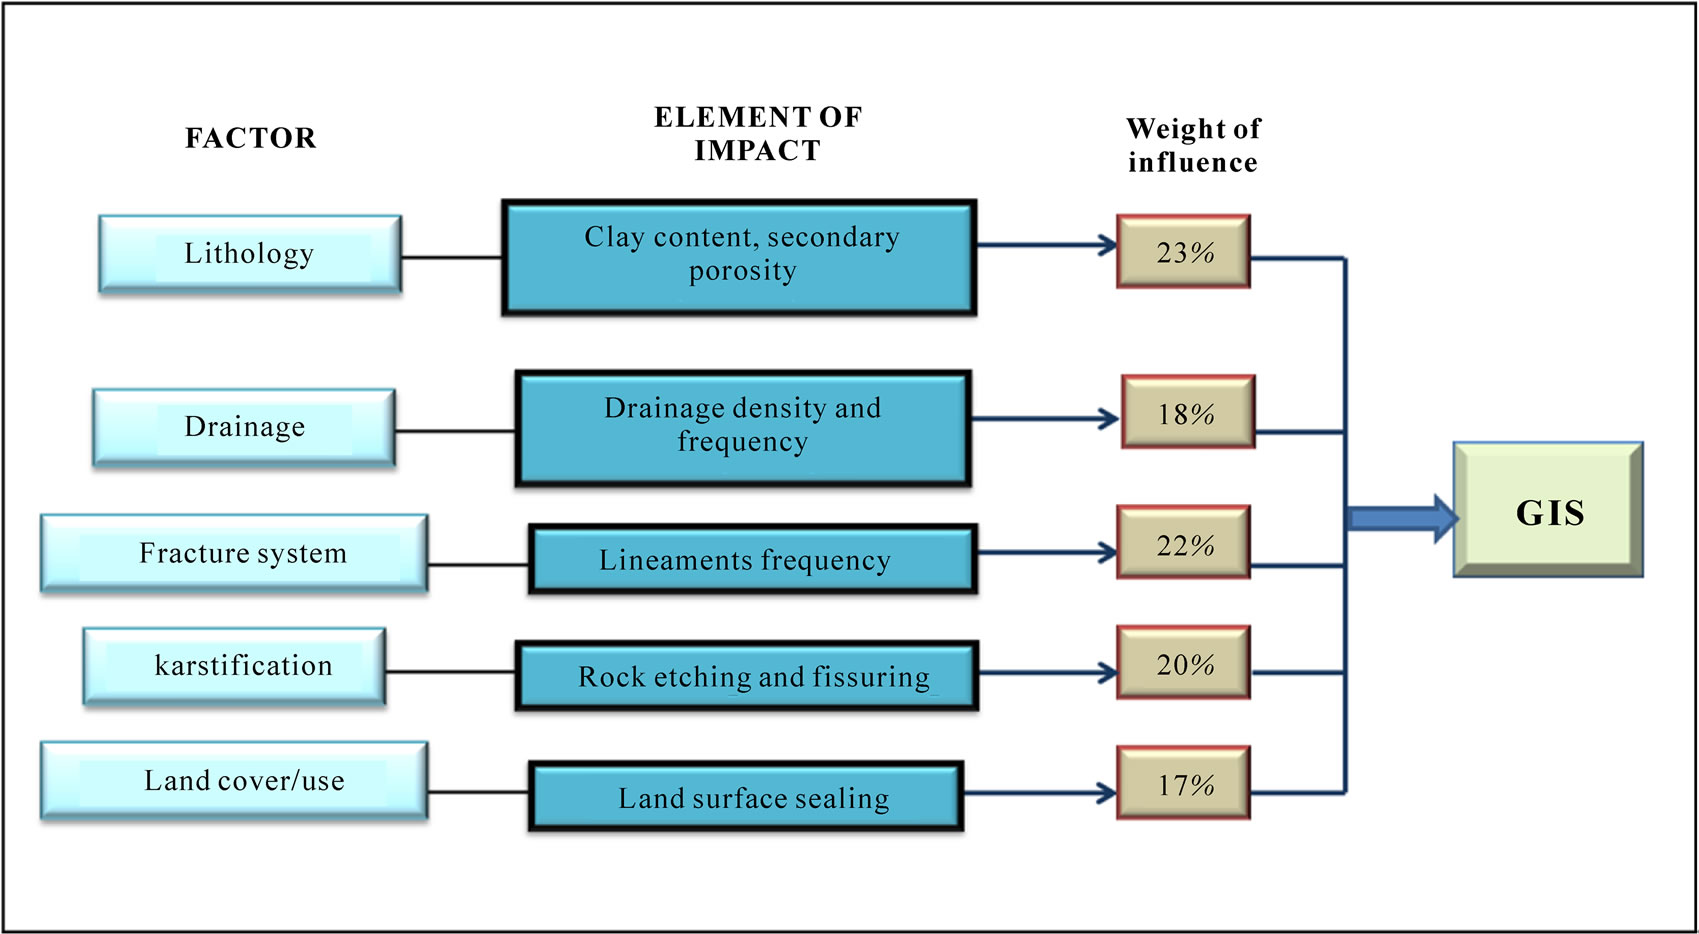
Figure 6. schematic representations of the manipulated factors in the GIS.
However, in some instances, the superimposing of Digital Elevation Model (DTM), which is derived from satellite images, on a geologic map can also help measuring the dip and strike of geologic contacts [8]. DEM Accordingly, fault alignments and lithological boundaries can be directly detected on satellite images, especially by using thermal bands, as well as the edge detection application (Example in Figure 7).
4.3. Groundwater Storage
Following up the last two phases in delineating water flow from surface to subsurface media; however, accumulation of this water is the end target. For this purpose, surface indicators for groundwater trapping were accounted. This in turn, needs analyzing different collected information from the last two phases in combination with inducing trapping factors that can be identified on terrain surface.
This was undertaken in this approach and then confirming results were achieved. Hence, for this purpose, a comparative analysis has been carried out on drilled water wells from different regions in Lebanon. Hence, 90 typical water wells drilled almost in the major aqufierous rock formations (i.e. Cenomanian and Kimmerdejian) were investigated to determine the water table depth and water yield [9]. Thus, maps showing the location of these wells were overlapped with maps of the identified fracture systems and recharge potential zones to figure out any existing relation between both. In this procedure, remote sensing and GIS were the major tools of analysis and data manipulation; notably in determining the fracture systems with respect to productive water wells.
Accordingly, the resulted numerical data was expressed graphically; therefore, a clear relationship was found between water wells productivity and their proximity to faults. Hence, a direct proportionality exists between dug wells at a distance with less than 350 m and productive well with a discharge rate exceeding 15 L/s, while those wells between 350-650 m often have productivity of around 10 L/s. In other words, more than 97% of dug wells in a distance less than 650 m to faults are productive wells with > 10 L/s. Whilst a clear decline in water productivity exist as the distance increases (Figure 8).
5. Conclusions and Discussion
Likewise, surface water resources, groundwater in Lebanon is available in sufficient amounts to cope with human demands. However, these resources are subjected to continuous exhaustion since the last few decades and now they became seriously threatened. In addition to the known challenges of the population growth and climate change; however, several negative actions have been resulted to influence water resources in Lebanon.
Groundwater sector is witnessing a sever deterioration in water storage. This is obviously reflected on: 1) the decline of springs discharge; 2) water table drawdown and 3) decrease in groundwater discharge. However, it is not exaggeration to say that groundwater resources in Lebanon are under depletion, and this is applied to sur-
 (a)
(a)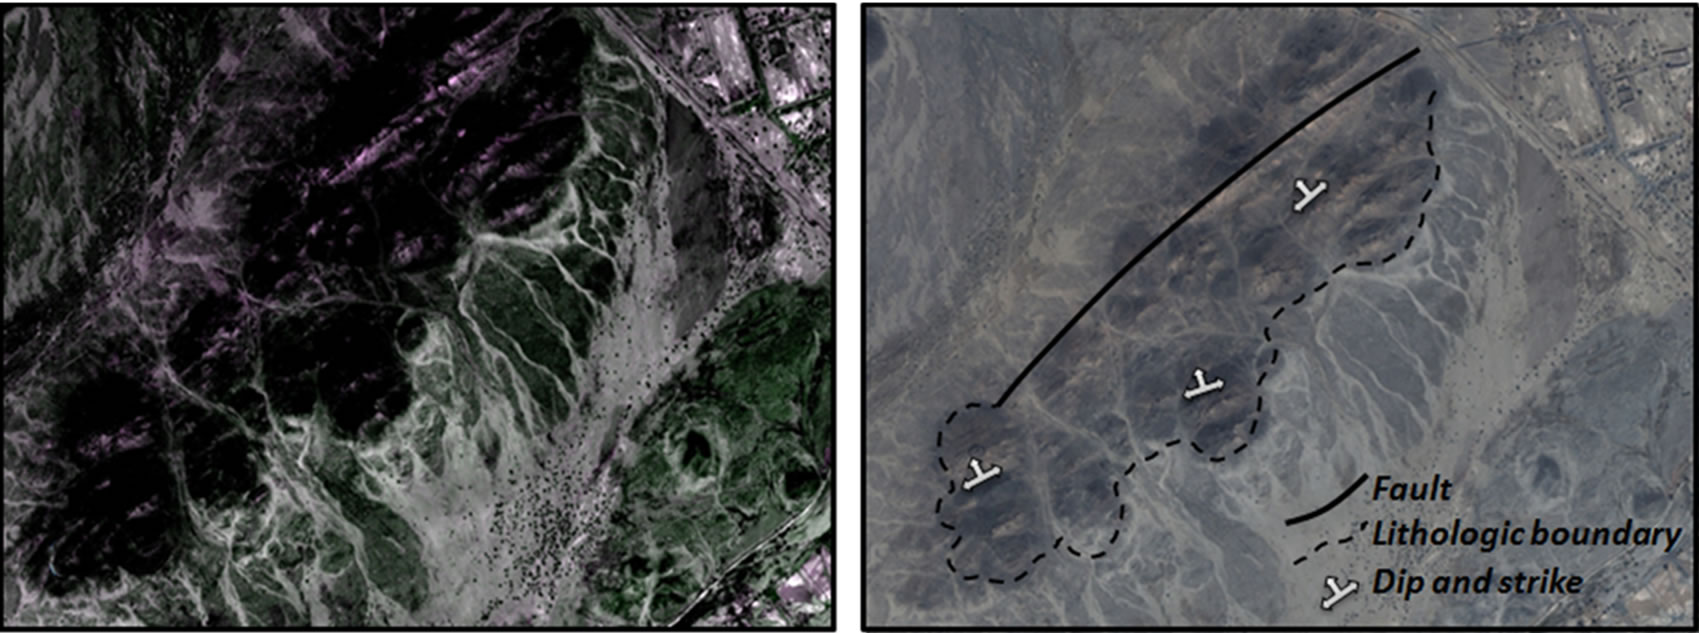 (b)
(b)
Figure 7. Example showing different observations of the same locality ((a), (b) and (c)) and the interpretation of hydrologic indicators ((d)).
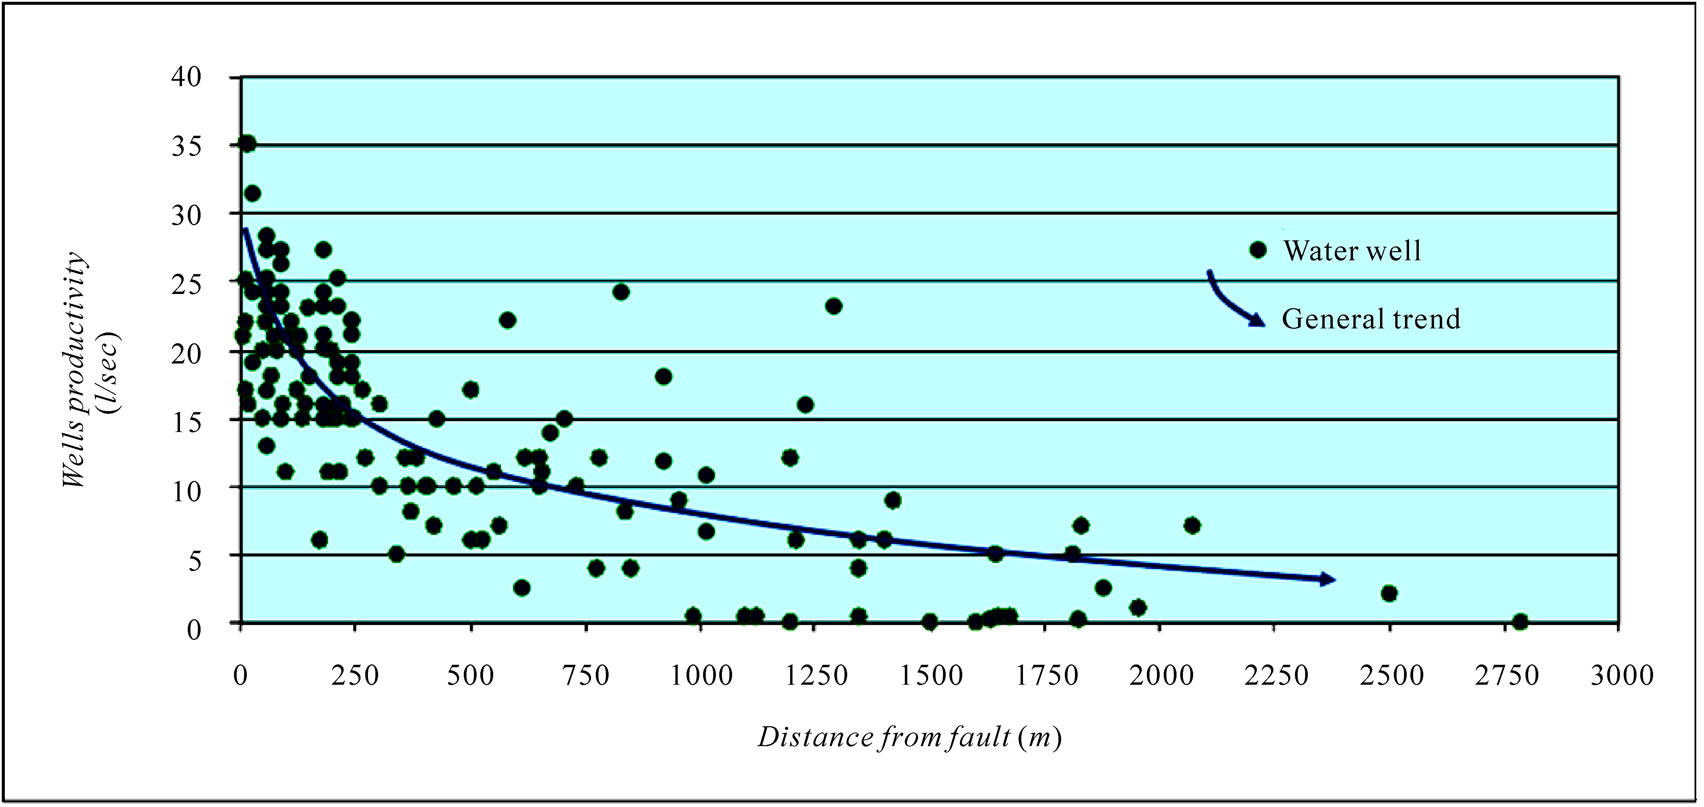
Figure 8. The relation between water wells productivity and their proximity to faults.
face resources. This unfavorable situation results water supply shortage in most of the Lebanese region. For this reason, exploring groundwater became dominant.
Nevertheless, not all drilled wells for groundwater are successful, and many of them were failed. Therefore, looking for new developed approaches of groundwater exploration became a must, especially in the absence of creditable approaches, which rely mainly on conventional applications.
In this respect, new space techniques, in combination with GIS, could help in water resources assessment, with a special emphasis to groundwater exploration. This includes, monitoring water flow on ground surface, percolating down to subsurface stratum the flowing among different rock beds until storage. These tools can extract data and information with a comprehensive figure, thus consuming time and resulting information with least cost.
In Lebanon, space technology application in water resources has been raised in the last ten years. Thus, several studies were obtained to solve a number of hydrological and hydrogeological clues. This technique proved an understanding capability in groundwater exploration and monitoring, especially in the complicated geological structure of Lebanon where fracture systems and karstification are well developed.
REFERENCES
- M. Khawlie, A. Shaban and T. Darwich, 2003. “Seawater Intrusion in Beirut and the Possibility of Impact Reduction,” Conference on Groundwater Management in Greater Beirut, Beirut, 19 December 2003.
- M. Fawaz, “Towards a water policy in Lebanon,” ESIB Press, Beirut, 2007, p. 1-259.
- Z. Beydoun, “Petroleum prospects of Lebanon: Reevaluation,” American Association of Petroleum Geologists, Vol. 61, 1977, pp. 43-64.
- Etude des Eaux Souterraines, “Programme des Nations Unies Pour le Développement,” Liban, 1970.
- A. Shaban, “Etude de l’hydrogéologie au Liban Occidental: Utilisation de la télédétection,” Ph.D. Dissertation, Bordeaux Université, Bordeaux, 2003, p. 1-202.
- A. Shaban, “Indicators and Aspects of Hydrological Drought in Lebanon,” Water Resources Management, Vol. 23, No. 10, August 2009, pp. 1875-1891.
- A. Shaban, M. Khawlie and C. Abdallah, “Use of Remote Sensing and GIS to Determine Recharge Potential Zones: The Case of Occidental Lebanon,” Hydrogeology Journal, Vol. 14, No. 4, April 2006, pp. 433-443.
- J. Chorowicz, J Beard, R. Guillander, R. Morasse, D. Prudon, J. Rudant, “Automatic dip and Strike Measurements on Digitized Three-Dimensional Geological Map,” Photogrammetric Engineering and Remote Sensing, Vol. 57, No. 4, 1991, pp. 431-436.
- A. Shaban, F. El-Baz and M. Khawlie, “The Relation between Water-Wells Productivity and Lineaments Morphometry: Selected Zones from Lebanon,” Nordic Hydrology, Vol. 38, No. 2, 2007, pp. 178-201.