Journal of Biomedical Science and Engineering
Vol.6 No.9(2013), Article ID:37156,9 pages DOI:10.4236/jbise.2013.69114
On a cardiac work rate based on ventricular pressure measurement*
![]()
1Laboratório de Fisiologia da Respiração UFRJ, Rio de Janeiro, Brasil
2PPG de Ciências Fisiológicas, Centro Biomédico UFES Av. Marechal Campos, Campus de Maruípe, Vitória, Brasil
3Departamento de Matemática CCE UFES Av. Fernando Ferrari, Campus de Goiabeiras, Vitória, Brasil
Email: lumcamilo@gmail.com, daltonv2@terra.com.br, aquino.ufes@gmail.com
Copyright © 2013 Luciana Moises Camilo et al. This is an open access article distributed under the Creative Commons Attribution License, which permits unrestricted use, distribution, and reproduction in any medium, provided the original work is properly cited.
Received 21 June 2013; revised 28 July 2013; accepted 15 August 2013
Keywords: Cardiac Work Rates; Mathematical Numerical Model; Control Index
ABSTRACT
We presented a cardiac work rate for one cycle cardiac based on the area of a Pressure Phase Plane, the velocity of activation and relaxation of the pressure curve, the interval of time and the variation of the pressure measurement on that cycle. We established an algebraic model to the Pressure Phase Plane area with a complete correlation of that model and the laboratory data for normal hypertensive and hypertrophied rat hearts (r = 0.99). We have obtained disjoint intervals for the cardiac work rate of the control group and the hypertrophied rat hearts as a consequence of the application of our algebraic model in those data acquisition.
1. INTRODUCTION
We collected parameters involved in the cardiac work by recovering some basic aspects of the physiology of the heart and the measurement of the cardiac work. The beating heart ejects blood to the circulation and the volume of blood ejected depends on the ventricular pressure development. The volume of blood in a normal ventricle of a human being before ejecting (end diastolic volume) is called stroke volume and it is about 130 mL and usually 65 through 75 percent of this volume called ejection fraction is ejected under normal conditions. The venous return is given by the volume of blood that returns to the heart and the pressure against that flow where the ventricle has to eject the blood is called the diastolic aortic pressure. The ending diastolic volume is described as a preload and the aortic pressure as afterload.
A general assumption is that the product of volume by pressure is equal to the work produced by the heart. The stroke volume and the ventricular pressure can be regulated by the organism to fulfill the changing metabolic needs of the body. Physical exercises, for instance, increases venous return, consequently the preload, and also it increases ventricular pressure development, which increases the stroke volume and the cardiac stroke work.
When hypertension develops, the afterload increases. The heart has to increase pressure development to maintain the stroke volume necessary for body needs. This condition triggers adaptive mechanisms that result in cardiac hypertrophy to maintain the necessary cardiac output for body needs. However, when the cardiac muscle has no conditions to develop the proper amount of pressure it can be dilated, in such condition a stroke volume, sufficient to maintain basal conditions, might be attained although presenting a reduced ejection fraction. The worsening of such conditions characterizes the severity of heart failure.
The ventricular heart function can be evaluated in two moments, during diastole when the heart is being filled with blood (the diastolic function), and during systole when the heart is pumping blood into the circulation (systolic function), that is, the cardiac work may be evaluated in those two conditions during systole and during diastole.
Finally, we observe that current techniques to measure cardiac work rates are expensive and mostly having difficult performance. Usually it can be done by simultaneous measure of the intraventricular pressure and ventricular volume using echocardiography or catheters, for instance.
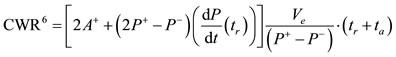
Our aim in this paper is to propose the development of a new approach of procedure to provide a cardiac work rate as an important and manageable tool for any physician everywhere mostly from developing countries where those invasive and expensive protocols are impossible tasks. We collected the most important parameters involved in the cardiac work to postulate an equation that describes one cycle cardiac work, as follows,
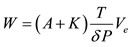
where  is the area of a Pressure Phase Plane,
  is a constant determined by the activation and relaxation velocity of the pressure curve on that cycle,
  is the elapsed time of that cycle,
  is the maximum variation of the pressure in that cycle and
  is the stroke volume.
Following our motivation on this paper, we will assume that  to obtain a numerical approximation of the one cycle cardiac work rate. This paper is organized as follows. In Section 1, the mathematical and physical concepts and models are presented. We notice that our algebraic model for the Pressure Phase Plane area leads us to an approximation function of the cardiac work. We present six control rates based on our mathematical model. In Section 2, we present protocols and tables with the acquired data. In Section 3, we discuss our mathematical model applying on our laboratory data acquisition. We have obtained disjoint interval of rates for different groups of the laboratory samples.
2. PHYSICAL AND MATHEMATICAL CONCEPTS
It is a well known principle from Bernoulli that as the speed of a moving fluid increases the pressure within the fluid decreases if the fluid have some characteristics as smooth flow with a laminar movement and it flows everywhere through the pipe with the same density. We observe that the laminar movement at slow velocities is smooth when fluid particles are moving in straight lines along the direction of flow. Although, it is not exactly the case of the arterial flow movement of blood it is a very reasonable approximation. This principle is applied to the case of static and dynamic pressures which includes the case of arterial blood pressure since static pressure decreases when the flow velocity increases and dynamic pressure corresponds to the movement of the fluid through the pipe.
Using the Newton’s second law and assuming that the energy is conserved, that is, the energy for a mass of fluid at point  is equal to the energy for the same mass of fluid at point
  then we will obtain the Bernoulli’s equation

where  for
for  and
and  are the pressure measurements at the points
  and
and  of the pipe,
  is the density of the fluid and
  and
and  are the velocity of the fluid on that points and where
  is the gravitacional acceleration and
  means the height at the fixed points
  and
and  We observe from this equation that increasing the pressure difference increases the fluid velocity difference since the pressure difference between two points creates the force that accelerates the fluid.
The arterial blood flow results from the pumping activity of the heart during systole and from the elastic recoil of the arterial wall during diastole. Resistance to blood flow in the systemic circulation depends on several factors. Since blood flow offers resistance the energy given by ventricular pressure reduces along the systemic circulatory bed althought the volume that enters the systemic circulation is always equal to the volume that returns to the heart. Consequently, blood needs to be reenergized by the heart pump to circulate again, which transfers energy to the blood as pressure. We have at this point the main difference from the arterial flow of blood and the cardiac vascular flow of blood. Despite the fact that at any point of that arterial flow movement we have different amount of energy it occurs a significant contribution of energy from the moviment of the pipelines itself.
We will assume the following physical model throughout this paper. We consider that both arterial and vascular flow movements are described by a steady system meaning that the parameters of the flow at any point do not change with time. We are based on a model for the pressure curve for one cardiac cycle. We consider the function of pressure as  class function of time, that is, its first and second derivatives are continuous functions. We also consider the pressure function defined on a closed interval denoted by
 , where
  is the elapsed time from the minimal pressure value
  to the maximal pressure value
 , called activation time, and
  is the elapsed time from the maximal pressure value to the minimal pressure value, called relaxation time. We will assume that
 .
.
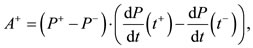
Our model of the pressure curve takes the shape described on the graph presented in Figure 1. We recall [1] for a complete description. We notice that  and
and  are the points of the maximum and the minimum values of the first derivative function of the pressure function, respectively. We recall that
  is a positive value and
  is a negative value.
We observe that Pressure Phase Plane, denoted by PPP, is defined by a plane curve with coordinates  and
and

Figure 1. Pressure curve model. Definition of abbreviations: : minimal pressure/diastolic pressure;
 : maximal pressure/systolic pressure;
 : inflection point of the pressure curve with positive first derivative of intraventricular pressure;
 : inflection point of the pressure curve with negative first derivative of intraventricular pressure;
 : activation time;
 : relaxation time.
 , where
  represents the pressure function on the variable of time
  and
and  its differential, meaning its derivative function of order one. We denote by
  an element of area on the Figure 2. We observe that those elements of area of the region
  and the region
  on the Figure 2 are equivalents. One may apply elementary tecnics from Riemann Integral and the Mean Value Theorem to deduce the function of the area of that regions by the following integral
 (*)
(*)
where  is a function defined by
 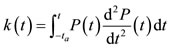 on the interval
  and the constant
  As a consequence of (*)

Figure 2. Pressure Phase Plane. Definition of abbreviations: : minimal pressure/diastolic pressure;
 : maximal pressure/systolic pressure;
 : positive first derivative of intraventricular pressure;
 : negative first derivative of intraventricular pressure;
 : activation time;
 : inflexion point of time to achieve
 ;
; : inflexion point of time to leave
 ;
; : relaxation time.;
  = activation elements of area;
  = relaxation elements of area.
we have the following general equation

hence we have the following algebraic expression for that area on the interval 

where 
We will denote by  the number value
which is a maximum number value for the area of PPP on the interval  We observe that
 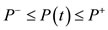 for each
  Hence we have the following inequalities.

Following those inequalities we have an interval of values for that area of PPP in terms of  and the function
  evaluated on
  and its peak derivatives. Since
  is a positive value number one may consider three possibilities for an aproximation value number of the PPP area as follow 1.
2. 
3. 
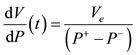
According our explanation of the cardiac work previously presented we have portions of blood moving in different distances inside the heart with a variable force. We have assumed a model for the cardiac work as a movement of a pump acting by pressure hence we assume that an element of work denoted by  is given by the product of pressure and the variation of volume. Since the function of volume is also a function of the pressure we have
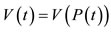 . It follows from the Chain Rule that
 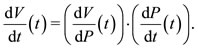 Hence the function
  is given by

We are able to evaluate the integral  denoting the one cycle cardiac work during the interval
We will consider the approximation of the function 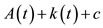 given by
 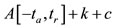 and we will evaluate the derivative of the volume function as a pressure function by the mean variation namely
where  denotes the ejection fraction of the stroke volume. Hence we have the following approximation for the one cycle cardiac work
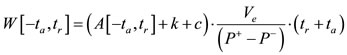
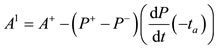
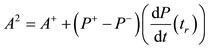
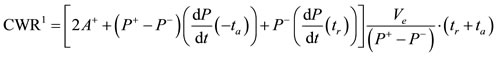
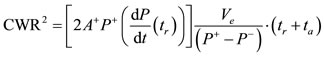
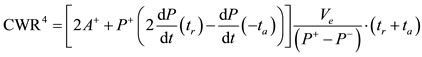
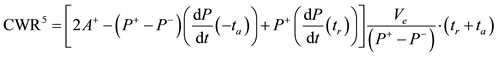
We have three approximation number value for the area of PPP, two approximation number value for the constant  and the constant
  presented above hence we are able to present six control rates for the one cycle cardiac work, denoted by
  and given by the following value numbers:
1. 
2. 
3. 
4. 
5. 
6. 
Remark: We notice that  and
and  are obtained by considering the area
 . For
. For  and
and  we consider
  and finally for
  and
and  we consider
 .
.
3. DATA ACQUISITION
We will present on this section methods and tables obtained on laboratory acquisition.
3.1. Animals
Male Wistar and spontaneously hypertensive rats (SHR) weighing between 200 and 250 g were divided into four groups: 1) Control group (C; n = 7) comprised of Wistar rats; 2) SHR group (SHR; n = 7) comprised of spontaneously hypertensive rats; 3) ISO group (ISO; n = 9) comprised of Wistar rats that received isoproterenol (0.3 mg/kg/day, sc, Sigma) in soybean oil for 7 days; and 4) Vehicle group (V; n = 6) comprised of Wistar rats that received a 7-day course of injections of vehicle in an identical volume (0.1 mL, sc) as that administered to the animals of the ISO group. All experiments were conducted in compliance with the guidelines for Biomedical Research as stated by the Brazilian Societies of Experimental Biology. All rats had free access to water and were fed rat chow ad libitum.
3.2. Isolated Heart Preparation
Animals were anesthetized with sodium pentobarbital (60 mg/kg, intraperitoneally (ip)) and heparinized (40 U). After thoracotomy, the heart was removed, and the ascending aorta was perfused with Krebs-Henseleit bicarbonate buffer solution (in mM: 120 NaCl, 5.4 KCl, 1.25 CaCl2, 2.5 MgSO4, 1.2 Na2SO4, 2.0 NaH2PO4, 20 NaHCO3, and 11 glucose [salts used were of analytical grade; Sigma, St. Louis, MO, USA and Merck, Darmstat, Germany]) according to the Langendorff technique, under constant flow (10 L/min), at 37˚C. The perfusate was gassed with 95% O2 and 5% CO2. The right atrium was removed in hopes of eliminating the sinoatrial pacemaker. The heart was then stimulated at a fixed rate of 200 bpm with two platinum electrodes. The left atrium was opened to introduce a soft distensible balloon mounted at the tip of a rigid plastic tube into the left ventricular cavity through the atrioventricular valve. To avoid liquid accumulation in the ventricular cavity, the ventricle was perforated with a puncture needle. The balloon was connected via a Y piece to a pressure transducer (TSD 104ABiopac) and to a syringe so that the diastolic pressure of the left ventricle could be adjusted to predetermined values by injecting water into the balloon. The developed isovolumic systolic pressure (ISP) and its first derivative (dP/dt) were measured with a pressure amplifier (MP 100 Biopac Systems: Inc.; CA) and recorded with a data acquisition system (BIOPAC MP100WSW, including the software Acqknowledge III, Goleta, CA). The first derivative of the isovolumic pressure was obtained offline using the same software (digital filter Blackman −61 dB, 25 KHz of cut frequency and sample rate of 1000/s). Coronary perfusion pressure was also measured at the aortic cannula. Measurements were initiated after a 20 min period of stabilization. The basic protocol was performed beginning with a constant diastolic pressure of 10 mmHg that was achieved by adjusting the volume of the balloon. During the experiments, the volume of the balloon was kept constant, enabling measurement of the diastolic and systolic pressure changes produced by the nutrient solution.
3.3. Experimental Protocol
The following interventions were carried out in all groups in the order presented after 20 minutes of stabilization. The possibility that the Frank-Starling mechanism of the heart might affect the behavior of θ and PPA was also investigated. Ventricular function curves were obtained by measuring the steady-state isovolumic systolic pressure that developed in the ventricular chamber as the diastolic pressure was increased from 0 to 30 mmHg in increments of 5 mmHg. The effect of an inotropic intervention on the behavior of θ and PPA was also investigated using isoproterenol (0.1 mL; 10−5 M), a β-adrenergic agonist given during Krebs perfusion with a reduced calcium concentration (0.5 mM).
3.4. Phase Plane Construction and Analysis
The PP construction, a plot of dP/dt versus P, was performed using the Biopac Student Lab software, keeping a scale of 50 mmHg and 500 mmHg/s for P in the X axis and dP/dt in the Y axis, respectively, for all measurements. The values of the final slope  and the PPP area were obtained with AutoCad 2004 software.
3.5. Data Analysis and Statistics
All values are expressed as mean ± standard error of the mean (SEM) of the number of animals used in each experiment. Results were analyzed using 1- or 2-way analysis of variance (ANOVA). When the ANOVA showed a significant treatment effect, Fisher’s post hoc test was used to compare individual means. Student’s ttest was used to analyse the effects of isoproterenol. Differences were considered significant at 
4. DISCUSSION: CARDIAC WORK RATE
We have collected from laboratory experiments those data presented on the Table 1. We refer Tables 2 and 3 for the measured and estimated PPP area and the calculation of the cardiac work rate, respectively, presented in Section 2. The Phase Plane is a well known and useful tool to understand the behavior of arterial pressure and cardiac muscle mechanical properties, for instance.
Previous reports showed that the phase plane area can be used to describe mechanical characteristics of contraction and relaxation of papillary muscles of the heart, such as contraction kinetics and elastic characteristics (see [2], Vassallo et al., 1979). In the last decade, PPA has been used as a tool to access ventricular function and the functional coupling of the vasculature to diastolic function (we refer [1] Eucker et al., 2001 and [3] Chung et al., 2006). We recall from [4] (Castellano, 1977) that the force-velocity relation on the mechanical properties of cardiac muscle obeying the Hill’s equation given by 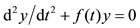 where
where  is a periodic function, under certain given conditions. We know that
  is a general solution of the Ricatti's equation
 , hence we have the algebraic expression
 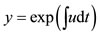 as a formal solution of that equation, that is, with no initial conditions. The authors in [4] tell us that the pre-ejection pressure time curve P(t) during an isovolumic contraction is also a solution of Hill’s equation under given conditions.
We shall present a mathematical model for the calculation of the area of a Pressure Phase Plane (PPP) which does not depend on an algebraic description of the
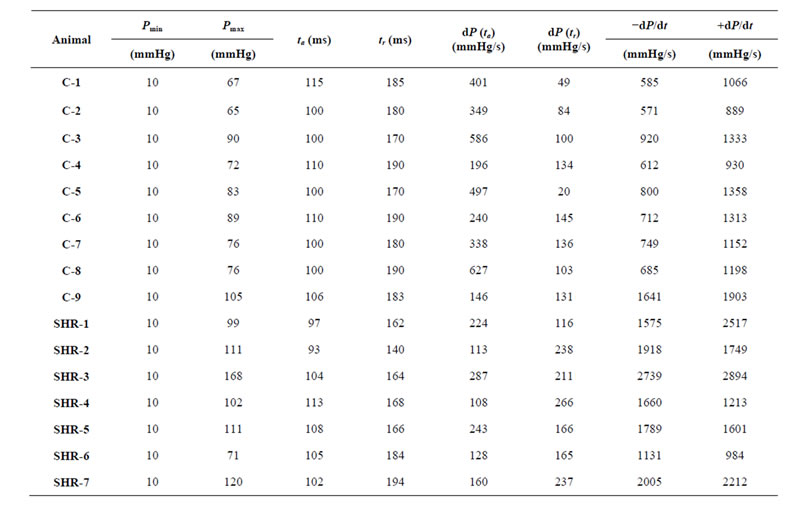
Table 1. Cardiac mechanics parameters.
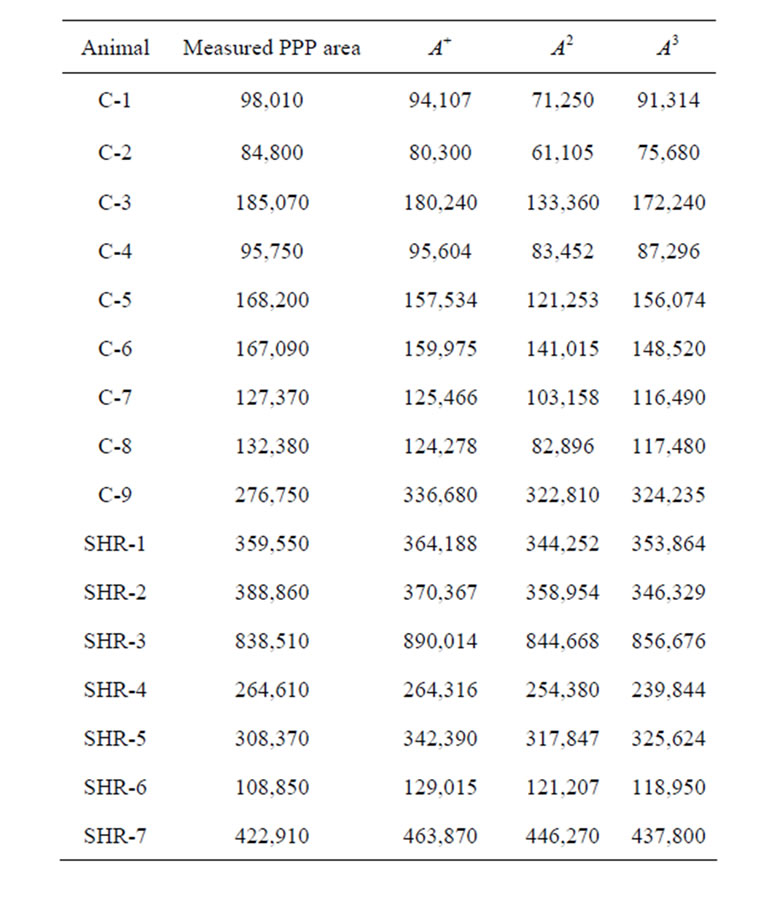

Table 2. Calculated and estimated Pressure Phase Plane area.
pressure curve itself. However, we applied our data collected in the lab on the software Mathlab to obtain an algebraic description of the pressure curve and its phase plane and verified the degree of confidence of those estimated data. The graphic and algebraic expressions of those curves are presented in Figure 3, moreover, the curve of PPP obtained from our data is exactly on the class of solution of that in Hill’s equation since it is given by 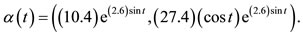 Hence, we are completely confident in the accuracy of the rates we have obtained when we applied our algebraic model on the data acquisition. See also [5] (Fung, 1970).
We have in Table 2 the calculation of the PPP area given by the standard measure and our algebraic expression as presented in Section 2. That table and the graphs in Figure 4 lead us to conclude that the data obtained from laboratory acquisition and our mathematical model to calculate the area of PPP fit each other. In particular, we have that our math model is perfectly adequate to the experiments.
We have in Table 3 the six control rates for the one cycle cardiac work when we consider 
We recall from data acquisition (see Table 1) that the item 9 has the major pressure variation and peak derivatives in the control group which lead us to conclude that the item 9 must have a greater cardiac work rate. In fact,
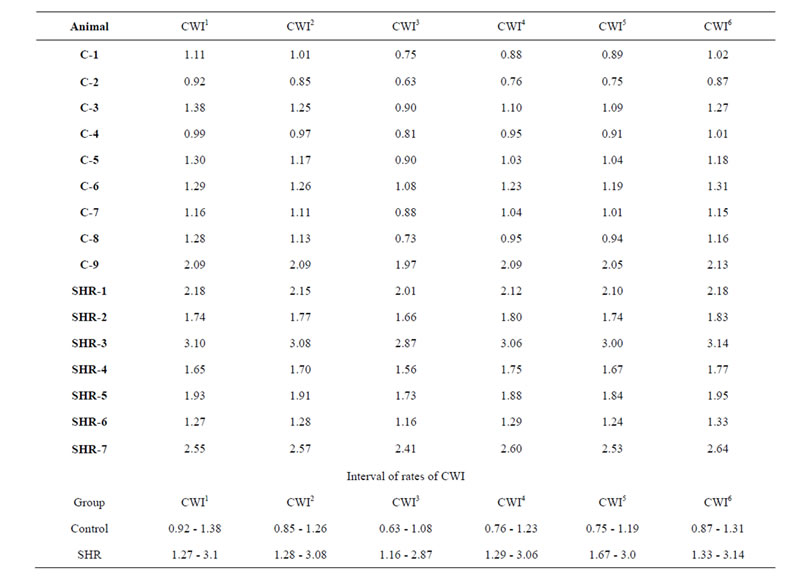
Table 3. Calcullus of cardiac work rate.
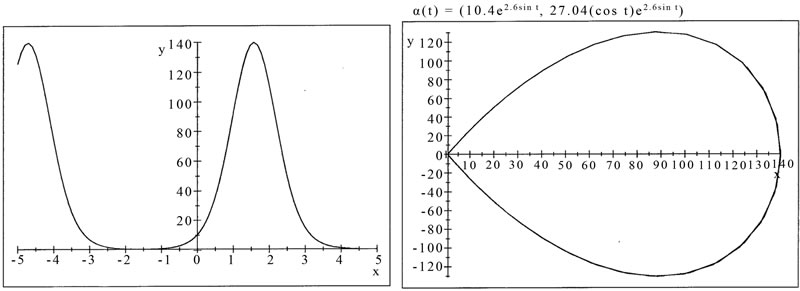
Figure 3. MathLab simulation from data acquisition. Pressure curve (left). Pressure Phase Plane (right). One cardiac cycle, inscribed clockwise, is shown. See text for details.
it has greater data than others in the control group or even some on the SHR, hence, it has a cardiac work rate on interval range of the hypertrophied heart group (see Figure 5 and Table 3).
We have considered the CWR obtained in the control group. We have that the third rate presented has the smallest number value between all of them when we compare those items and the first one is the biggest number value on that table by taking the same procedure. The minimum value of those rates in this group is achieved by the item C-2 and the maximum value by both item C-3 and item C-6. We recall that the item 9 on that control group has a bigger number value than the
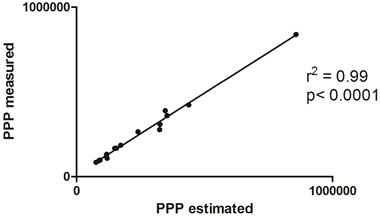
Figure 4. Linear correlation between measured and estimated phase plane area. Comparision between Pressure Phase Plane (PPP) area measure by the standard method and estimated by algebraic expressions in function of pressure as presented in Section 2.
other items and also is bigger for each algebraic expression of the CWR by comparison with the other items from this group. We notice that the CWR in this group has a rate from 0.63 to 1.38 (in million) regardless of item 9.
We now observe the hypertrophied heart group. We still have the third rate as the smallest and now we have the sixth rate as the biggest value number rate when we compare those items. The item SHR-6 presented the minimum value of those rates for this group and SHR-3 the maximum value. We recall that the CWR on this group has a rate from 1.24 to 3.14 (in million). We notice that control rates of item C-9 of the control group fit in that group of SHR as one may expect. We also observe that the data time and pressure of item SHR-6 belong to the interval of the control group and the derivatives data.
We refer the graphics on Figure 5 to illustrate the remarks presented above.
We notice that the first control rate has an intersection interval on those value numbers of the different groups. All rates but the first one have no intersection interval on

Figure 5. Comparison of cardiac work rates between control and SHR groups. Graphics of cardiac work rate (CWR). CI: Cardiac work rate; C: control group; SHR: spontaneous hypertensive rats group. Values were given by mean and SEM, *p < 0.05 vs C.
those number values.
Finally, we observe that the cardiac work rates presented in this paper can be redefined by considering other intervals of time, namely, one minute. In this case, one may consider the sum of all control rates during one minute or also by considering a mean value of those rates, for instance, on this interval of time. We observe that the studies for a human heart cardiac work will follow the same steps since we have considered  and the only one cardiac cycle.
REFERENCES
- Eucker, S.A., Lisaukskas, J.B., Singh, J. and Kovàcs, S.J. (2001) Phase plane analysis of left ventricular hemodynamics. Journal of Applied Physiology, 90, 2238-2244.
- Vassalo, D.V. and Paes de Carvalho, A. (1979) Phase plane determination of the mechanical properties of the miocardium. Acta Physiol Pharmacol Latinoam, 29, 137- 149.
- Chung, C.S., Strunc, A., Oliver, R. and Kovács, S.J. (2006) Diastolic ventricular-vascular stiffness and relaxation relation: Elucidation of coupling via Pressure Phase Plane-derived indexes. American Journal of Physiology-heart and Circulatory Physiology, 291, H2415-2423. http://dx.doi.org/10.1152/ajpheart.00257.2006
- Castellano, E.E. (1978) Analytical description of forcetime and force-velocity relations of isometric contractions in feline isolated heart muscle and in the intact heart. Circulation Research, 42, 686-693. http://dx.doi.org/10.1161/01.RES.42.5.686
- Fung, Y.-C. (1970) Mathematical representation of the mechanical properties of the heart muscle. Journal of Biomechanics, 3, 381-404. http://dx.doi.org/10.1016/0021-9290(70)90012-6
NOTES
*The first author was supported by a scholarship from CAPES, the second author was supported by a grant from the CAPES, PRONEX/ FAPES/CNPq and the third author was supported by grants from CAPES.