Journal of Biomedical Science and Engineering
Vol.6 No.5A(2013), Article ID:32048,8 pages DOI:10.4236/jbise.2013.65A010
Human skeletal muscle perilipin 2 and 3 expression varies with insulin sensitivity*
![]()
1Center for Healthy Aging, Copenhagen, Denmark
2Department of Biomedical Sciences, Faculty of Health Sciences, University of Copenhagen, Copenhagen, Denmark
Email: #avhansen@Sund.ku.dk
Copyright © 2013 Andreas Vigelsø et al. This is an open access article distributed under the Creative Commons Attribution License, which permits unrestricted use, distribution, and reproduction in any medium, provided the original work is properly cited.
Received 5 March 2013; revised 6 April 2013; accepted 8 May 2013
Keywords: Lipid Metabolism; Insulin Sensitivity; Perilipin Proteins; Lipolysis; Human Skeletal Muscle; Lipotoxicity
ABSTRACT
Background: Impaired insulin sensitivity may partly arise from a dysregulated lipid metabolism in human skeletal muscle. This study investigates the expression levels of perilipin 2, 3, and 5, and four key lipases in human skeletal muscle from the subjects that exhibit a range from normal to very low insulin sensitivity. Methods: 25 middle aged male participants were matched for lean body mass and recruited into three groups; type 2 diabetes patients (T2D), impaired glucose tolerance (IGT), and healthy sedentary controls (CON) according to their glucose tolerance and VO2peak. A muscle biopsy was obtained from vastus lateralis, and a two-step sequential euglycaemic-hyperinsulinaemic clamp was performed. Muscle samples were analyzed by Western blot for expression of perilipin 2, 3, 5, adipose triglyceride lipase (ATGL), hormone-sensitive lipase (HSL), endothelial lipase (EL) and lipoprotein lipase (LPL). Results: Perilipin 3 expression was higher in T2D compared to CON. Perilipin 2 expression was higher in CON than T2D. We observed no difference in expression of perilipin 5, ATGL, HSL, EL or LPL between the groups. Conclusions: In the present study the muscle perilipin 3 expression and perilipin 2 expression varied markedly with insulin sensitivity. This difference in perilipin expression may indicate that the lipid droplet function and thus storage and release of fatty acidvary with insulin sensitivity.
1. INTRODUCTION
In muscle triacylglycerol (TG) is stored in lipid droplets and during the last decade our knowledge of the structural proteins, perilipins, and their interaction with primary muscle lipases has increased tremendously. Today lipid droplets in muscle are regarded as dynamic organelles that are tightly controlled byperilipin 2, 3 and 5, which coat their surface [1-3]. In muscle the breakdown of TG is influenced by perilipin 2 and probably also perilipin 3 and 5, which is believed to regulate the activity of ATGL through CGI-58 a protein also located at the lipid droplet membrane [4-6]. Furthermore, it is possible that perilipin proteins in muscle may also be involved in the translocation and activation of HSL for diacylglycerol breakdown [4-6]. The correlation between insulin sensitivity and intramuscular TG storage is strong and has emerged numerous times and yet no causal link has been demonstrated explaining this [7,8]. The high muscle TG content is thought to lead to a high concentration of intracellular acylated long chain fatty acids that may attenuate insulin sensitivity through increased bioactive lipid intermediate content [Reviewed by: 9,10] and/or an increased content of mitochondrial fatty acid intermediates [11]. In accordance with this it is possible that the content and composition of perilipin proteins in muscle may be influenced or altered in insulin resistant states and thereby mediate the coupling between TG content and insulin sensitivity through the regulation of intracellular long chain fatty acid levels. However, at present the evidence is somewhat conflicting where studies have demonstrated increased perilipin 2 expression concomitant with increased insulin sensitivity in obese [12] and in type 2 diabetes subjects [12,13], whereas other studies have found decreased perilipin 2 and 5 expression concomitant with increased insulin sensitivity [14]. It is tempting to speculate that an accumulative distortion in the expression pattern of the lipid droplet supporting perilipin proteins and muscle lipases induced by metabolic dysregulation may interact and contribute to an increased intracellular long chain fatty acid content that may eventually induce lipotoxicity [8]. Therefore, the aim of present study was to quantify levels of perilipin 2, 3 and 5, two lipases expressed in the endothelial wall (EL and LPL), and two intracellular lipases (ATGL, and HSL) in human skeletal muscle, within subjects exhibiting a range of normal to very low insulin sensitivity.
2. MATERIALS AND METHODS
2.1. Subjects
Twenty-five middle aged men were recruited into three groups according to their glucose tolerance and training status: Patients diagnosed with type 2 diabetes (T2D, n = 8), overweight or obese subjects with impaired glucose tolerance (IGT, n = 9), and healthy sedentary controls (CON, n = 8). The groups were matched for age and lean body mass (LBM). Exclusion criteria were familial predisposition to type 2 diabetes (except in the T2D group) and medical treatment other than oral hypoglycemic agents and insulin. Furthermore, the subjects were instructed to refrain from alcohol, tobacco and strenuous exercise 48 hours prior to the screening and the experimental day. All subjects received written and verbal information about the purpose and potential risks and complications of the experiment. Informed written consent was obtained before inclusion. The study was approved by the Copenhagen Ethics Committee (KF 01- 091/02), and was carried out in accordance with the Declaration of Helsinki II. We have previously published two papers based on the experiment from which the present data are also generated [15,16].
2.2. Testing and Experimental Procedure
The subjects participated on two separate days; a screening and an experimental day. The screening and experimental procedures have previously been described in full detail [15,16]. In brief subjects arrived after an overnight fast on both experimental days. The screening day included measurement of height, weight, a standard oral glucose tolerance test (OGTT), body composition and peak oxygen uptake. Body composition was determined from dual-energy X-ray absorptiometry (DXA) (DPX-IQ 240; Lunar, Madison, WI, USA). In the OGTT a venous blood sample was retrieved before and 120 min after consumption of 75 g glucose distributed in 400 ml of water. Peak oxygen uptake (VO2peak) was determined using agraded exercise test on a semi-supine bike. Pulmonary oxygen consumption was monitored on an online system (Oxycon Pro system; Jaeger, Hoechberg, Germany).
On the experimental day muscle biopsies were obtained from m. vastus lateralis after 30 min of rest in the supine position using the Bergström muscle biopsy needle technique modified to include suction [17]. Muscle biopsies were obtained after administration of local anesthesia (5% lidocain, Amgros I/S, Copenhagen, Denmark) to the skin, subcutaneous tissue and fascia. The muscle tissue was frozen in liquid nitrogen within 10 - 15 s of sampling and stored at −80˚C until further analysis. Thereafter, the subjects underwent a two-step sequential euglycaemic-hyperinsulinaemic clamp, both steps lasting 120 min. In steps 1 and 2, an insulin infusion rate of 28 and 80 mU·m−2·min−1 were used, respectively. The glucose infusion rate (GIR) was adjusted according to frequent measurements (~5 min intervals) of plasma glucose concentrations using a whole blood analyzer (ABL 625; Radiometer, Copenhagen, Denmark).
2.3. Analysis of Blood and Muscle Samples
Blood samples were analyzed as described elsewhere [16]. Muscle lipase and perilipin protein expression were analyzed using Western Blot.
2.4. Muscle Homogenate Preparation
All biopsies were dissected free of all visible adipose tissue, connective tissue, and blood. The biopsies were then homogenized in a buffer (25 mM Tris pH 6.8, 10 mM Pyrophosphate, 2 mM Sodium Ortovanadate, 5 mM EDTA, 20 mM Pyrophosphate, and 3% SDS β-glycerophosphate) heated to 95˚C. Protein concentration was measured by the bicinchoninic acid (BCA) assay (Pierce, Rockford, IL USA) in triplicate, and a maximal coefficient of variation of 5% between replicates was accepted.
2.5. Western Blot
An equal amount of protein (20 µg) was heated to 55˚C for 10 minutes and electrophoresed in 4% - 15% polyacrylamide sodium dodecyl sulphate gels (Bio-rad, Copenhagen, Denmark) and electro transferred to a PVDF membrane. In order to avoid possible differences in expression of housekeeping genes induced by type 2 diabetes, the proteins were expressed relative to at least four lanes of loaded internal standard. The internal standard was a mix of 50 μl of all samples and 20 μg of this standard was loaded in all internal standard wells. The membrane was blocked for 1.5 hour at room temperature with either skimmed milk powder or bovine serum albumin (BSA) diluted in Tris-buffered saline (10 mM Tris Base, 150 mM NaCl, pH 7.4). The membranes were then incubated with the primary antibody overnight at 4˚C. The primary antibodies were: anti-ADRP (Novus Biologicals, Littleton, CO, USA), anti-ATGL (Cell Signaling Technology, Beverly, MA, USA), anti-LIPG (Sigma-Aldrich, Saint Louis, MO, USA), anti-HSL (Santa Cruz biotechnology, Inc., Heidelberg, Germany), anti-LPL (Santa Cruz biotechnology, Inc., Heidelberg, Germany), antiOXPAT (Novus Biologicals, Littleton, CO, USA), antiTIP47 (Sigma, Prestige Antibodies, St. Louis, MO, USA). Secondary antibodies were: Polyclonal goat antirabbit horseradish peroxidase conjugated, (Dako, Glostrup, Denmark) and polyclonal goat α-mouse horseradish peroxidase conjugated (Dako, Glostrup, Denmark). Blots were developed in ECL detection reagents (Amersham, ECL Western Blotting Detection Reagents; GE Healthcare) and the chemiluminescence emitted from immunecomplexes was visualized with a LAS 3000 image analyzer (FUJI FILM, Tokyo, Japan). The images were quantified by Multi Gauge software (FUJI FILM, Tokyo, Japan).
2.6. Antibody Validation
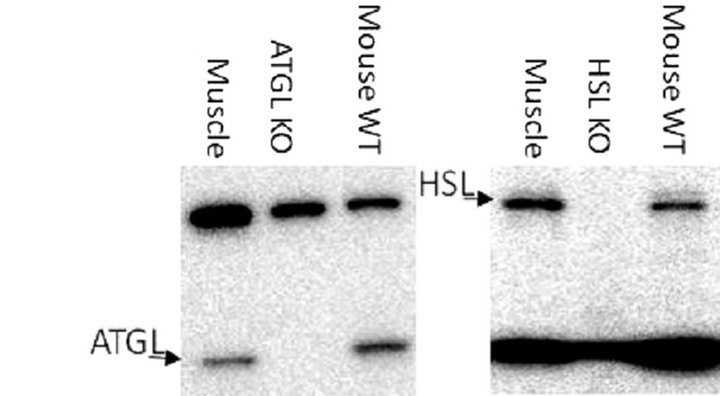
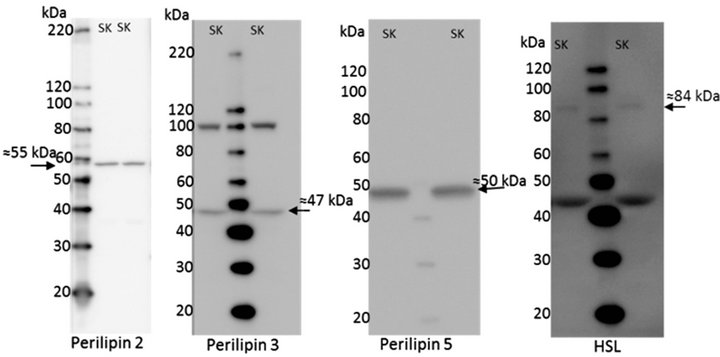
The antibodies used in this study were all from comercial manufacturers and were all validated by the companies. Furthermore, perilipin 2 [18], LPL [19,20], and ATGL [4] have been used in other publications. However, additional testing was done for ATGL, HSL, perilipin 2, and LPL, see Figure 1. perilipin 2 has been shown to be the dominant perilipin in milk fat [21]. Human breast milk was spun down at 150.000 g for 60 min and the milk fat fraction was separated from the non-fat fraction [21], see Figure 1(c). Homogenates from ATGL and HSL knockout (KO) mice were kindly donated by Professor Jørgen Wojtaszewski (Molecular Physiology Group, Department of Exercise and Sport Science, University of Copenhagen, Denmark), see Figures 1(a) and (b). All samples used for validation were handled as described in the methods section. EL, and perilipin 3 and 5 were not validated in the present study, but showed specific bands near the expected molecular weights, see Figure 2.
2.7. Statistics
All statistical analyses were performed in Sigma Plot 11.0 (Systat software, Inc., San Jose, USA). Comparisons of group characteristics and protein expression were made using one way ANOVA. When analyses of variance revealed significant differences, Tukey’s post hoc test was used for multiple comparisons. For correlations between different variables Pearson’s product moment correlation coefficient (R) and corresponding P-value were obtained. The level of significance was set at *P < 0.05. Data are expressed as mean ± standard error of mean (±SEM).
3. RESULTS
3.1. Description and Characteristics
The characteristics of the subjects in the three groups are
 (a)
(a)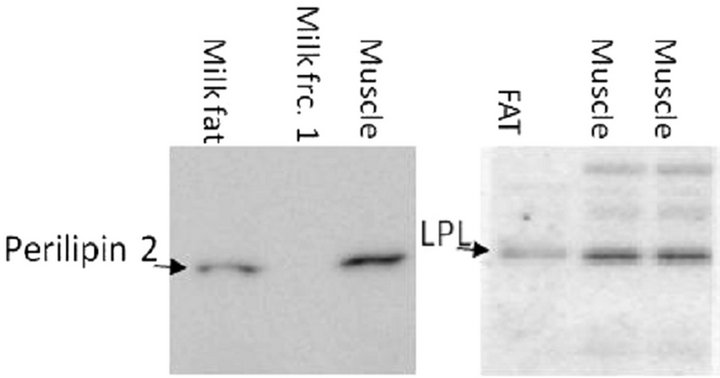 (b)
(b)
Figure 1. Validation of antibodies by positive and negative controls. (a) Specificity of the primary ATGL antibody was tested with homogenates of human skeletal muscle (muscle), ATGL knockout mouse (ATGL KO), and wild type mouse (mouse WT); (b) Specificity of the primary Hormone-sensitive lipase (HSL) antibody was tested with homogenates of human skeletal muscle (muscle), HSL knockout mouse (HSL KO), and wild type mouse (mouse WT); (c) Perilipin 2 antibody specificity was tested with a homogenate with isolated perilipin 2 containing human milk fat (milk fat), a fraction of non-fat and thereby non-perilipin 2 containing human milk (milk fat frc. 1) and human skeletal muscle (muscle). 20 µg of protein was loaded in all lanes; (d) The specificity of the Lipoprotein lipase (LPL) antibody was tested with human fat tissue (FAT), and human skeletal muscle (muscle).
given in Table 1. The classification of the subjects was based on a DXA-scanning, an OGTT and a VO2peak test. There was no difference between the groups in BMI, LBM whole body fat content (Table 1). VO2peak was lower (P < 0.05) in T2D compared to IGT and CON. The data on measurement of insulin sensitivity has been published previously [15,16]. Within the last 30 minutes of step 2 of the euglycaemic hyperinsulinaemic clamp, the glucose infusion rates (GIR) were significantly lower in T2D compared to IGT and CON (Table 1, Data only shown for step 2).
3.2. Muscle Protein Expression
Perilipin 2 expression was 17% ± 4% higher (P < 0.05) in CON compared to T2D (Figure 3(a)). The highest expression of perilipin 3 was seen inT2D, and the expression was 27% ± 4% higher (P < 0.05) than in CON.
 (a)
(a)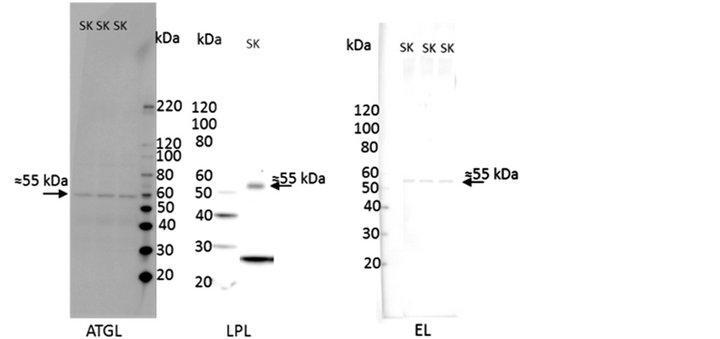 (b)
(b)
Figure 2. Example of full blots for all antibodies used in the study. (a) perilipin 2; (b) perilipin 3; (c) perilipin 5; (d) hormone-sensitive lipase (HSL); (e) adipose triacylglycerol lipase (ATGL); (f) lipoprotein lipase; and (g) endothelial lipase. Lanes marked with SK is homogenate from human skeletal muscle as described under internal standard in the methods section.
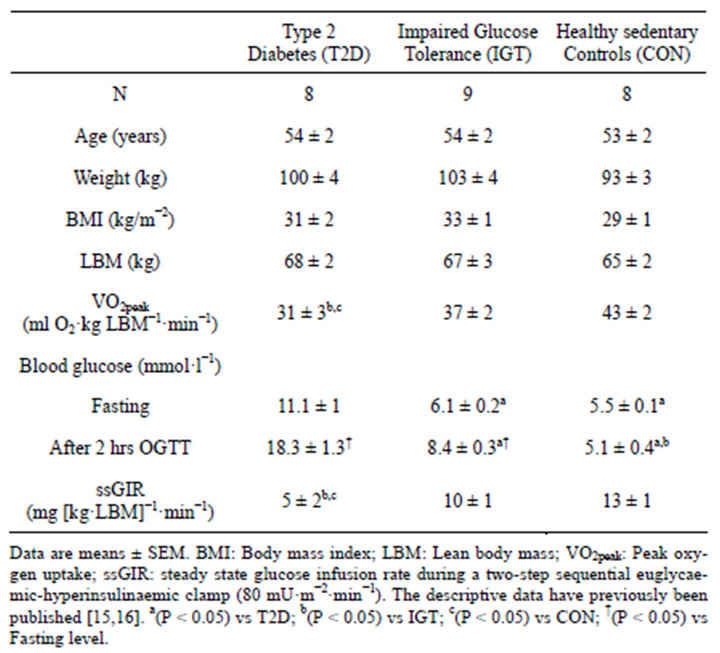
Table 1. Group characteristics.
Furthermore, perilipin 3 expression tended to be 17% ± 5% lower (P = 0.07) in IGT compared with T2D (Figure 3(b)). There was no significant difference in perilipin 5 expression between the groups (Figure 3(c)), but there was a trend towards a main effect (One way ANOVA; P = 0.11). There was a positive relation between perilipin 2 expression and GIR (R = 0.401, P < 0.05) and the perilipin 3 expression correlated negatively to GIR (R = 0.495, P < 0.01).
There were no significant differences in expression of muscle LPL, EL, ATGL or HSL between the groups (Figure 4). However, there was a trend towards a main effect for the HSL expression (One way ANOVA; P = 0.07), and when evaluated by t-test the T2D tended to be higherthan IGT (P = 0.05) and CON (P = 0.14) (Figure 4(b)).
4. DISCUSSION
In the present study a major finding was that muscle perilipin 3 expression was clearly divergent compared to perilipin 2 expression across three groups varying from normal to very low insulin sensitivity. The muscle perilipin 3 expression was higher in T2D compared to normal insulin sensitive controls, and borderline compared to IGT (P = 0.07). In contrast, muscle perilipin 2 expression was higher in CON compared to T2D, but not compared to IGT. There were no significant differences in the expression of perilipin 5, the major intracellular lipases ATGL, HSL and the extracellular lipases EL and LPL between the groups.
Little is known about the role of perilipin 3 in the human skeletal muscle. Studies in cell lines have indicated that perilipin 3 is involved in biogenesis of lipid droplets, by transport of fatty acids from the plasma membrane to lipid droplets for storage [22] and that perilipin 3 to a larger extent is involved in small lipid droplet formation, whereas perilipin 2 to a higher extent is attached to larger lipid droplets [23]. We observed a positive correlation between perilipin 2 and GIR and a negative correlation between perilipin 3 expression and GIR. A finding which is supported by Coen et al. that demonstrated a strong correlation (R = 0.81, P < 0.01) between perilipin 2 gene expression and glucose disposal in obese overweight men [24]. In perilipin 2 knockout mice normal body weight and fat mass was observed [25], which may be due to a compensatory over expression of perilipin 3 [26]. In the present study a cross sectional design was applied and given the markedly differing insulin sensitivity and different basal plasma free fatty acid concentration between groups [15,16] it is impossible to identify a causality between the difference in perilipin 3 and perilipin 2 muscle expression and insulin sensitivity. Further studies are needed to address a functional effect of varying lipid
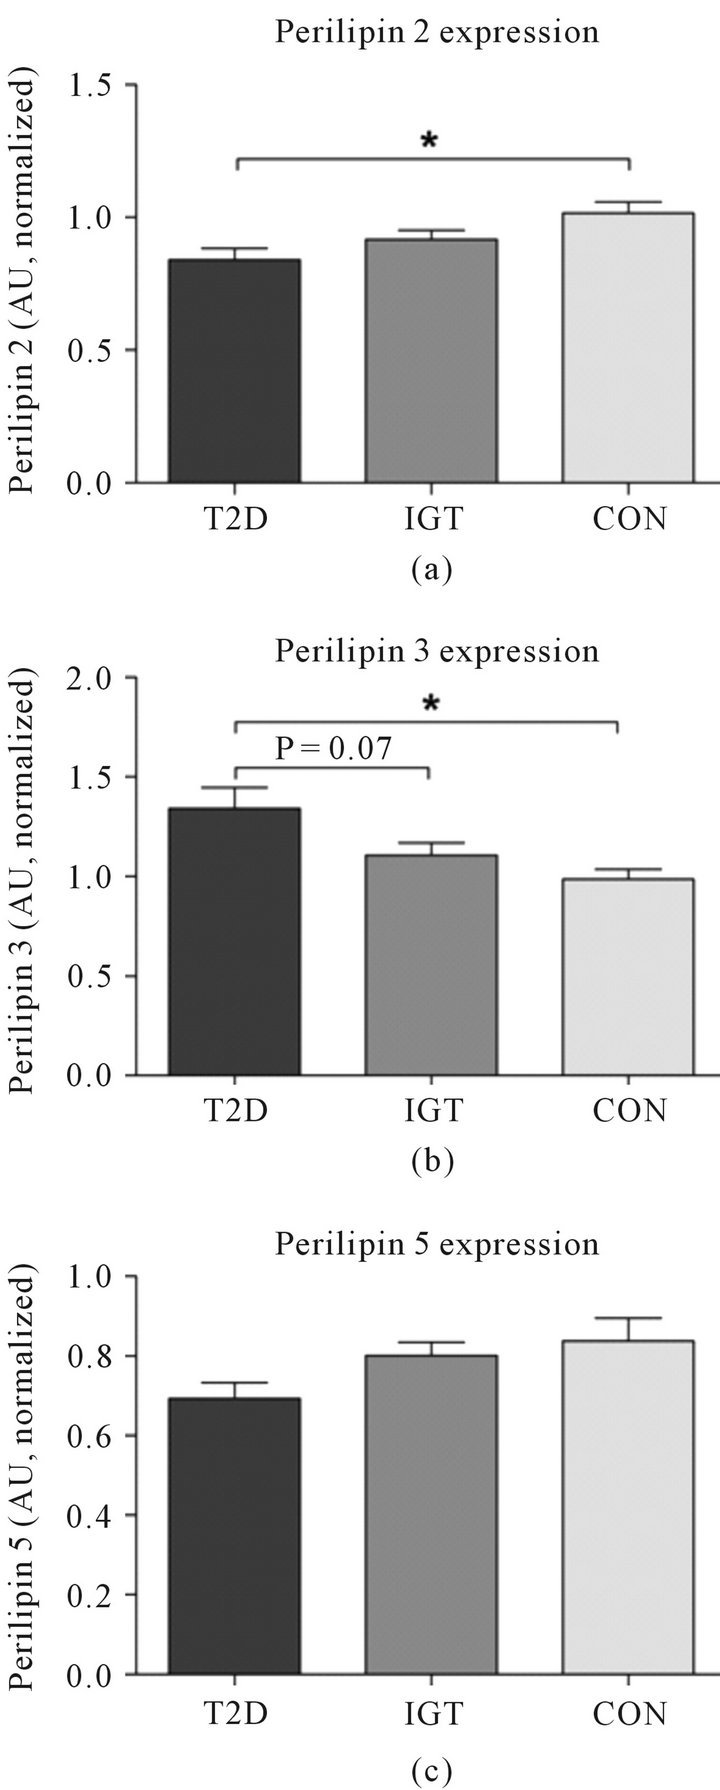
Figure 3. The expression level of (a) perilipin 2 (b) perilipin 3 and (c) perilipin 5 in three age and LBM matched groups: type 2 diabetes (T2D, n = 8), impaired glucose tolerant (IGT, n = 9), and healthy sedentary controls (CON, n = 8). The results were normalized against the means of the standard bands (n = 4), which is a pooled standard sample used for all Western Blots in the study (STD). 20 µg of muscle homogenate was loaded in all lanes. *P < 0.05. Data are presented as means ± SEM.
droplet protein expression and the influence on uptake and release of long chain fatty acids.
In former studies a high perilipin 5 expression has been observed in tissues that have a high oxidative capacity towards fatty acids [27-30]. In the present study the maximal oxygen uptake per lean mass was in fact lower in type 2 diabetes patients, and although not significant the perilipin 5 expression also tended to be lower
Figure 4. Expression levels of important lipases in human skeletal muscle. The expression level of (a) adipose triglyceride lipase (ATGL); (b) hormone-sensitive lipase (HSL) with a trend (P = 0.07) towards difference in main effect; (c) lipoprotein lipase (LPL); and (d) endothelial lipase (EL) was determined by Western Blotting in three age and LBM matched groups: type 2 diabetes (T2D, n = 8), impaired glucose tolerant (IGT, n = 9), and healthy sedentary controls (CON, n = 8). *P < 0.05. The results are presented as means ± SEM. The results are normalized against the means of the standard bands (n = 4), which is a pooled standard sample used for all Western Blots in the study (STD). 20 µg of muscle homogenate was loaded in all lanes.
in the type 2 diabetes patients compared to the more insulin sensitive subjects (P = 0.06 vs CON).
Somewhat unexpected the muscle lipase expression was not significantly different between groups despite of the observed differences in VO2peak/LBM and insulin sensitivity. Studies with a longitudinal design have shown that ATGL expression [4] and LPL activity [31] increases with regular endurance training. In the present study the differences in VO2peak/LBM are minor and may therefore not translate into differences in the muscle lipase expression. Although not significant (P = 0.07) a trend was noted towards a difference in the muscle HSL expression. It is not possible to link this to higher intramuscular diacylglycerol content and/or higher intramuscular long chain fatty acid content, and thus provide a possible mechanism for the lower insulin sensitivity. Endothelial lipase expressionis possibly involved in HDL-particle catabolism [32-34], but in human skeletal muscle the role of endothelial lipase is largely unknown.
5. CONCLUSION
In the present paper we investigated the expression of the perilipin proteins found in human skeletal muscle and the expression of the major lipases involved in recruitment of fatty acids from the circulation to the muscle and controlling breakdown of lipid droplet stored triacylglycerol. The expression level of perilipin 2 and 3 differed markedly between the three groups that exhibited a range from normal to low insulin sensitivity and maximal oxygen uptake. The observed changes in these proteins may be linked to a difference in lipid droplet function and thus storage and release of fatty acids that may be linked to insulin resistance. Although the majority of data seem to link perilipin 2 muscle expression to insulin sensitivity further studies in human skeletal muscle are needed to elucidate the interaction between muscle lipases and perilipin proteins.
6. ACKNOWLEDGEMENTS
Financial support from The 1991 Pharmacy Foundation, NOVO Nordic Foundation, Direktør Verner Richter and Hustrus foundation, the foundation of 1870, Direktør Jacob and Olga Madsens foundation, Aase and Ejnar Danielsens foundation and EU project EXGENESIS 005272 is gratefully acknowledged. Furthermore, we thank Jeppe Bach and Regitze Kraunsøe from Center for Healthy Aging; and Thomas Beck and Gerda Hau from Department of Biomedical Sciences, Faculty of Health Sciences, University of Copenhagen, Denmark, for providing excellent technical assistance.
REFERENCES
- Bartz, R., Li, W.H., Venables, B., Zehmer, J.K., Roth, M.R., Welti, R., Anderson, R.G., Liu, P. and Chapman, K.D. (2007) Lipidomics reveals that adiposomes store ether lipids and mediate phospholipid traffic. The Journal of Lipid Research, 48, 837-847. doi:10.1194/jlr.M600413-JLR200
- Kimmel, A.R., Brasaemle, D.L., McAndrews-Hill, M., Sztalryd, C. and Londos, C. (2010) Adoption of PERILIPIN as a unifying nomenclature for the mammalian PATfamily of intracellular lipid storage droplet proteins. The Journal of Lipid Research, 51, 468-471. doi:10.1194/jlr.R000034
- Brasaemle, D.L., Dolios, G., Shapiro, L. and Wang, R. (2004) Proteomic analysis of proteins associated with lipid droplets of basal and lipolytically stimulated 3T3-L1 adipocytes. Journal of Biological Chemistry, 279, 46835- 46842. doi:10.1074/jbc.M409340200
- Alsted, T.J., Nybo, L., Schweiger, M., Fledelius, C., Jacobsen, P., Zimmermann, R., Zechner, R. and Kiens, B. (2009) Adipose triglyceride lipase in human skeletal muscle is upregulated by exercise training. American Journal of Physiology—Endocrinology and Metabolism, 296, E445-E453. doi:10.1152/ajpendo.90912.2008
- Lampidonis, A.D., Rogdakis, E., Voutsinas, G.E. and Stravopodis, D.J. (2011) The resurgence of HormoneSensitive Lipase (HSL) in mammalian lipolysis. Gene, 477, 1-11. doi:10.1016/j.gene.2011.01.007
- Schweiger, M, Schoiswohl, G., Lass, A., Radner, F.P., Haemmerle, G., Malli, R., Graier, W., Cornaciu, I., Oberer, M., Salvayre, R., Fischer, J., Zechner, R. and Zimmermann, R. (2008) The C-terminal region of human adipose triglyceride lipase affects enzyme activity and lipid droplet binding. The Journal of Biological Chemistry, 283, 17211-17220. doi:10.1074/jbc.M710566200
- Pan, D.A., Lillioja, S., Kriketos, A.D., Milner, M.R., Baur, L.A., Bogardus, C., Jenkins, A.B. and Storlien, L.H. (1997) Skeletal muscle triglyceride levels are inversely related to insulin action. Diabetes, 46, 983-988. doi:10.2337/diabetes.46.6.983
- Goodpaster, B.H., He, J., Watkins, S. and Kelley, D.E. (2001) Skeletal muscle lipid content and insulin resistance: Evidence for a paradox in endurance-trained athletes. The Journal of Clinical Endocrinology & Metabolism, 86, 5755-5761. doi:10.1210/jc.86.12.5755
- Unger, R.H. (2002) Lipotoxic diseases. Annual Review of Medicine, 53, 319-336. doi:10.1146/annurev.med.53.082901.104057
- Summers, S.A. (2006) Ceramides in insulin resistance and lipotoxicity. Progress in Lipid Research, 45, 42-72. doi:10.1016/j.plipres.2005.11.002
- Koves, T.R., Ussher, J.R., Noland, R.C., Slentz, D., Mosedale, M., Ilkayeva, O., Bain, J., Stevens, R., Dyck, J.R., Newgard, C.B., Lopaschuk, G.D. and Muoio, D.M. (2008) Mitochondrial overload and incomplete fatty acid oxidation contribute to skeletal muscle insulin resistance. Cell Metabolism, 7, 45-56. doi:10.1016/j.cmet.2007.10.013
- Phillips, S A, Choe, C.C., Ciaraldi, T.P., Greenberg, A.S., Kong, A.P.S., Baxi, S.C., Christiansen, L., Mudaliar, S.R. and Henry, R.R. (2005) Adipocyte differentiation-related protein in human skeletal muscle: Relationship to insulin sensitivity[ast][ast]. North American Association for the Study of Obesity (NAASO), 8, 1321-1329.
- Shaw, C.S., Shepherd, S.O., Wagenmakers, A.J., Hansen, D., Dendale, P. and van Loon, L.J. (2012) Prolonged exercise training increases intramuscular lipid content and perilipin 2 expression in type I muscle fibres of patients with type 2 diabetes. American Journal of Physiology— Endocrinology and Metabolism, 303, E1158-E1165. doi:10.1152/ajpendo.00272.2012
- Minnaard, R., Schrauwen, P., Schaart, G., Jorgensen, J.A., Lenaers, E., Mensink, M. and Hesselink, M.K. (2009) Adipocyte differentiation-related protein and OXPAT in rat and human skeletal muscle: Involvement in lipid accumulation and type 2 diabetes mellitus. The Journal of Clinical Endocrinology & Metabolism, 94, 4077-4085. doi:10.1210/jc.2009-0352
- Skov-Jensen, C., Skovbro, M., Flint, A., Helge, J.W. and Dela, F. (2007) Contraction-mediated glucose uptake is increased in men with impaired glucose tolerance. Applied Physiology, Nutrition, and Metabolism, 32, 115- 124. doi:10.1139/h06-098
- Skovbro, M., Baranowski, M., Skov-Jensen, C., Flint, A., Dela, F., Gorski, J. and Helge, J.W. (2008) Human skeletal muscle ceramide content is not a major factor in muscle insulin sensitivity. Applied Physiology, Nutrition, and Metabolism, 7, 1253-1260.
- Bergstrom, J. (1975) Percutaneous needle biopsy of skeletal muscle in physiological and clinical research. Scandinavian Journal of Clinical & Laboratory Investigation, 35, 609-616. doi:10.3109/00365517509095787
- Son, S.H., Goo, Y.H., Chang, B.H. and Paul, A. (2012) Perilipin 2 (PLIN2)-deficiency does not increase cholesterol-induced toxicity in macrophages. PLoS ONE, 7, e33063. doi:10.1371/journal.pone.0033063
- Kirpich, I.A., Gobejishvili, L.N., Bon, H.M., Waigel, S., Cave, M., Arteel, G., Barve, S.S., McClain, C.J. and Deaciuc, I.V. (2011) Integrated hepatic transcriptome and proteome analysis of mice with high-fat diet-induced nonalcoholic fatty liver disease. The Journal of Nutritional Biochemistry, 22, 38-45. doi:10.1016/j.jnutbio.2009.11.009
- Li, Y., Sugiyama, E., Yokoyama, S., Jiang, L., Tanaka, N. and Aoyama, T. (2008) Molecular mechanism of agespecific hepatic lipid accumulation in PPARalpha (+/−): LDLR (+/−) mice, an obese mouse model. Lipids, 43, 301-312. doi:10.1007/s11745-008-3161-x
- Heid, H.W., Schnolzer, M. and Keenan, T.W. (1996) Adipocyte differentiation-related protein is secreted into milk as a constituent of milk lipid globule membrane. Biochemical Journal, 320, 1025-1030.
- Bulankina, A.V., Deggerich, A., Wenzel, D., Mutenda, K., Wittmann, J.G., Rudolph, M.G., Burger, K.N.J. and Honing, S. (2009) TIP47 functions in the biogenesis of lipid droplets. The Journal of Cell Biology, 185, 641-655. doi:10.1083/jcb.200812042
- Wolins, N.E., Quaynor, B.K., Skinner, J.R., Schoenfish, M.J., Tzekov, A. and Bickel, P.E. (2005) S3-12, Adipophilin, and TIP47 Package Lipid in Adipocytes. The Journal of Biological Chemistry, 280, 19146-19155. doi:10.1074/jbc.M500978200
- Coen, P.M., Dube, J.J., Amati, F., Stefanovic-Racic, M., Ferrell, R.E., Toledo, F.G. and Goodpaster, B.H. (2010) Insulin resistance is associated with higher intramyocellular triglycerides in type I but not type II myocytes concomitant with higher ceramide content. Diabetes, 59, 80- 88. doi:10.2337/db09-0988
- Chang, B.H., Li, L., Paul, A., Taniguchi, S., Nannegari, V., Heird, W.C. and Chan, L. (2006) Protection against fatty liver but normal adipogenesis in mice lacking adipose differentiation-related protein. Molecular and Cellular Biology, 26, 1063-1076. doi:10.1128/MCB.26.3.1063-1076.2006
- Sztalryd, C., Bell, M., Lu, X., Mertz, P., Hickenbottom, S., Chang, B.H., Chan, L., Kimmel, A.R. and Londos, C. (2006) Functional compensation for adipose differentiation-related protein (ADFP) by Tip47 in an ADFP null embryonic cell line. The Journal of Biological Chemistry, 281, 34341-34348. doi:10.1074/jbc.M602497200
- Bosma, M., Minnaard, R., Sparks, L.M., Schaart, G., Losen, M., de Baets, M.H., Duimel, H., Kersten, S., Bickel, P.E., Schrauwen, P. and Hesselink, M.K. (2012) The lipid droplet coat protein perilipin 5 also localizes to muscle mitochondria. Histochemistry and Cell Biology, 137, 205-216. doi:10.1007/s00418-011-0888-x
- Wolins, N.E., Brasaemle, D.L. and Bickel, P.E. (2006) A proposed model of fat packaging by exchangeable lipid droplet proteins. FEBS Letters, 580, 5484-5491. doi:10.1016/j.febslet.2006.08.040
- Wang, H. and Sztalryd, C. (2011) Oxidative tissue: Perilipin 5 links storage with the furnace. Trends in Endocrinology & Metabolism, 22, 197-203. doi:10.1016/j.tem.2011.03.008
- Wolins, N.E., Quaynor, B.K., Skinner, J.R., Tzekov, A., Croce, M.A., Gropler, M.C., Varma, V., Yao-Borengasser, A., Rasouli, N., Kern, P.A., Finck, B.N. and Bickel, P.E. (2006) OXPAT/PAT-1 is a PPAR-induced lipid droplet protein that promotes fatty acid utilization. Diabetes, 55, 3418-3428. doi:10.2337/db06-0399
- Svedenhag, J., Lithell, H., Juhlin-Dannfelt, A. and Henriksson, J. (1983) Increase in skeletal muscle lipoprotein lipase following endurance training in man. Atherosclerosis, 49, 203-207. doi:10.1016/0021-9150(83)90198-3
- Jaye, M., Lynch, K.J., Krawiec, J., Marchadier, D., Maugeais, C., Doan, K., South, V., Amin, D., Perrone, M. and Rader, D.J. (1999) A novel endothelial-derived lipase that modulates HDL metabolism. Nature Genetics, 21, 424- 428. doi:10.1038/7766
- Choi, S.Y., Hirata, K., Ishida, T., Quertermous, T. and Cooper, A.D. (2002) Endothelial lipase: A new lipase on the block. The Journal of Lipid Research, 43, 1763-1769. doi:10.1194/jlr.R200011-JLR200
- Jin, W., Millar, J.S., Broedl, U., Glick, J.M. and Rader, D.J. (2003) Inhibition of endothelial lipase causes increased HDL cholesterol levels in vivo. Journal of Clinical Investigation, 111, 357-362.
NOTES
*Conflict of interest: The authors declare that they have no conflict of interest.
#Corresponding author.