Journal of Biomedical Science and Engineering
Vol.6 No.4(2013), Article ID:30527,6 pages DOI:10.4236/jbise.2013.64063
Hepatic vessel segmentation on contrast enhanced CT image sequence for liver transplantation planning
![]()
Department of Computer Engineering, Sunchon National University, Sunchon, South Korea
Email: dykim@sunchon.ac.kr
Copyright © 2013 Do-Yeon Kim. This is an open access article distributed under the Creative Commons Attribution License, which permits unrestricted use, distribution, and reproduction in any medium, provided the original work is properly cited.
Received 8 February 2013; revised 12 March 2013; accepted 28 March 2013
Keywords: Living Donor Liver Transplantation; Hepatic Vascular Structure; Mathematical Morphology; Image Segmentation
ABSTRACT
The structure and morphology of the hepatic vessels and their relationship between tumors and liver segments are major interests to surgeons for liver surgical planning. In case of living donor liver transplantation (LDLT), the most important step in determining donor suitability is an accurate assessment of the liver volume available for transplantation. In addition, the mutual principles of the procedures include dissection in the appropriate anatomic plane without portal occlusion, minimization of blood loss, and avoidance of injury to the remaining liver. It is essential first step to identify and evaluate the major hepatic vascular structure for liver surgical planning. In this paper, the threshold was determined to segment the liver region automatically based on the distribution ratio of intensity value; and the hepatic vessels were extracted with mathematical morphology transformation, which called hit operation, that is slightly modified version of hit-and-miss operation on contrast enhanced CT image sequence. We identified the vein using the preserved voxel connectivity between two consecutive transverse image sequences, followed by resection into right lobe including right hepatic vein, middle hepatic vein branches andleft lobe including left hepatic vein. An automated hepatic vessel segmentation scheme is recommended for liver surgical planning such as tumor resection and transplantation. These vessel extraction method combined with liver region segmentation technique could be applicable to extract tree-like organ structures such as carotid, renal, coronary artery, and airway path from various medical imaging modalities.
1. INTRODUCTION
The liver cancer is one of the leading causes of death in worldwide. Often, the only cure for primary liver cancer is liver resection, a surgical procedure in which surgeons completely remove the diseased tissue. The liver transplantation has evolved into the treatment option of choice for a variety of patients with acute or chronic end stage liver disease arising from chronic hepatitis C virus (HCV) infection and the dramatic increase in hepatocellular carcinoma (HCC) associated with HCV infection [1].
For the purpose of liver surgical planning, the structure and morphology of the hepatic vessels and theirrelationship to tumors and/or liver segments are major interests to surgeons. In case of living donor liver transplantation (LDLT), the most important step indetermining donor suitability is an accurate assessment of the liver volume available for transplantation. In addition, the mutual principles of the procedures include dissection in the appropriate anatomic plane in absence of portal occlusion, minimization of blood loss, and avoidance of injury to the remaining liver. It is also paramount to assure adequate residual liver volume for the donor. Grafts must be of sufficient mass to support the recipient, but not at the expense of leaving inadequate residual volume in the donor and risking liver failure. The remnant liver volume should be no less than 30% of the original estimated weight [2].
Based on these facts that it is essential first step to identify and evaluate the major hepatic vascular structure, which determined the liver segments according to the branching structure of the hepatic vein.
Here we describe the hepatic vessels segmentation method for analyzing the hepatic vascular structure, which on contrast enhanced CT image sequence for liver surgical planning such as tumor resection and living donor liver transplantation.
2. MATERIALS AND METHODS
The computer algorithms for the delineation of anatomical structures and other regions of interest are a key component in assisting and automating specific surgical and radiological tasks. These algorithms, called image segmentations, play a vital role in numerous medical imaging applications such as the quantification of tissue volumes, diagnosis, localization of pathology, study of anatomical structure, treatment planning and computer integrated surgery [3]. Image segmentation is the process that partitions a digital image into disjoint connected sets of pixels, each of which corresponds to an object or region. Thresholding, region growing, and region splitting and merging are example of segmentation methods [4]. In addition, mathematical morphology exploits point set properties, results of integral geometry, and topology. The morphological operations may be viewed as shape filters which remove information from an image based on shape of objects in the image, and how they relate to the shape of the filter retaining only the information of interest in the image [5].
2.1. Liver Segmentation
The threshold techniques, which make decisions based on local pixel information, are effective when the intensity levels of the objects fall squarely outside the range of levels in the background. Thresholding is a pixel classification process to identify the pixels of a given image into two classes: those pertaining to objects and those pertaining to background. While one class includes pixels with intensity values that are below or equal to a certain threshold value, the remaining class includes those pixels with intensity values above the threshold. Correct threshold value selection is crucial for successful segmentation; this selection can be determined interactively or it can be the result of automatic threshold detection method [6]. In this section, we describe the method that automatically determines the threshold value, which is based on the distribution ratio of intensity value within the rectilinear structured grid, to segment the liver regions on the contrast enhanced abdominal CT image sequence.
2.2. Distribution Ratio of Intensity Value
If not considering the distribution ratio of intensity value, typical thresholding method can segmente the liver including adjacent organs and surrounding tissues. In case that pixel size is small enough, generally corresponding objects which have different distributions of intensity value, can not be perceived as same object. In the equalized image, object can be also segmented because it has the different distribution ratio even though has the same intensity value range as the adjacent objects and background area. Therefore, objects can be discriminated from the adjacent objects and background when the blurring effect is applied, because they have the different distribution ratio from corresponding intensity value range within rectilinear structured grid. The rectilinear structured grid plays a role of discrimination between organ and adjacent objects and background area by artificially blurring the each pixel’s intensity value in the unit area. In this paper, to discriminate the liver between adjacent objects and background area that have the corresponding intensity value range as liver, we examined the distribution ratio of intensity value and determined the threshold. Figure 1 shows the typical example that represents two adjacent regions with same intensity value range, but have different distribution ratio of intensity value.
2.3. Identify the Range of Intensity Value
In order to examine the distribution ratio of intensity value, we estimated the intensity value range from liver, adjacent objects, and background areas that superimposed with pre-defined rectilinear structured grid. From these areas, the ranges of intensity value were established between minimum and maximum intensity value. Location searching is a process to find approximate locations of the liver on transverse image sequence. The results of location searching were x-y coordinates which were used to discover whether the liver exists or not, and to accurately segment the isolated left lobe from transverse image sequence.
2.4. Determine the Threshold from Distribution Ratio
The occupation percentage for each intensity value was identified from the sampled images of liver, adjacent objects, and background areas. These provided the distribution ratio of intensity value that consisted of liver, adjacent objects, and background areas. This percentile is used as threshold value to segment the liver area. The intensity value ratio which constitutes the liver area (68% for intensity value A, 21% for B, 11% for C) and adjacent region (10% for intensity value A, 19% for B, 71%
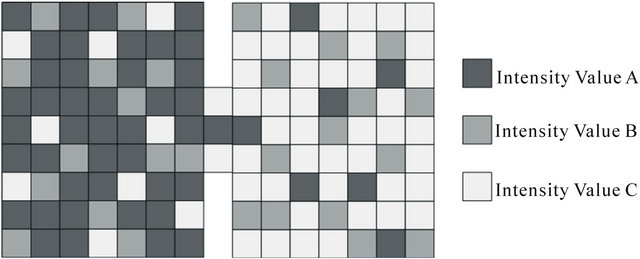
Figure 1. Typical example that represents two adjacent regions with same intensity value range but different distribution ratio of intensity value.
for C) was used to discriminate the interesting area. By using this threshold input image was transformed to binary image which containing the only liver region. In some situation, however, these binary images have noise parts which are unnecessary portion of segmented liver region. In these cases, flood-fill method was applied to remove the noise parts that usually appeared inside of segmented objects. As for the validation of liver segmentation, contour following method, which tracks the outline of segmented object, was applied to accurately delineate the liver boundary.
2.5. Hepatic Vessel Segmentation
Mathematical morphology provides an approach to the processing of digital images based on object shape. Appropriately used, mathematical morphological operations tend to simplify image data preserving their essential shape characteristics and eliminating irrelevancies. It performs in many tasks-preprocessing, segmentation using object shape, and object quantifications-better and more quickly than the standard approaches [7]. The hit-andmiss transformation is the mathematical morphological operator for finding local pattern of pixel, where local means the size of the structuring element. It is a variant of template matching that finds collections of pixels with certain shape property. The hit-and-miss operation is performed in much same way other morphological operators, by translating the origin of the structuring element to all points in the input image, and then comparing the structuring element with the underlying image pixels. If the foreground and background pixels in the structuring element exactly match foreground and background pixels in the input image, then the pixel underneath the origin of the structuring element is set to the foreground intensity value. If it doesn’t match, then that pixel is set to the background intensity value. However, we slightly modified the hit-and-miss operation that only focus the hit operation with specified structuring element to identify the hepatic vessels on the segmented liver image. The hepatic vessels were segmented with mathematical morphology transformation, which named as hit operation that is slightly modified version of hit-and-miss operation. Generally, hepatic vessels are originated roughly perpendicular to the scanning plane; this provide circular shape of hepatic vessels on the transverse image space. In this case circle type of structuring element is employed to extract the circular shape of vessels. However, in case that vessel runs horizontally across the scanning plane, we applied the stick type of structuring element to identify the quadrangle shape of hepatic vessels on the axial image space.
2.6. Hepatic Vein Identification with Refinement
The liver has a complex internal anatomy consisting of three different vessel system and the biliary ducts. The hepatic artery delivers blood with affluent oxygen, whereas portal vein carries nutrients, metabolic material and toxin needed for detoxication. Using the spatial information between artery and vein, middle hepatic vein is located; and the cutting angle can be decided focusing on the line, which passes the thickest part of artery that run horizontally across the scanning plane. If the donor and recipient have volume as much as they want, it is good to dissect along with the left line of middle hepatic vein after calculate the pre-incised liver volume; and if it is not enough, it is appropriate to dissect along with right line. For this work, it is necessary to show the location that each vessel passes inside the incised model of liver through three dimensions and to separate vein and artery in order to minimize the damage on other vessels. Therefore, we identified hepatic vein with region-growing approach. Region-growing algorithms take one or more pixels, called seeds, and grow the regions around them based upon a certain homogeneity criterion. If the adjoining pixels are similar to the seed, they are merged with them within a single region. The process continues until all the pixels in the image are assigned to one or more regions. In 3D image volume, the region growing approach can be extended to 3D Image space with voxel connectivity that is defined as the following: (a) 6-connectivity with joint faces, (b) 18-connectivity with joint edges and, (c) 26-connectivity with joint corners. As for the 3D region growing method [8-10], the homogeneous test was performed from the start voxel to the neighbor voxel using intensity value as acceptance criteria, hence hepatic vein were identified using region-growing algorithm. A seed voxel of the hepatic vein was selected and the region-growing algorithm automatically included neighboring voxel with specified intensity value starting from this seed point. After vein identification, we refined the hepatic vein to alleviate the effects of small capillary vessels and possible spurious noises using size-ordered features which were extracted from each identified vein. Each identified vein classified into their magnitude of scalar value as measuring 2D area using connected component labeling. The connected component labeling is commonly used to group the connected pixels on transverse image space. The labeling approach is to scan the image and assign labels to each pixel until the labels for the pixels no longer change [11,12]. Followed by connected component labeling, each labeled vein objects were ordered by 2D area measure.
3. RESULTS
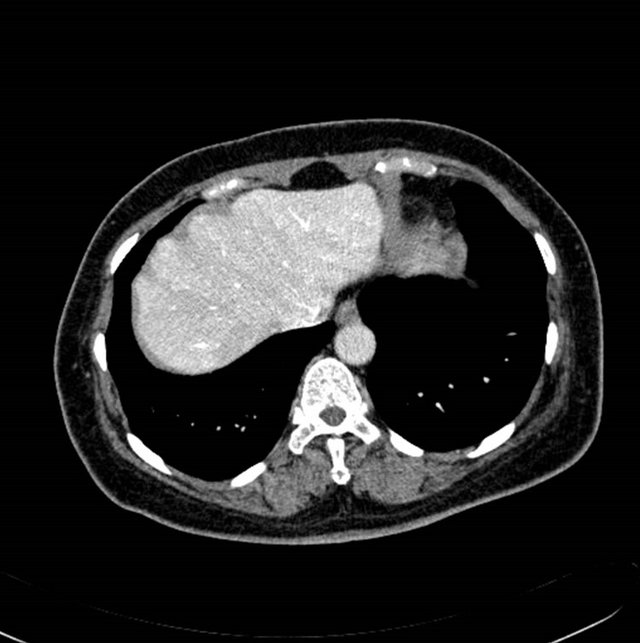
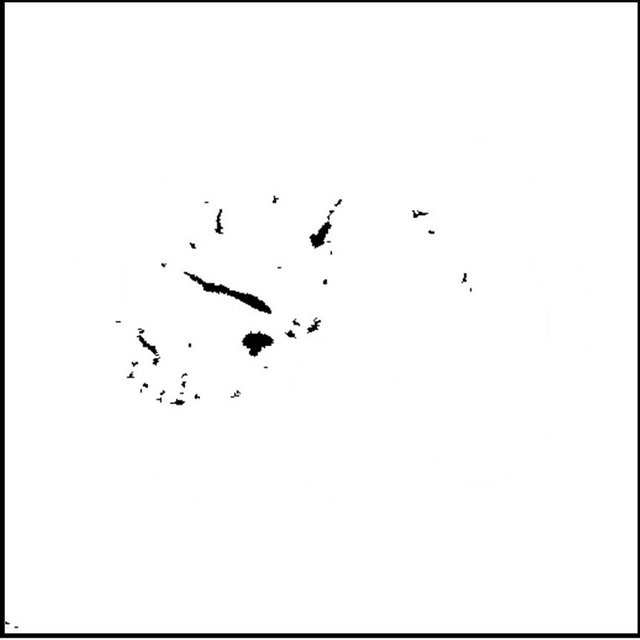
The contrast enhanced abdominal image sequence from Sensation 16 (Siemens, Germany) scanner was used to segment the liver regions and hepatic vessels. Figures 2(a) and (b) shows the raw contrast enhanced transverse
 (a)
(a)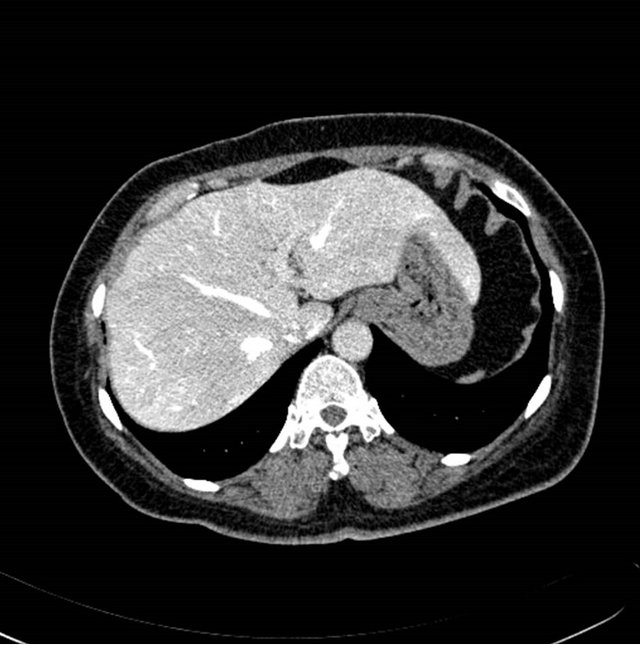 (b)
(b)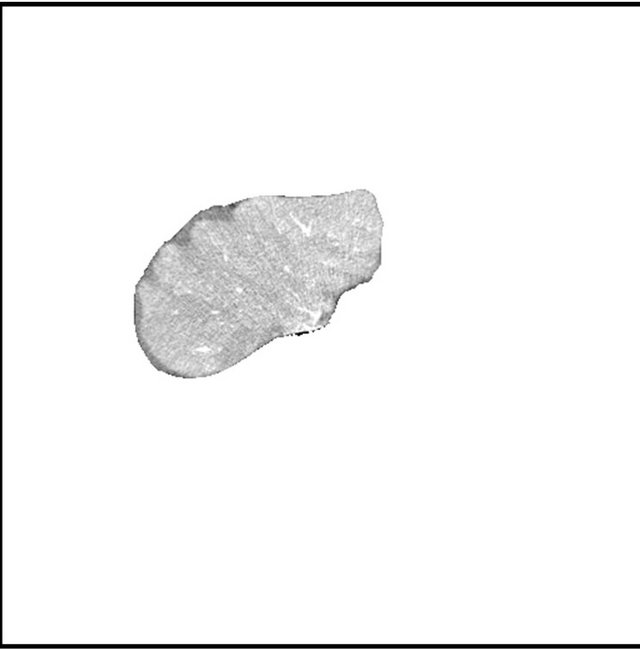 (c)
(c)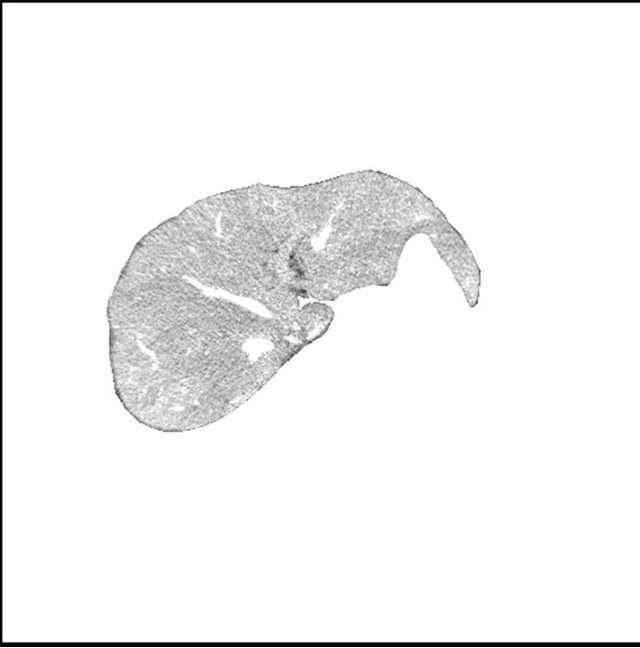 (d)
(d)
Figure 2. (a) (b) contrast enhanced raw liver image, (c) (d) segmented liver image using image (a) and (b), respectively.
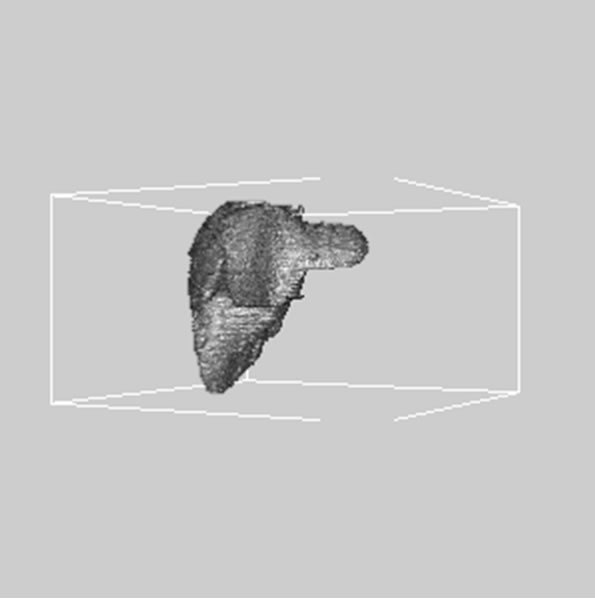
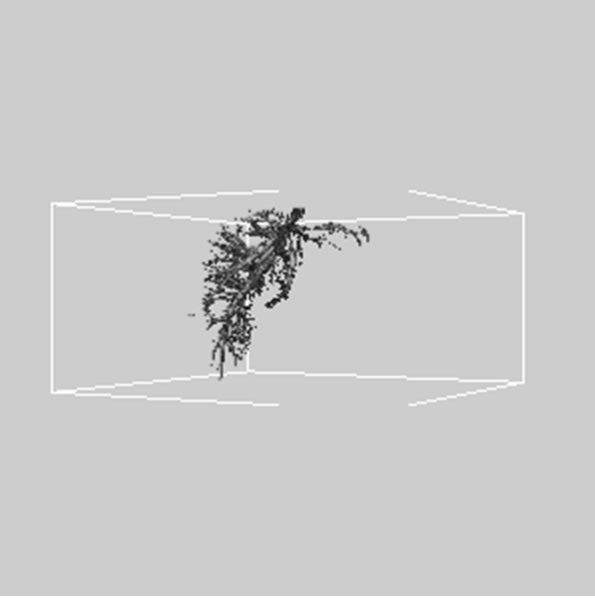
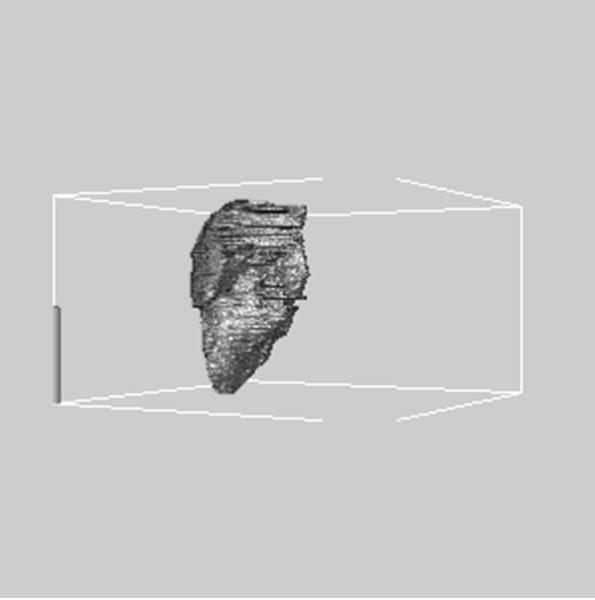
images, and Figures 2(c) and (d) shows the segmented liver regions using Figures 2(a) and (b), respectively. Comparing with previous efforts for liver segmentation [13-17], which does not provided the features to discriminate the noises and adjacent regions—these provided fine extraction results of only liver regions based on the distribution ratio of intensity value. Figures 3(a)-(c) shows the 3D reconstructed surface views of liver using segmented liver image volume that were projected at 330˚, 0˚, and 30˚, respectively. These 3D views were generated using volume ray-casting method [18] that is one of the volume rendering techniques as following. Rays are cast from each pixel of the image plane into the volume data. At locations along each ray, a sample value and a surface normal approximation are calculated using values of surrounding voxels. Figures 4(a) and (b) shows the segmented hepatic vessel images using Figures 2(c) and (d) that provided accurate delineation of hepatic vessels on the 2D image space. Figures 5(a)-(c) shows the 3D reconstructed surface views of hepatic vein using identified liver vein image volume with refinement that were projected at 330˚, 0˚, and 30˚, respectively. In addition, Figures 6(a)-(c) shows the 3D reconstructed surface views of right lobe using incised liver image volume including middle hepatic vein that were projected at 330˚, 0˚, and 30˚, respectively. Also, Figures 6(d)-(f) shows the 3D reconstructed surface views of left lobe using incised liver image volume along with middle hepatic vein that were projected at 330˚, 0˚, and 30˚, respectively. These 3D reconstructed views provided resection results of right lobe including right hepatic-vein (RHV) with middle hepatic vein (MHV) branches; and left lobe including left hepatic vein (LHV). Approximately calcu-
 (a)
(a)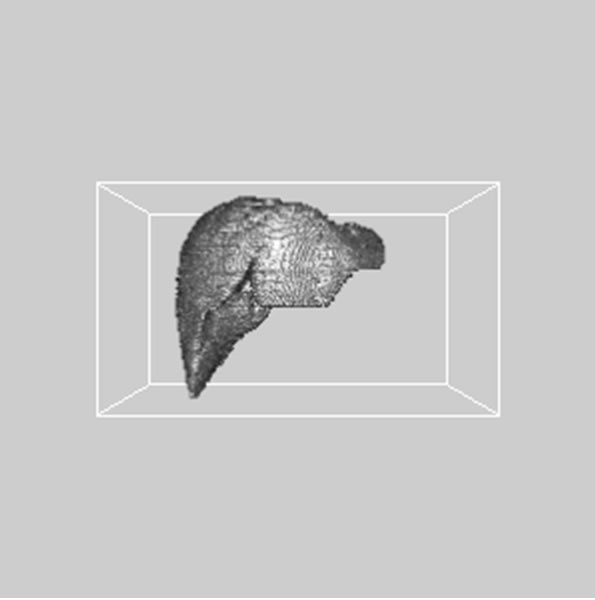 (b)
(b)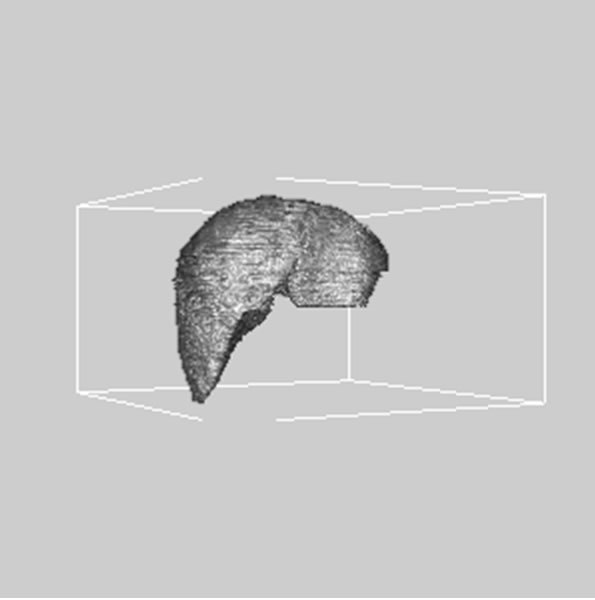 (c)
(c)
Figure 3. 3D reconstructed surface view of liver using segmented liver image stack that projected at (a) 330˚, (b) 0˚, and (c) 30˚, respectively.
 (a)
(a)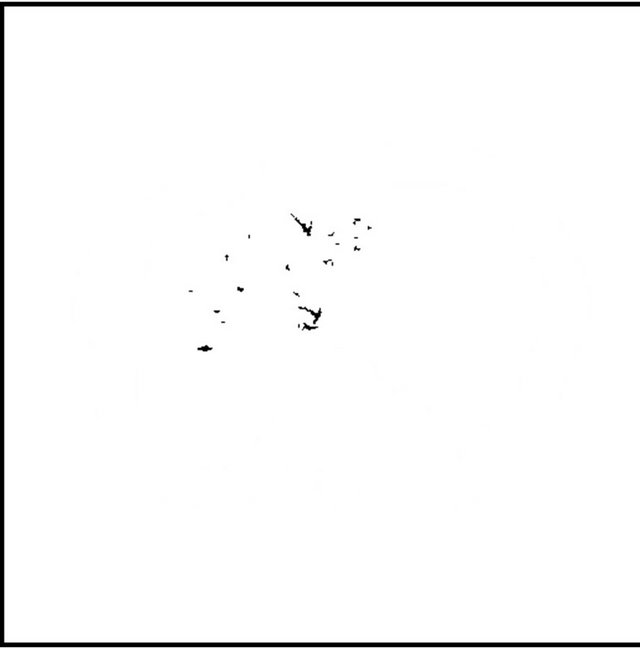 (b)
(b)
Figure 4. (a) (b) segmented hepatic vessel image using Figures 2(c) and (d), respectively.
 (a)
(a) (b)
(b)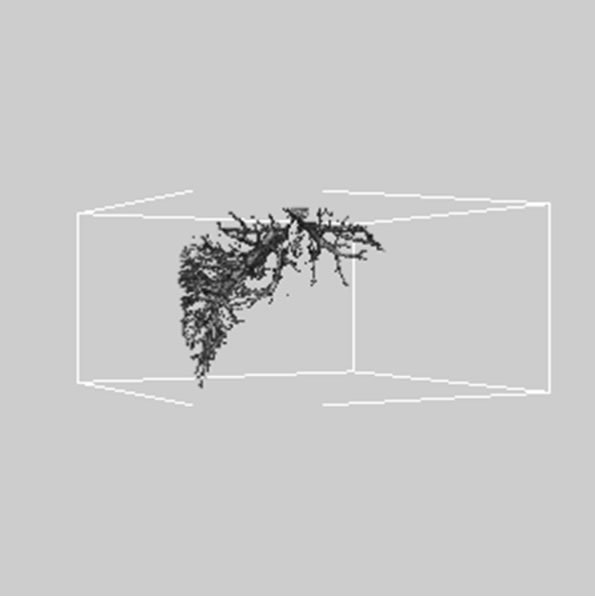 (c)
(c)
Figure 5. 3D reconstructed surface view of hepatic vein using segmented liver vessel image stack that projected at (a) 330˚, (b) 0˚, and (c) 30˚, respectively.
 (a)
(a)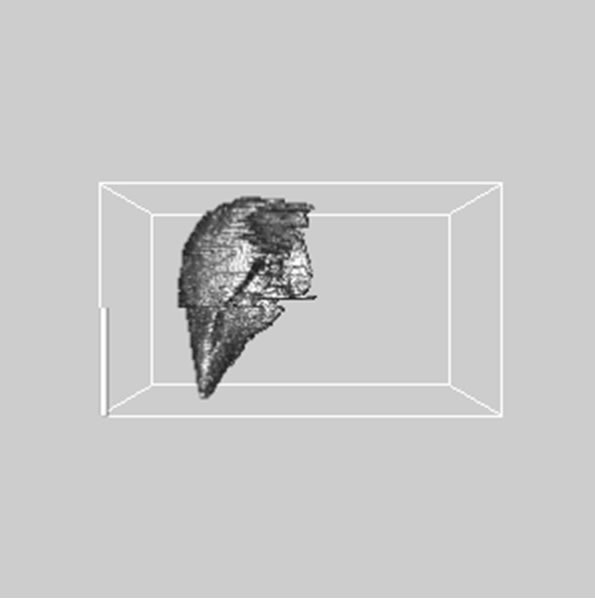 (b)
(b)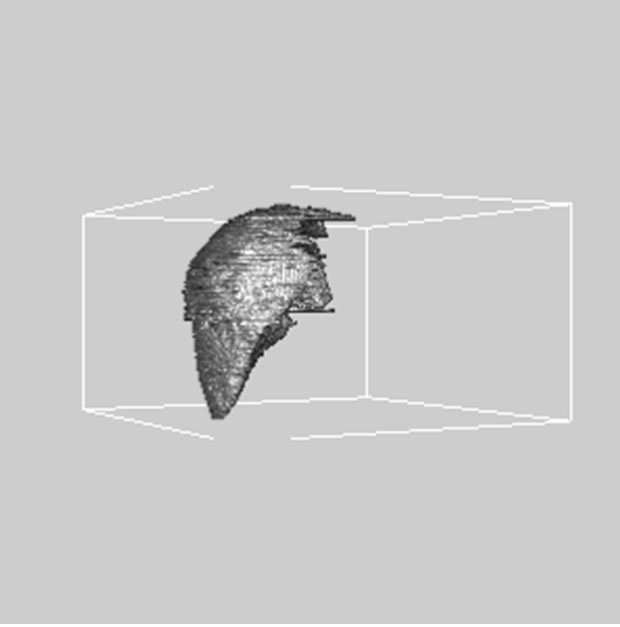 (c)
(c)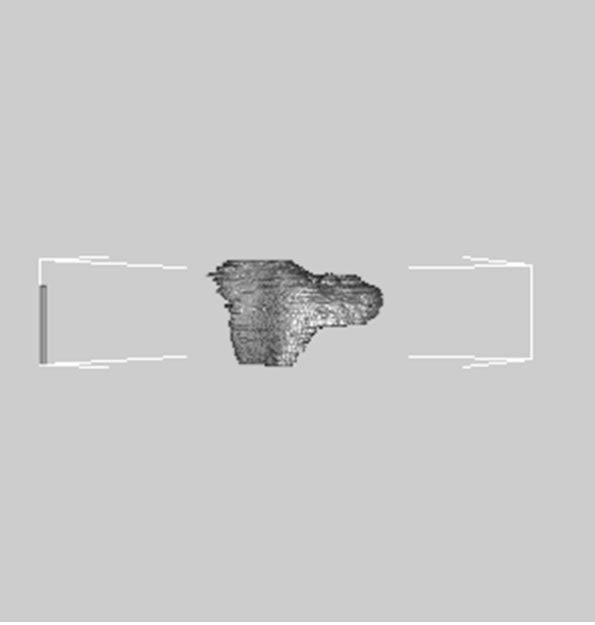 (d)
(d) (e)
(e)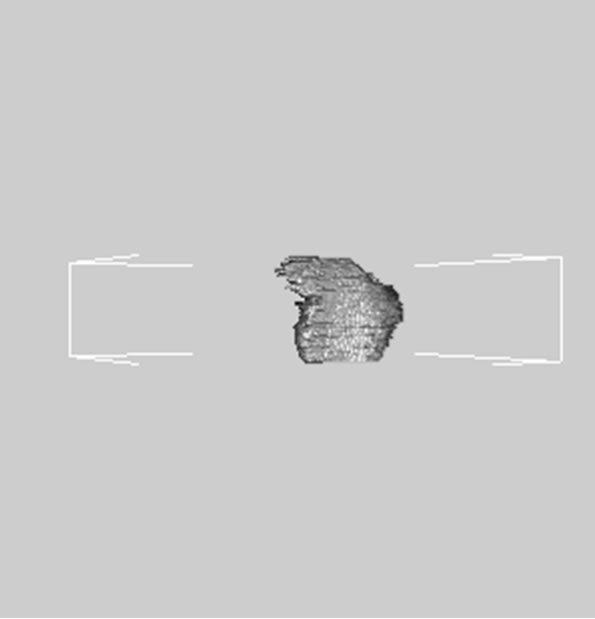 (f)
(f)
Figure 6. 3D reconstructed surface view of right lobe view using incised liver image stack that projected at (a) 330˚, (b) 0˚, (c) 30˚, surface view of left lobe view that projected at (a) 330˚, (b) 0˚, and (c) 30˚, respectively.
lated volume ratio of right to left lobe was 7:3, provided the acceptable resection result. Each volume was calculated as following equation. The volume  is defined as
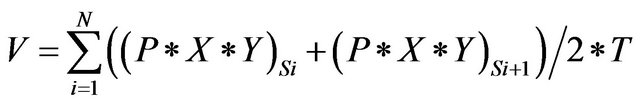
where  is the total number of 2D transverse images,
  is the pixel counts in current 2D transverse image,
  and
and  are the pixel spacing,
  is the ith sequence 2D transverse images, and
  is slice thickness of 2D transverse images.
 for image elements of objects where
  , and
, and  for image elements for the background where
 . These multiple region-growing seeds are used to extract the cerebrovascular structure on brain MRA data sets.
4. DISCUSSIONS AND CONCLUSIONS
The segmentation of specific regions is an essential first step for a variety of image-related application and visualization tasks. In particular, the computer algorithms for the delineation of anatomical structuresand other regions of interest are an important component in assisting and automating specific diagnostic, radiological, and surgical tasks. Blood vessel extraction methods vary depending on the imaging modality,application domain, method being automatic or semi-automatic, and other specific factors [19]. In this paper, we determined the threshold based on the distribution ratio of intensity value to segment the liver region. The hepatic vessels were extracted with mathematical morphology transformation called as hit operation, which is slightly modified version of hitand-miss operation. After that, we identified the hepatic vein using the preserved voxel connectivity feature between two consecutive transverse image sequences. In accordance with the branch structure of hepatic vascular, we dissected the liver into right robe (including RHV and MHV) and left lobe (including LHV). These are primary step to assess the accurate liver volume in determining donor suitability for LDLT. In conclusion, automated hepatic vessel segmentation scheme is recommended for liver surgical planning such as tumor resection and transplantation. In addition, these vessel extraction method combined with liver region segmentation technique could be applicable to extract tree-like organ structures such as carotid [6,20], renal, coronary artery, and airway path from various medical imaging modalities.
REFERENCES
- Heneghan, M.A. and O’Grady, J.G. (1999) Liver transplantation for malignant disease. Best Practice & Research Clinical Gastroenterology, 13, 575-591. doi:10.1053/bega.1999.0049
- Orloff, M., Bozorgzadeh, A., Lansing, K., Cullen, J., Ryan, C.K., Jain, A., et al. (2004) Post-operative liver dysfunction following donation of segmental liver grafts. American Journal of Transplantation, 4, 532.
- Pham, D.L., Xu, C. and Prince, J.L. (2000) Current method in medical image segmentation. Annual Review Biomedical Engineering, 2, 315-317. doi:10.1146/annurev.bioeng.2.1.315
- Haralick, R.M. and Shapiro, L.G. (1985) Image segmentation technique. Computer Vision Graphics and Image Processing, 29, 100-132. doi:10.1016/S0734-189X(85)90153-7
- Klingler, J.W., Vaughan, C.L., Fraker, T.D. and Andrews, L.T. (1988) Segmentation of echocardiographic images using mathematical morphology. IEEE Transactions on Biomedical Engineering, 35, 925-934. doi:10.1109/10.8672
- Kim, D.Y. and Park, J.W. (2005) Connectivity-based local adaptive thresholding for carotid artery segmentation using MRA images. Image and Vision Computing, 23, 1277-1287. doi:10.1016/j.imavis.2005.09.005
- Haralick, R.M., Stenberg, S.R. and Zhuang, X. (1987) Image analysis using mathematical morphology. IEEE Transactions on Pattern Analysis and Machine Intelligence, 9, 532-550. doi:10.1109/TPAMI.1987.4767941
- Adams, R. and Bischof, L. (1994) Seeded region growing. IEEE Transactions on Pattern Analysis and Machine Intelligence, 16, 641-647. doi:10.1109/34.295913
- Mehnert, A. and Jackway, P. (1997) An improved seeded region growing algorithm. Pattern Recognition Letter, 18, 1065-1071. doi:10.1016/S0167-8655(97)00131-1
- Wang, S.Y. and Higgins, W.E. (2003) Symmetric region growing. IEEE Transactions on Image Processing, 12, 1007-1015. doi:10.1109/TIP.2003.815258
- Chang, F., Chen, C.J. and Lu, C.J. (2004) A linear-time component-labeling algorithm using contour tracing technique. Computer Vision and Image Understanding, 93, 206-220. doi:10.1016/j.cviu.2003.09.002
- Hu, Q., Qian, G. and Nowinski, W.L. (2005) Fast connected-component labeling in three-dimensional binary images based on iterative recursion. Computer Vision and Image Understanding, 99, 414-434. doi:10.1016/j.cviu.2005.04.001
- Gao, L., Heath, D.G., Kuszyk, B.S. and Fishman, E.K. (1996) Automatic liver segmentation technique for threedimensional visualization of CT data. Radiology, 201, 359-364.
- Gao, L., Heath, D.G. and Fishman, E.K. (1998) Abdominal image segmentation using three-dimensional deformable models. Investigative Radiology, 33, 348-355. doi:10.1097/00004424-199806000-00006
- Chen, E.L., Chung, P.C., Chen, C.L., Tsai, H.M. and Chang, C.I. (1998) An automatic diagnostic system for CT liver image classification. IEEE Transactions on Biomedical Engineering, 45, 783-794. doi:10.1109/10.678613
- Farjo, L.A., Williams, D.M., Bland, P.H., Francis, I.R. and Meyer, C.R. (1992) Determination of liver volume from CT scans using histogram cluster analysis. Journal of Computer Assisted Tomography, 16, 674-683. doi:10.1097/00004728-199209000-00002
- Bae, K.T., Giger, M.L., Chen, C.T. and Kahn, C.E. (1993) Automatic segmentation of liver structure in CT images. Medical Physics, 20, 71-78. doi:10.1118/1.597064
- Levoy, M. (1988) Display of surfaces from volume data. IEEE Computer Graphics and Applications, 8, 29-37. doi:10.1109/38.511
- Kirbas, C. and Quek, F. (2004) A review of vessel extraction techniques and algorithms. ACM Computing Surveys, 36, 81-121. doi:10.1145/1031120.1031121
- Kim, D.Y. and Park, J.W. (2009) Multiple-phase segmentation approach for blood vessel extraction on cervical MRA image sequence. Magnetic Resonance Imaging, 27, 256-263. doi:10.1016/j.mri.2008.06.012