Journal of Geographic Information System
Vol. 5 No. 3 (2013) , Article ID: 33283 , 11 pages DOI:10.4236/jgis.2013.53027
A GIS-Based DSS for Management of Water Distribution Networks (Rafah City as Case Study)
Faculty of Engineering, Islamic University of Gaza, Gaza, Palestine
Email: ajamassi@iugaza.edu.ps, eng.rolaabeaid@hotmail.com
Copyright © 2013 Alaeddinne Eljamassi, Rola Ahmead Abeaid. This is an open access article distributed under the Creative Commons Attribution License, which permits unrestricted use, distribution, and reproduction in any medium, provided the original work is properly cited.
Received March 29, 2013; revised April 29, 2013; accepted May 29, 2013
Keywords: GIS; DSS; Management; Water Network
ABSTRACT
The water problem in Gaza Strip in Palestine is complicated; in reason of consumed water exceed the renewable water and high population density. The water situation is very important for mangers that are responsible of distribution, operation and maintenance of water networks to build an effective and complete comprehensive management of water distribution networks system. The main aim of this research is to study and evaluate the existing operation & maintenance system which is applied in Rafah area in Gaza strip which selected as pilot study area. The proposed system deals with a huge quantity of data which is needed to propose an effective system that can save time, cost, and minimize the mistakes in managing operation & maintenance systems for water distribution networks, Geographic Information System Technology is selected as one of tool decision which deals with such quantity of data and can be linked with other software which can achieve the aim of this study. The research depended on the use of Arc GIS 9.3 datasets and Water CAD/WaterGEMS hydraulic modeling based on Decision Support System for proposed water distribution plan systems, proposed operation & maintenance systems, and use pipe condition index to assist operation & maintenance manager to take the best decision which saving time, effort, and cost.
1. Introduction
Rafah Governorate is located at the southern part of the Gaza Strip and its area is about 64 Km2 with a population density of 6 persons per 1 m2 in the built up area. The population of Rafah Governorate reached 174,498 inhabitants according to the latest figure of the Palestinian Central Bureau of Statistics [1]. Rafah area is considered as part of the desert since the rainfall intensity hardly reaches 200 mm/year. Rafah Governorate has 28 wells to serve the domestic water demands in the area. Eight of them are belongs to Rafah Municipality, one belongs to the UNRWA, and the rest two wells are belong to the eastern village Shoka and Al Nasser Municipalities. The agricultural land area in Rafah is about 33 km2, which represents more than 50% of the Rafah Governorate area.
This research, will concern Rafah municipality water problem. The production of rafah wells is 8.2 Million Cubic Meter in a Year (MCM) and the consumption is 3.7 MCM which means that the percentage of efficiency is 45%. This low efficiency is reflecting three things in this area; the first thing is referring to the efficiency of the water pipe network system itself within the domestic area, and the other reason referring to the Unaccounted For Water (UFW) which seen in the illegal connections from the municipal wells towards the agricultural area of Rafah without any monitoring or control, while the third reason is reflecting the un-stable situation in Rafah.
The objectives of this research can summarize as follows:
1) Study the existing water distribution networks for Rafah area, and existing O&M systems which is used by the municipality of Rafah to manage water pipe networks;
2) Prepare database for water networks parts and facilities to be used as a guide for manage O&M systems ofRafah area depend on GIS & hydraulic modeling software;
3) Propose distribution plan for operation water networks pipes in Rafah area;
4) Proposed procedure for O&M using GIS & DSS and illustrate the methods for using data in decision making.
2. Existing Water Distribution System (WDS) for Rafah Municipality
To clarify the existing water distribution system in Rafah municipality area, interview is made with head, manger, and water networks operators to clarify WDS and describe O&M system which the municipality depend on for management water networks.
All the data in the following paragraphs which is clarified the existing WDS & the existing operation & maintenance (O&M) is related to interview with head, manger, and water networks operators.
The water wells abstraction is increasing while the network efficiency is decreasing in the past 4 years. The reason behind that can be referred to:
• The old pipe network system;
• The illegal connections without any monitoring or control.
The water facilities in Rafah is composed of main transmission pipes, distribution pipelines, ground water storage tanks, wells, booster pump stations and control valves. All these components comprise the water distribution system in Rafah.
The supply scheme in Rafah Governorate is an intermittent water distribution system and complicated which is prevalent in Gaza Strip. This is due to the insufficient water infrastructure and water sources. Intermittent water distribution systems are water networks that operate at specific time intervals i.e. not continuous. This system is controlled by manual operated valves located at the main feeders in the water network.
As discussed before that the groundwater is the onlywater resources in the area. The Asbestos pipes are still exists in the area with a total length of about 838 m length, while the major type in the area is the Un-plasticized Poly Vinyl Chloride (UPVC), Medium Density Polyethylene (PE) and Steel pipes which forms 60%, 15% and 24% respectively of the whole lengths of the water pipe in Rafah.
Water supply in Rafah is an intermittent water supply and that due to insufficient water quantity in the area. The operation system is controlled manually by opening/ closing valves in the major trunk lines. The water distribution cycle is completed every 48 hour. Rafah area has been divided into 13 zones as shown in Figure 1.
Methods for distributions water networks depend on two ways as the following:
1) Direct Supply from Wells (DSW);
2) Water Tank Supply (WTS).
3. Definitions of Decision Support Systems (DSS)
A DSS is a computer-based, interactive information system, i.e. it inherits the qualities about information systems in general. The term interactive implies that there is an
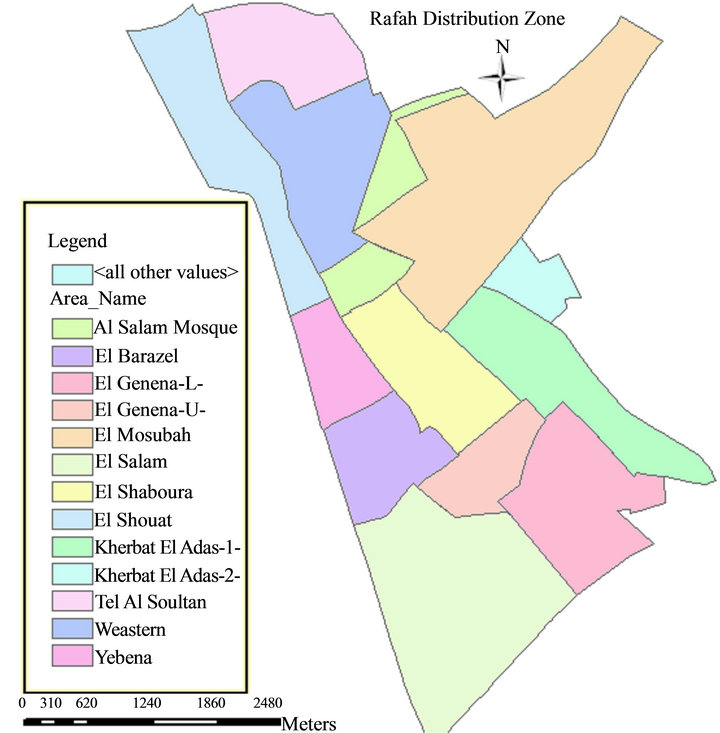
Figure 1. Rafah distribution zone.
exchange between the system and the user. A DSS primarily supports managerial activities at various levels. The purpose of a DSS is focused on improving the effectiveness of the decision-making process, rather than its efficiency. The effectiveness of decision-making concerns timeliness, accuracy, and quality, while efficiency is the cost of making the decision, e.g., cost of the decision-makers working hours [2-7].
DSS provides support for decision-makers when they deal with semi-structured and unstructured problems. Support is provided in all four phases of the decisionmaking process, i.e. intelligence, design, choice, and implementation. Thus, focus can be both on decision making as well as implementation of decisions. A DSS may provide support for both interdependent and multiple independent decisions [3,5-7].
Within the field of GIS there are many who consider GIS software to provide decision support. Indeed as Maguire points out, some authors have argued that a GIS is a DSS [8]. A substantial number of GIS based applications are described as being DSS. A GIS conference was entitled “DSS 2000”. This view of GIS as a DSS is not entirely without support in the existing definitions of DSS. Alter proposed an influential framework for DSS which includes data driven DSSs that do not have a substantial model component [2]. Standard GIS software could be regarded as an analysis information system in Alter’s framework, the critical component of such a system being the database component.
However, in many cases, the description of these GIS applications as being DSS is not based on reference to the DSS literature. This may be a reflection of the trend identified for the use of any computer system, by people who make decisions, to be defined as DSS [9].
4. Research Methodology
1) The first stage include literature review which based on the primary data collected through reading and searching from related articles, books, web site, and others.
2) The second stage includes selecting Rafah as a study area, the reason for selecting Rafah is due to the following:
• Numbers of request for materials to be used for operation and maintenance for networks is high.
• By observation of maintenance materials report it is noted that the same pipe line fails more than once.
• There is no specific program for distribution system, operation, maintenance for water networks in Rafah area.
• Lack of knowledge of water networks information such as pipes types which feed the zone distribution area, control valves.
• There is lack of base data for water networks information for Rafah area.
3) The third stage includes interview with relevant professionals in Rafah water networks department such as department manager, networks engineer, and operators by face to face interview and site visit for Rafah area. The objectives of interviews are the following:
• Collecting needed data about sources of water and existing water distribution system for Rafah area;
• Collection data about existing O&M system used and the existing staff in Rafah area;
• Collection data about procedures, tools which the staff used it to manage and solve the O&M problems;
The goal of site visit for Rafah area:
• Identify of distribution zones for Rafah area;
• Knowing the location of control valves and the steps for O&M system for water networks;
4) The four stages select the proposed systems to be included in the DSS system were ArcView GIS datasets and Water CAD/WaterGEMS. This stage includes the following:
a) Prepare shape file data such as:
◦ Pipe, Street, Contour line, type of features stored in this feature class is line features.
◦ Well, Valve, Water meter, Elevation, type of features stored in this feature class is point features.
◦ Tank, Manhole, Land use, Water distribution zone, Customer zone distribution, Building zone area, type of features stored in this feature class is polygon features.
b) Building a network model, particularly if a large number of pipes are involved, is a complex process. The following categories of information are needed to construct a hydraulic model:
◆ Characteristics of the pipe network components, the required pipe network component information includes the following:
1. Pipes (length, diameter, roughness factor);
2. Pumps (pump curve);
3. Valves (settings); and
4. Tanks (cross section information, minimum and maximum water levels).
5. The Distribution factors of average water consumption during Day and Night as show in Table 1.
6. The water demand that will be used in our study is 0.0029 m3/h for one caption (70 L/C/D).
7. The water demand for one building is 0.0145 m3/h (=0.0029*5).
8. In this study one connection is used for each building, and the distribution of connection is one connection each ten meter.
9. The existing distribution pipelines are considered for this system scenarios.
10. The hydraulic analyses characteristics are summarized as follow: Analyses Extended period simulation, Friction method, Hazen-William formula, Accuracy: 0.001, Trials: 40, Starting time: 6.00 AM, Duration: 48 hours, Hydraulic time step: 1 hour.
◆ Water use (demands) assigned to nodes;
◆ Topographic information (elevations assigned to nodes);
◆ Control information that describes how the system is operated (e.g., mode of pump operation);
◆ In order to apply model, it is necessary to define a set of rules that tells the model how the water system operates. This may be as simple as specifying that a particular pump operates from 6:00 AM to 12:00 AM each day. Alternatively, it may be a set of complex “logical controls” in which operations such as pump off/on, pump speed, or valve status are controlled using Boolean operators (including if-then-else logic) for factors such as tank water levels, node pressures, system demand, and time of day. For water systems that operate automatically based on a set of rules, determination of these rules are quite straightforward. For manual systems, the rules must be determined by interviews with system operators.
◆ Solution parameters (e.g., time steps, tolerances as required by the solution techniques). Figure 2 Show water networks integrated with GIS data.
c) Run the hydraulic model.
d) Study the existing system of O&M for Rafa area.
5) The five stages include use GIS & hydraulic modeling based on DSS for proposed O&M systems for Rafah area. This stage includes the following:
• Managing water networks for Rafah Municipality by using GIS and hydraulic model software;
• Propose water distribution plane for networks;
• Proposed pipe line condition index for maintenance water networks;
6) The final stage of this study is to define the conclusion and recommendation with reference to the objective, subsequent to the analysis by the area study and interviews.
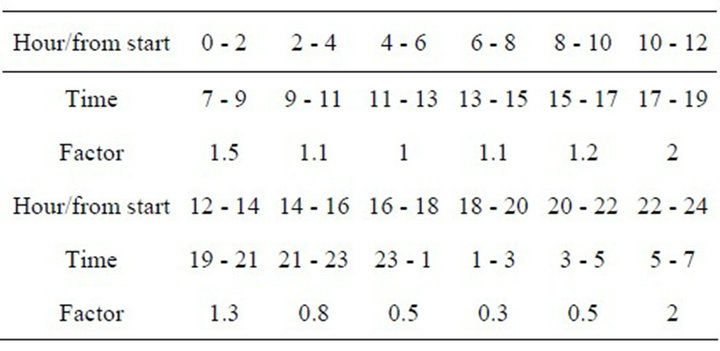
Table 1. Distribution factors of average water consumption during day and night.
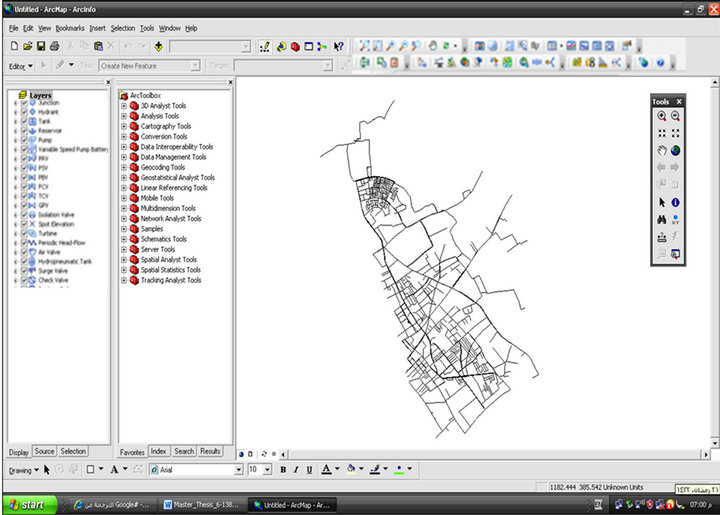
Figure 2. Networks integrated with GIS data.
5. Proposed Distribution Plan for Operating Water Networks
Proposed distribution plane for water networks can be divided into the following systems:
1) Direct Distribution Plan from Wells;
2) Direct Distribution Plan from Water Tank.
That done according to know the location of zones and control valve and need of water for each zone. The goal of proposed distribution is to help the water department in Rafah to feed all zone by equal quantity of water for all customer 70 L/C/D.
5.1. Direct Distribution Plan from Wells
This section will deal with the proposed areas that will be supplied directly from wells, these areas are: (Tal Elsultan area, Mawasi area...). A detail planning on supplying nodes, time interval, and duration of supply is discussed for one of these zones Tal Elsultan Zone.
This area is one of the most populated areas in Rafah, the population reaching about 31,500 inhabitants. The total supplied volume will be 2200 m3/d and hence the quota per person will be about 70 L/C/D. The water supply will be every day instead of day after day. Figures 3 and 4 show Water distribution networks & junction’s pressure data during water consumption respectively for Tal Elsultan Zone.
These areas are representing zone 11, 12A, 12B and 6 as shown in Table 2 which summarize data that will be followed in designing the water distribution system in these zones.
The water source for these zones will be from well P/145. The average abstraction rate for this well is 101 m3/hr and operate 24 hour a day as in year 2006. This plan the well will operate for 24 hour a day. 20 hours for supplying the designated zones and 4 hours for supplying the main water tank. This plan will take 30% losses from the water source to reach its target zone and that because the long distance between the water source and the distribution zones.
This proposal will divide the previously identified zones to parts as follows:
Part 1: Include partially zone 11 and partially zone 6. The estimated population in this area is about 6000 inhabitants. The needed water volume is about 550 m3/d and to achieve the supply criteria 6 hours supply every day for this zone will be satisfying.
Part 2: Include partially zone 11 and zone 12B. The
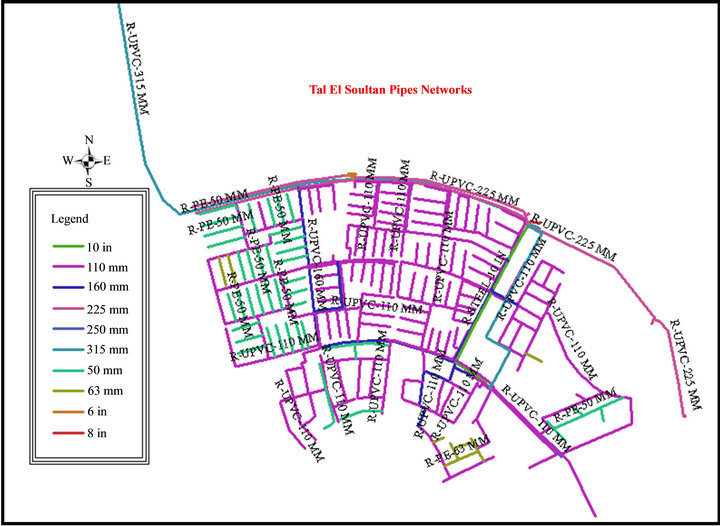
Figure 3. Water distribution networks for Talsultan zone.
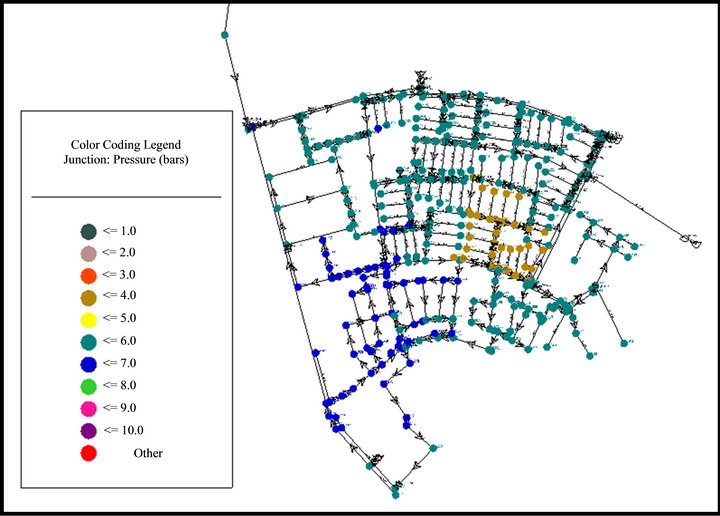
Figure 4. Output result for junction’s pressure data during water consumption for Tal Elsultan Zone.
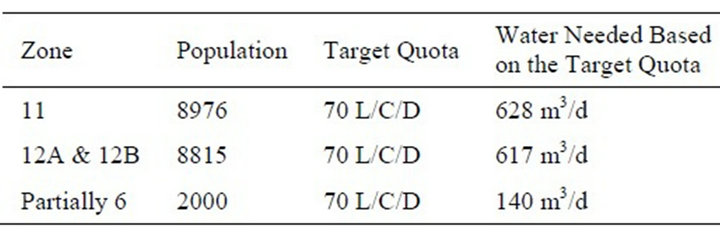
Table 2. Zone 11, 12A and 12B summary data.
estimated population in this area is about 6000 inhabitants. The needed water volume is about 550 m3/d and to achieve the supply criteria 6 hours supply every day for this zone will be satisfying.
Part 3: Include partially zone 6 and zone 12A. The estimated population in this area is about 8000 inhabitants. The needed water volume is about 730 m3/d. and to achieve the supply criteria 8 hours supply every day for this zone will be satisfying.
The above 3 parts will cover 20 hours a day, the rest of the day will supply the major water tank by an amount of 400 m3 through the 12” steel pipe.
5.2. Direct Distribution Plan from Water Tank
The main water tank capacity is 6000 m3. This water tank will feed from wells P/144A, P/148, P/15, P/124 for 20 hours a day and keeping 4 hours as backup time for any maintenance process, well P/153 will feeding the water tank for 16 hour a day, while well P/145 will feeding the water tank for 4 hours every day. Table 3 shows the water quantity delivered to the water tank area.
This amount of water will be distributed to about 100,000 inhabitants, taking into account average water network system efficiency as 70% from the water tanks to the target area (7305 m3/d) which will led us to delivering 70 L/C/D as quota per person.
6. Proposed Procedure for O&M Using GIS & DSS
In order to manage maintenance and operation systems for managing water pipe networks, pipe condition index proposed as a methods for manage of water networks.
The methods illustrate the effect of pipe condition, assumes the pipeline index from one to ten. The pipeline index means the condition of the pipeline, which number one represents the requirement for immediate repair and number ten expresses the new pipe. This number depends on failure history of pipes, types of pipes construction date, and diameters which refer the quantity and pressures which the pipe can bears it.
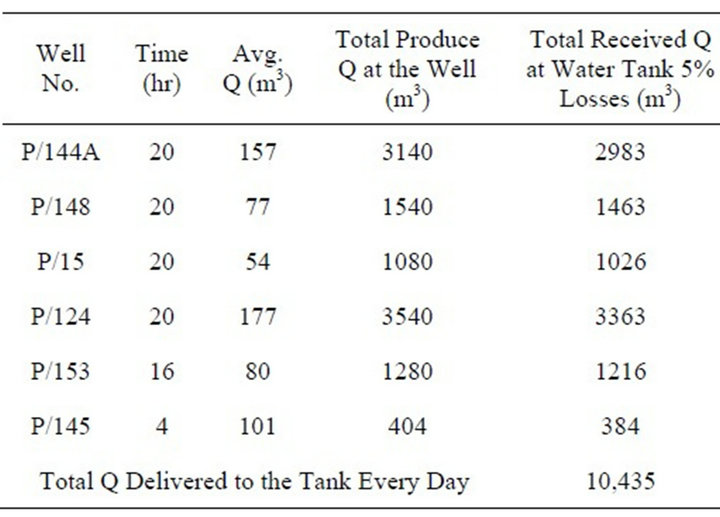
Table 3. Delivered water quantities to the tank area.
For example Asbestos pipe should have number one which means must be replacement due to risk pollution cause by Asbestos material and effect on water which located in pipes. Pipe with low diameters and carry amount of water and pressure over loaded and has more than one failure also pipe condition index for it is one.
Also by running the hydraulic model we can know the pipes which have pressure problem and these pipes can select by using GIS queries tools and have the pipe index numbers which mean there is decision should be done for it to solve this problem. another example can be mention by historical data of installation data of pipes and number of failure which is also can be indicate that is pipes needed to repair, replace or don’t do any action for it according to pipe index numbers.
Steps for integrated proposed method pipe condition index:
A) Prepare GIS shape file and attribute table for available water networks functions data and prepared hydraulic modeling data;
B) Prepare data of water networks pipes failures using GIS attribute table or Excel sheet, the same table can prepare for other failures of others function in water networks such as valve or pumps;
C) Before start numbering the water networks pipes from one to ten according to failure or construction history, water manager should evaluate water networks which the municipality own.
The evaluation steps can be divided into the following steps:
1) Collection data about water networks which the municipality own.
a) Identification of the attribute and spatial data necessary to integrated water networks management at the municipality;
b) Maximum recovery of the area’s existing data, whose format, accuracy, worth and scope is valuable to the process;
c) Identification of the remaining data needed and planning for its collection;
d) Collection of remaining data (in the field or from original construction plans. Municipality approach, combined with the re-utilizations of the area existing data;
e) Collected information is added to the Municipality’s water networks database and GIS tools, types of data as the following Table 4 and Figure 5.
2) Evaluate the condition of water network.
In this step, a careful, field-verified gives a precise condition assessment of water network. This step includes the assessment is field-verified for accuracy and system parameters are adjusted for the results of field verification.
The following information describing the condition of water network, which should be added to the Municipality water networks database:
• Physical Integrity of the networks (Break History, Materials, & Water Loss);
• Functional Integrity of the networks (Hydraulic capacity, & Water Quality);
• Related network (Water Meter, & Valves);
• Socioeconomic impact (Claims, Duration of Repairs, & Traffic).
A final condition assessment indicates the improvement status of water network segment: Imperative (pipe condition index from 1 to 3), Desirable (pipe condition index from 4 to 6), Segment to be Monitored (pipe condition index from 7 to 8), or No Improvement Necessary (pipe condition index from 9 to 10). Figure 6 summa-
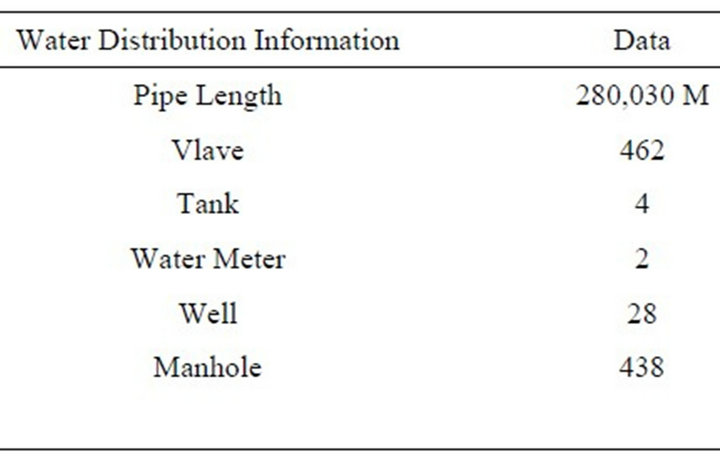
Table 4. Rafah water networks data.
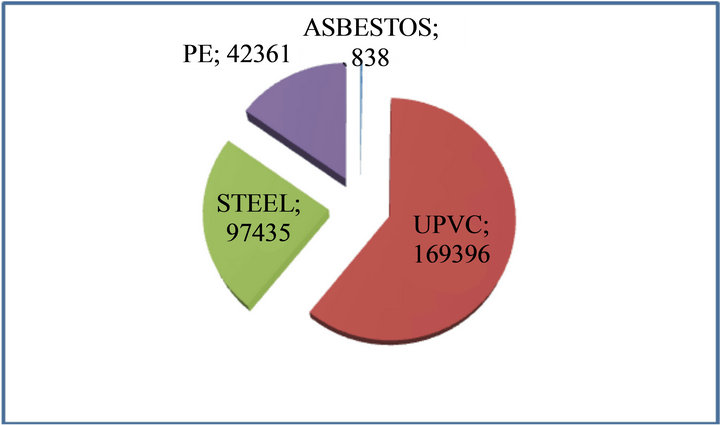
Figure 5. Material length and types.
rizes the condition of the Rafah Municipality water networks:
3) Clarify the remaining service for water networks needed upgrade.
4) Clarify and study available proposed solution for problem in water networks.
5) Table 5 summarizes the condition index for all Rafah zones.
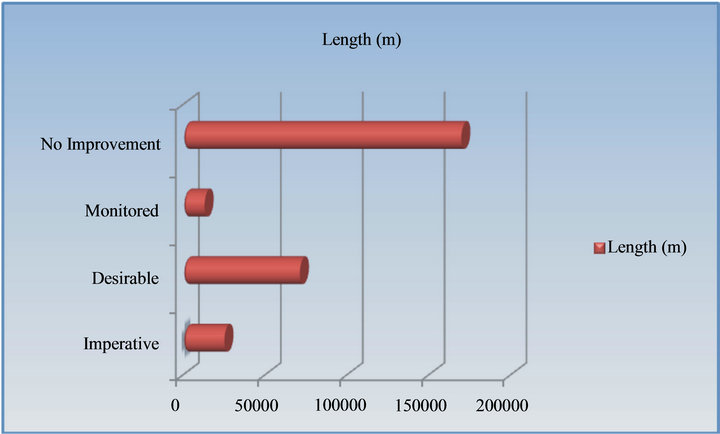
Figure 6. Network conditions at the Rafah city.
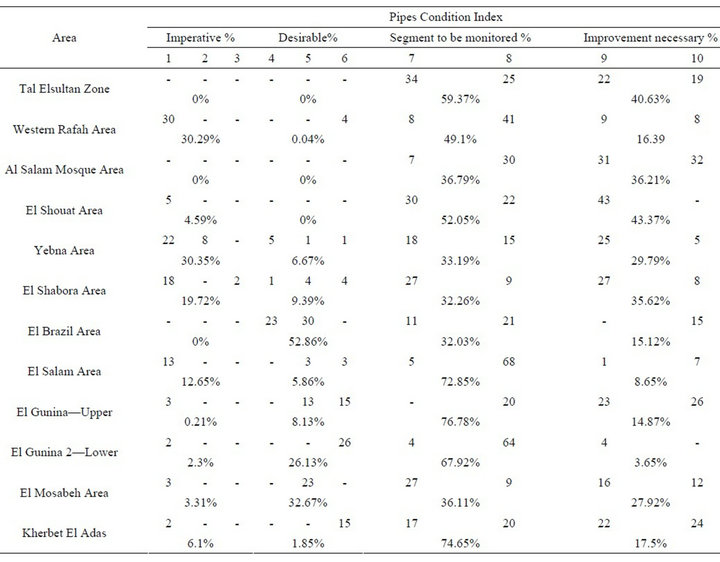
Table 5. Ratio of Rafah zone pipes condition index.
7. Create Water GEMS Model by Using of ArcMap
Using GIS is important to apply the decision. The following is a practical application for pipe lines replacement decision. The first step is to create WaterGEMS model inside ArcMap. The benefit for this step is to get hydraulic model data such as pipes pressure &velocity and use this data as a tool for pipe condition index method.
Steps for Create WaterGEMS Model Inside ArcMap
In the ArcMap Interface, importwtg filein the WaterGEMS: Use personal geodatabase, or browse to an existing geo-database.
a) Selection of the pipe lines to be replaced A certain criteria should be established by the decision makers to select replacement pipes. The selection depends on installation date of pipes, historical data about number of repair and failure, and quantity of water which this pipe feed the zones by it. Figure 7 illustrate a query of the pipe line which is needed replacement such as Asbestos pipe line (Asbestos pipes due to harmful effect on customers.
b) Pressure calibration In this decision maker get data by GIS map, attribute table data, hydraulic modeling output which clarify the pipe line pressure data. GIS by querying tools can clarify location and properties of pipes. Figure 8 clarify this scenario by selection pipe types UPVC with diameter 110 mm and pressure less than 2.0 bars. The decision maker will be provided necessary information to decide the proper decision such as changing valve statues, replace some pipe lines, or installing a poster pump.
• 8. Conclusions
• Finally we can conclude that there is no clear O&M system for the water distribution system in Rafah, which insures the needed for establishing an effective O&M system for Rafah area.
• The proposed O&M system depends on the use of the integration between GIS and hydraulic modeling based on DSS for management O&M water networks to take the best decision at the needed time for all daily works.
• It is clear at this study using GIS and DSS in the proposed O&M system will assist the water networks department in Rafah by:
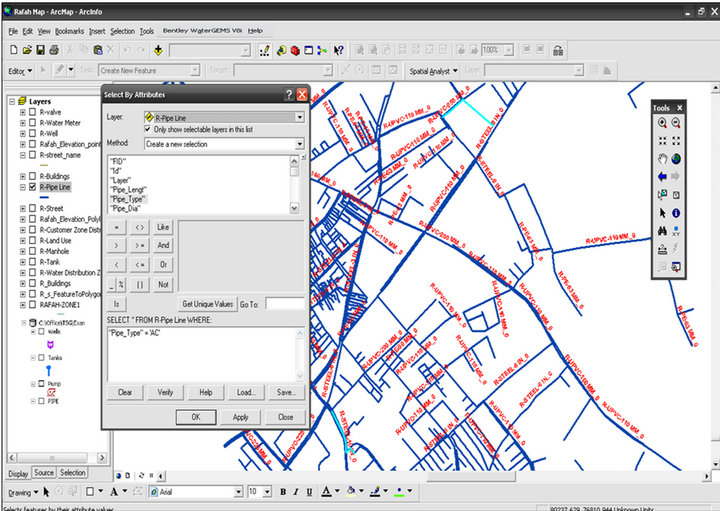
Figure 7. Use querying tools for selecting pipes which needed to be replaced.
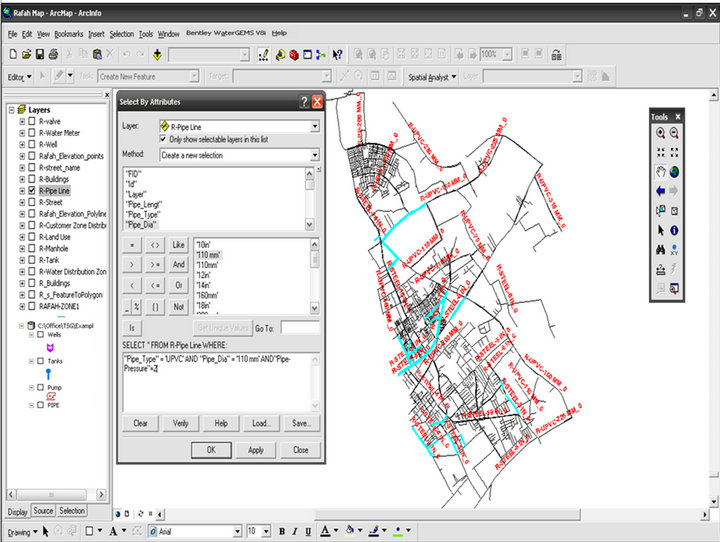
Figure 8. Use GIS querying tools for selecting pipe types UPVC with diameter 110 mm and pressure less than 2.0 bars.
◦ Providing database for water networks in Rafah area include shape files, AutoCAD file, and hydraulic modeling data which can minimize the human mistake;
◦ Help the water department in Rafah to feed all zone by equal quantity of water for all customers by the proposal water distribution systems;
◦ Clarify the valves which control water networks in Rafah area;
◦ Provide a clear program for distribution water networks for all zones;
◦ Clarify water networks pipes and diameters.
• Use GIS and hydraulic modeling (ArcView map and waterGEMS) provide dealing with all types of data such as geographical data, non-geographical data, fixed, and variable data. It also integrates the database with accurate digital maps, integrating the data for each component with AutoCAD maps, remote, control, and monitoring for all water networks facility, assist all department teams for exchanging data needed to O&M by an effective communication tool which give accurate data, and finally assist the manger to give the best decision with saving the time, cost, and mistake in the field.
• The goal of hydraulic model is to prepare the database for operation department in Rafah area help us to manage water networks and prepare a good program for distribution zone, also knowing the location of control valves and zone which controlled by it, away for controlling water networks, knowing the pipes which have a pressure problem, and knowing the affect done in water networks systems such as pressures if there any change done in networks.
• Proposed pipe condition index help the water department in Rafah area for assessing, current and future risk levels of a particular pipe and groups of pipes, investigating scenarios for risk reduction and cost efficiency of pipeline failure mitigation options, thus allowing for prioritization between pipeline replacement or pipeline management work packages, exploration of pipe asset and failure data, reporting capabilities allowing Water Utilities to quickly collect data for reports.
• Also by knowing of pipe condition index, it is possible to know if this zone pipe can bear the quantity and pressure or not.
• The proposed system saving time, effort, and cost by guarantee an immediate corrective action for the whole defects of the water distribution system component.
9. Recommendation
The study clarifies the benefit for use GIS and hydraulic modeling based DSS for propped O&M system to manage water pipes networks but is worth to recommend the following recommendations, which is very important to performed the goal of this study and promote the sustainability of the proposed O&M system in the Gaza Strip:
1) Applying GIS in O&M system for water network in all Gaza strip areas due to advantages of it for raising efficiency and improvement of management water network.
2) Rafah Municipality should prepare its staff to use (GIS Integrate with hydraulic modeling) by selecting some of the expected staff to attend training course in applying GIS and hydraulic modeling in the field of water service.
3) The proposed O&M system to contribute in water conservation, it should form apart of effective total management system in the municipality.
Any amendment or change in the data to relate to water networks facility must be entered on the database for water network where they help the manger to manage water networks and have a good decision about O&M for water network.
REFERENCES
- PCBS, “Palestine in Figures 2005,” Palestinian Central Bureau of Statistics, Ramallah, 2006.
- S. L. Alter, “Decision Support Systems: Current Practice and Continuing Challenge,” Addison-Wesley, Reading, 1980.
- Bidgoli, “Dialog Management in DSS Environment,” Western DSI, Monterey, 1989.
- P. G. W. Keen and M. S. Scott-Morton, “Decision Support Systems: An Organizational Perspective,” AddisonWesley, Reading, 1978.
- E. G. Mallach, “Understanding Decision Support Systems and Expert Systems,” Irwin, Pennsylvania, 1994, pp. 428- 435.
- G. M. Marakas, “Decision Support Systems in the Twentyfirst Century,” Prentice Hall, Englewood Cliffs, 1999.
- E. Turban, J. E. Aronson, T. P. Liang and R. Sharda, “Decision Support and Business Intelligence Systems,” Prentice Hall, Upper Saddle River, 2007.
- D. J. Maguire, “An Overview and Definition of GIS,” In: D. J. Maguire, M. F. Goodchild and D. W. Rhind, Eds., Geographical Information Systems, Longman, Harlow, 1991, pp. 9-20.
- P. Keen, “Decision Support Systems: The Next Decade,” In: E. McLean and H. G. Sol, Eds., Decision Support Systems: A Decade in Persepective, Vol. 3, North Holland, 1986, pp. 253-265.