Natural Science
Vol.5 No.4(2013), Article ID:30270,12 pages DOI:10.4236/ns.2013.54065
Spectrophotometric determination of some calcium channel blockers using Sulfochlorophenol-S, Bromopyrogallol red, Eriochromecyanine-R and Pyrocatechoil violet
![]()
1Analytical Chemistry Department, Faculty of Pharmacy, Minia University, Minia, Egypt; *Corresponding Author: safaafathy@ymail.com
2Pharmaceutical Chemistry Department, Faculty of Pharmacy, King Abdulaziz University, Jeddah, KSA
3Analytical Chemistry Department, Faculty of Science, Minia University, Minia, Egypt
4Pharmaceutical Chemistry Department, Faculty of Pharmacy, Jazan University, Jazan, KSA
Copyright © 2013 Mahmoud A. Omar et al. This is an open access article distributed under the Creative Commons Attribution License, which permits unrestricted use, distribution, and reproduction in any medium, provided the original work is properly cited.
Received 15 August 2012; revised 15 September 2012; accepted 2 October 2012
Keywords: Spectrophotometry; Amlodipine Besylate; Diltiazem Hydrochloride; Verapamil Hydrochloride; Sulfochlorophenol-S; Bromopyrogallol Red; Eriochromecyanine-R; Pyrocatechol Violet
ABSTRACT
Four simple, sensitive and accurate spectrophotometric methods have been developed for the determination of some calcium channel blockers: Amlodipine besylate (ADB), Diltiazem hydrochloride (DTZ) and Verapamil hydrochloride (VPM) in pharmaceutical formulations. These methods based on formation ion pair complexes with Sulfochlorophenol-S (SCPS), Bromopyrogallol red (BPR), EriochromecyanineR (ECC) and Pyrocatechol violet (PCV) in acidic medium. The colored products are extracted with chloroform and measured spectrophotometrically at 462, 600, 440 and 442 for ECC, SCPS, BPR and PCV, respectively. Beer’s low was obeyed in the concentration range, for ECC: 25 - 175 µg∙ml−1, 50 - 150 µg∙ml−1 or 100 - 250 µg∙ml−1, for SCPS: 300 - 800 µg∙ml−1, 200 - 700 µg∙ml−1 or 100 - 550 µg∙ml−1, for BPR: 50 - 400 µg∙ml−1, 200 - 700 µg∙ml−1 or 200 - 700 µg∙ml−1 for VPM, DTZ or ADB, respectively and for PCV: 50 - 250 µg∙ml−1 for VPM or 200 - 500 µg∙ml−1 for DTZ with molar absorptivity, for ECC: 2.2 × 10⁴, 2.1 × 10⁴, 1.6 × 10⁴ L∙mol−1∙cm−1, for SCPS: 3.8 × 10³, 5.6 × 10³, 8.1 × 10³ L∙mol−1∙cm−1, for BPR: 11 × 103, 4.8 × 10³, 6.9 × 10³ L∙mol−1∙cm−1 for VPM, DTZ or ADB, respectively and for PCV: 19.5 × 10³ L∙mol−1∙cm−1 for VPM and 6.6 × 10³ L∙mol−1∙cm−1 for DTZ and relative standard deviation, for ECC: 0.76%, 0.86%, 0.46%, for SCPS: 0.94%, 0.96%, 0.86%, for BPR: 0.96%, 0.95%, 0.55% for VPM, DTZ or ADB, respectively and for PCV: 0.81% for VPM and 0.65% for DTZ. These methods have been successfully applied for the assay of drug in pharmaceutical formulations. No interference was observed from common pharmaceutical adjuvants. Statistical comparison of the results with the reference method shows excellent agreement and indicates no significant difference in accuracy and precision.
1. INTRODUCTION
The calcium channel blockers are divided into three chemical classes, each with different pharmacokinetic properties and clinical indications [1].
1.1. Diphenylamine Derivatives
Verapamil is the only member of this class. Verapamil is the least selective of any calcium channel blocker, and has significant effects on both cardiac and vascular smooth muscle cells.
Verapamil hydrochloride contains not less than 99.0% and not more than the equivalent of 101% of (2RS)-2-(3, 4-dimethoxyphenyl) 5-[2-(3,4 dimethoxyphenyl) ethyl] (methyl) amino-2-(1-methyl ethyl) pentanenitrile hydrochloride, calculated with reference to the dried substance.
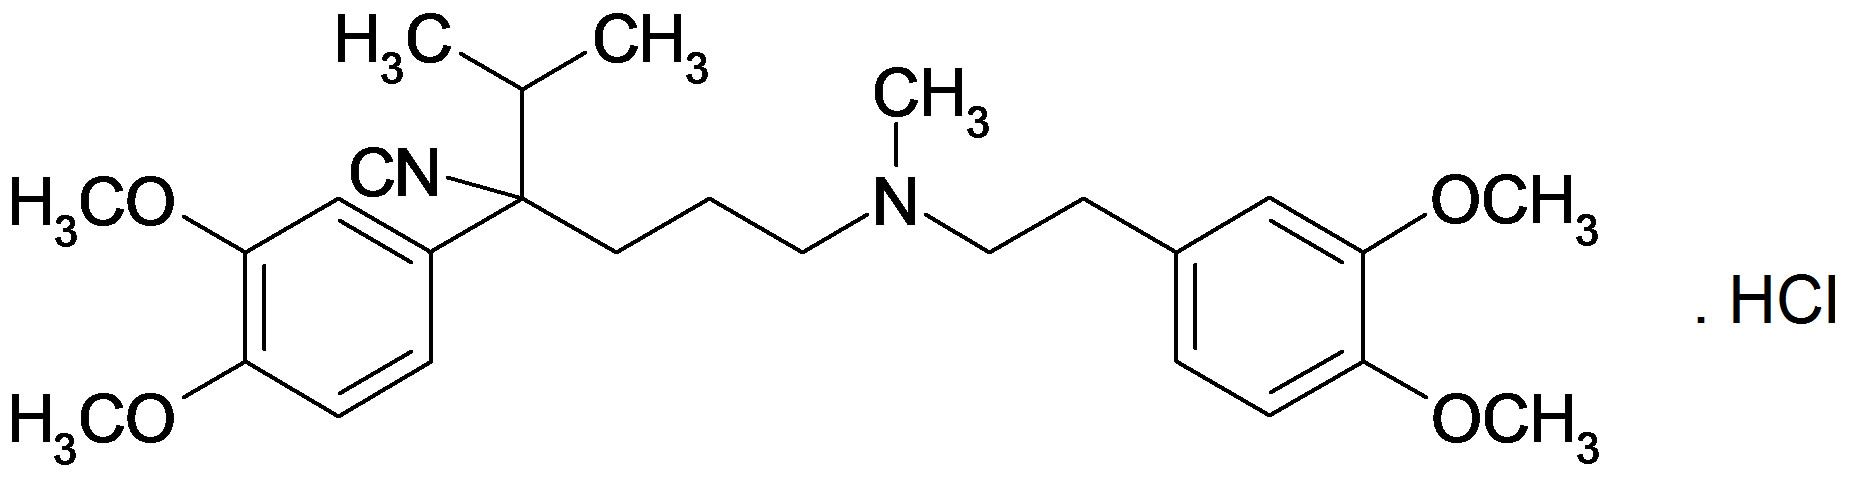
Verapamil hydrochloride (VPM).
1.2. Benzothiazepine Derivatives
Diltiazem is the only member of this class. Like verapamil, diltiazem affects both cardiac and vascular smooth muscle cells; however, it has a less pronounced negative intropic effect on the heart than does verapamil.
Diltiazem hydrochloride contains not less than 98.5% and not more than the equivalent of 101.0% of (2S,3S)- 3-acetyloxy-5-[2-(dimethyl-amino) ethyl]-2-(4-methoxyphenyl)-2,3-dihydro-1,5-benzothiazepin-4(5H)-one hydrochloride, calculated with reference to the dried substance.
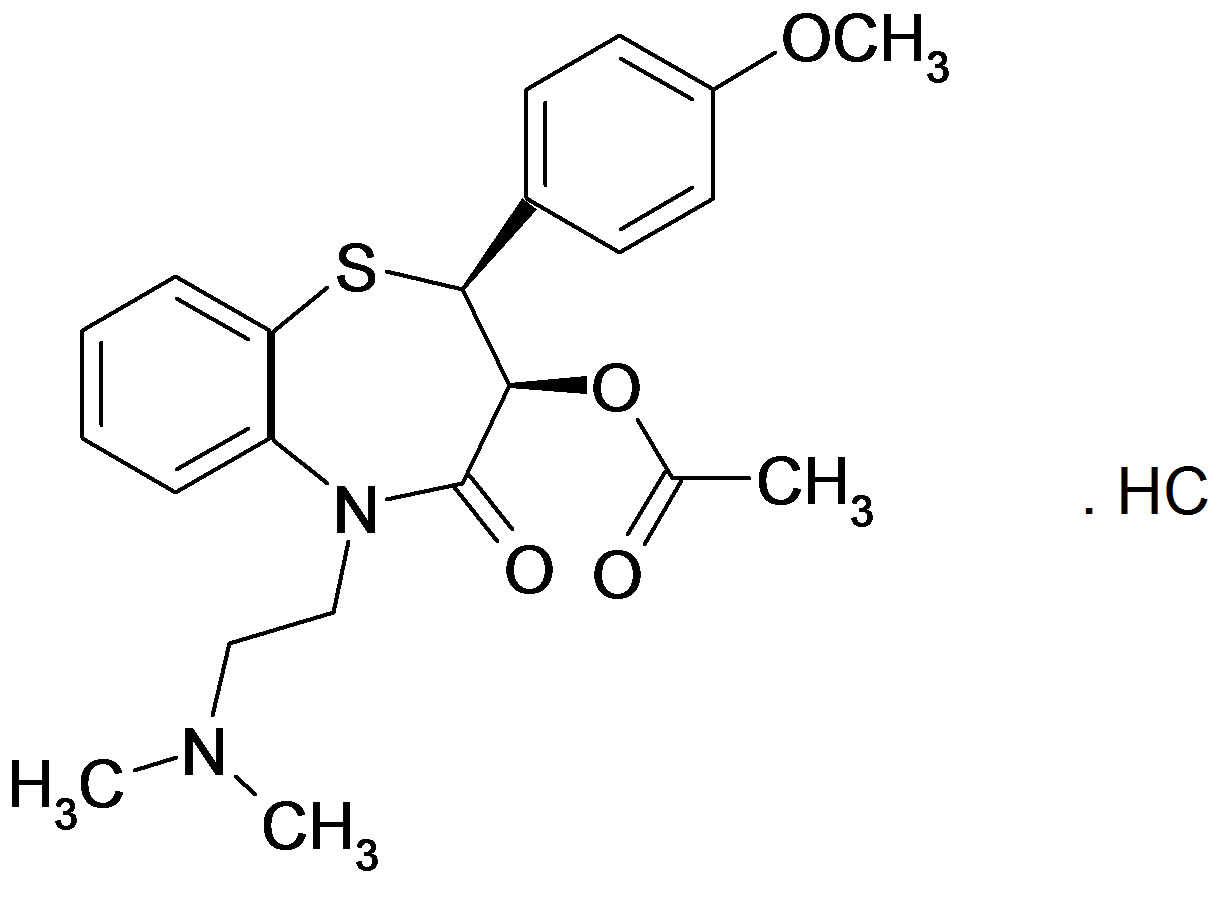
Diltiazem hydrochloride (DTZ).
1.3. 1,4 Dihydropyridine Derivatives
This rapidly expanding class of calcium channel blockers includes the first-generation (nifedipine), second-generation: “amlodipine, felodipine, isradipine” and others. Some of the newer agents, such as amlodipine and nicerdipine, have the advantage that they show little interaction with other cardiovascular drugs, such as digoxin or warfarine that are often used concomitantly with calcium channel blockers.
Amlodipine besylate contains not less than 99.0% and not more than 101.0% of 2-[(2-amino-ethoxy)-methyl]- 4-2-chlorophenyl), 1,4-dihydro-6-methyl-3,5-pyridine dicerboxylic acid, 3-ethyl-5-methyl ester besylate.
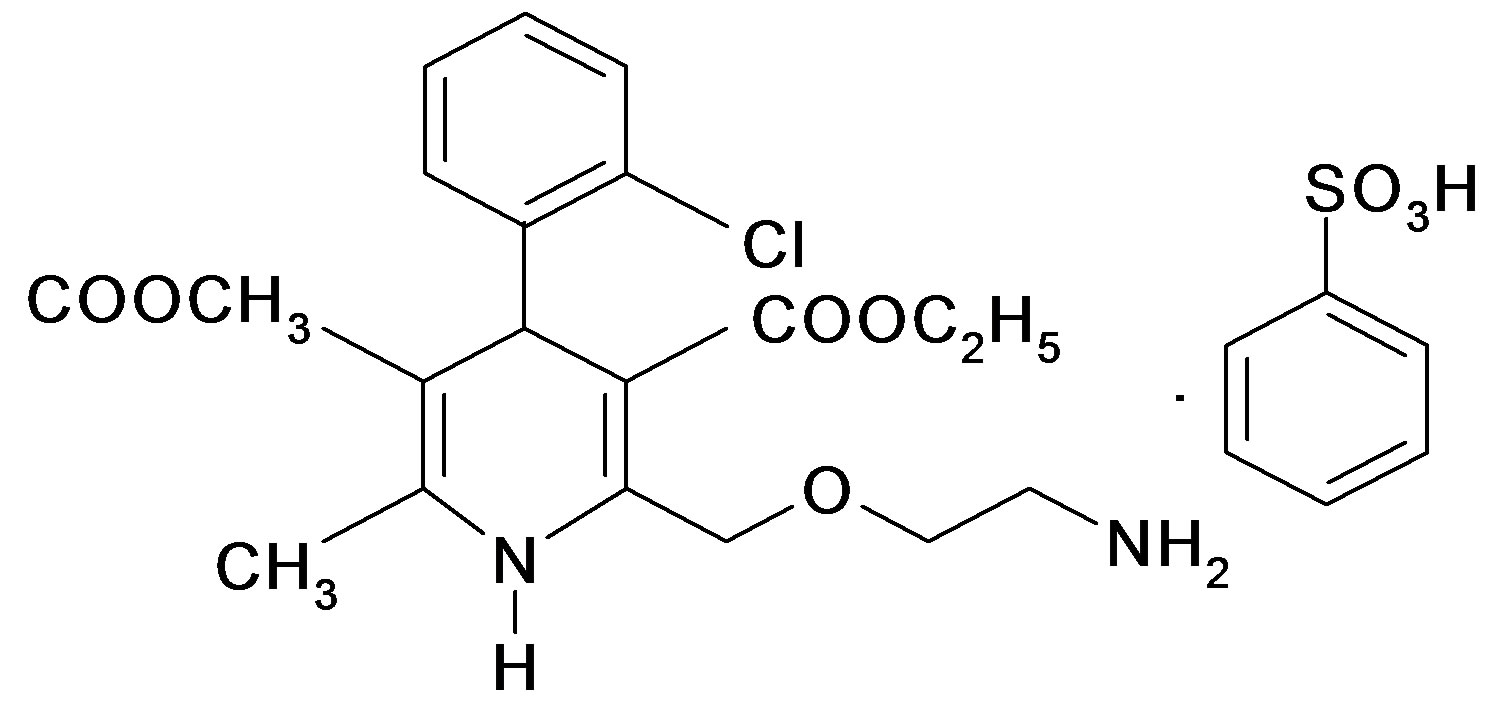
Amlodipine besylate (ADB).
Calcium channel blockers have been determined by a variety of analytical techniques, such as HPLC [2-10], HPTLC [11-16], gas chromatography [17-21], Micellar electrokinetic chromatography [22-25], electroanalytical methods [26-28] and spectrophotometric methods [29- 34].
In this communication, four new spectrophotometric methods for the determination of amlodipine, diltiazem and verapamil have been discussed. The methods based on formation of chloroform-extractable ion-pair complexes with Sulfochlorophenol-S (SCPS), Bromopyrogallol red (BPR), Eriochromecyanine-R (ECC) and Pyrocatechol violet (PCV).
2. EXPERIMENTAL
2.1. Apparatus
A spectronicTM GenesysTM, ultraviolet/visible spectrophotometer (Milton Roy Co., Westhaven, USA) was used for measure absorbance.
A Milwakee SM 101 pH meter, (Portugal) was used for pH measurements.
2.2. Chemicals and Reagents
Stock solutions containing 1 mg∙ml−1 of each of the studied drugs were prepared. 50 mg of verapamil and diltiazem were accurately weighed (Alexandria Co. For pharmaceuticals, Alexandria, Egypt), carefully transferred into 50 ml volumetric flasks, then dissolved in double distilled water, sonicated for about 2 min and completed to volume with the same solvent. For amlodipine 50 mg was accurately weighed, carefully transferred into 50-ml volumetric flasks, then dissolved in 2 ml methanol, sonicated for about 2 min and completed to volume with double distilled water. Working standard solutions containing 50 - 500 µg∙ml−1 were prepared by a series of dilutions of the stock solutions with water. ECC (Merck, Darmstadt, Germany) 0.2% w/v stock solution was prepared by dissolving 200 mg of the commercial preparation in double distilled water into 100-ml volumetric flask and then diluted to volume with the same solvent. SCPS (Sigma, St. Louis, MO, USA) 0.1% w/v stock solution was prepared by dissolving 100 mg of the commercial preparation in double distilled water into a 100- ml volumetric flask and then diluted to volume with the same solvent. BPR (Sigma, St. Louis, MO, USA) 0.05% w/v stock solution was prepared by dissolving 50 mg of the commercial preparation in double distilled water into a 100-ml volumetric flask and then diluted to volume with the same solvent. PCV (Sigma, St. Louis, MO, USA) 0.1% w/v stock solution was prepared by dissolving 100 mg of the commercial preparation in double distilled water into a 100-ml volumetric flask and then diluted to volume with the same solvent.
Stock 1 M solutions of each of the following acids; acetic, hydrochloric, nitric, oxalic and sulfuric acids which obtained from El-Nasr Co. (for pharmaceuticals and chemicals, Egypt) were freshly prepared in double distilled water. Stock solutions of citric acid, 0.1 - 5 M were freshly prepared in double distilled water.
2.3. Procedure for Calibration Curve
Into 60-ml separating funnel: for ECC; 1 ml of 3 M citric acid was transferred, followed by 1 ml of working standard solution of either VPM, DTZ or ADB, in the general concentration ranges 25 - 175 µg∙ml−1, 50 - 150 µg∙ml−1 or 100 - 250 µg∙ml−1, respectively. Then suitable aliquot of corresponding dye was added to the resultant solution, 2 ml of 0.2% w/v ECC solution for DTZ, 1.5 ml of 0.2% w/v ECC solution for VPM and ADB. For SCPS; 2 ml of 0.5 M sulfuric acid for VPM, 1.5 ml of 0.3 M sulfuric acid for DTZ and ADB was transferred, followed by 1 ml of working standard solution of VPM, DTZ or ADB, in the general concentration ranges 300 - 800 µg∙ml−1, 200 - 700 µg∙ml−1 or 100 - 550 µg∙ml−1, respectively. Then suitable aliquot of corresponding dye was added to the resultant solution, 1.5 ml of 0.1% w/v SCPS solution. For BPR; 1.5 ml of 1 M sulfuric acid was transferred, followed by 1 ml of working standard solution of VPM, DTZ or ADB, in the general concentration ranges 50 - 400 µg∙ml−1, 200 - 700 µg∙ml−1 or 200 - 700 µg∙ml−1, respectively. Then suitable aliquot of corresponding dye was added to the resultant solution, 1.5 ml of 0.05% w/v BPR solution. For PCV; 0.5 ml of 1 M sulfuric acid was transferred, followed by 1 ml of working standard solution of either VPM or DTZ, in the general concentration ranges 50 - 250 µg∙ml−1 or 200 - 500 µg∙ml−1, respectively. Then suitable aliquots of corresponding dye were added to the resultant solution, 1.5 ml of 0.1% w/v PCV solution. The contents were mixed well and shacked with three 3 ml portions of chloroform. Then the extracts were combined into 10-ml volumetric flask and completed to volume with chloroform. The combined extracts were filtered over 2 gm anhydrous sodium sulfate and first portion of the filtrate was rejected. The absorbance of the chloroform extract was measured at lmax = 462, 600, 440 and 442 nm against a reagent blank treated similarly, respectively.
2.4. Procedure for the Assay of Drug in Dosage Forms
An accurately weight amount equivalent to 100.0 mg of each drug from composite of 20 powdered tablets was carefully transferred into 100 ml volumetric flask, followed by addition of about 50 ml double distilled water, and the mixture was shaken well, sonicated for about 10 min and then completed to volume with the same solvent. The resulting solution was filtered where the first portion of the filtrate was rejected [4]. Appropriate volume was diluted quantitatively with the same solvent to prepare a working standard solution containing 50 - 500 µg∙ml−1 and then was subjected to analysis as explained under general procedure.
3. RESULTS AND DISCUSSION
Upon interaction of the studied drugs with these acidic dyes such as SCPS, ECC, BPR and PCV, highly colored ion pair complexes extractable with chloroform, were formed. Absorption spectra of diltiazem hydrochloride as a presentative example and the formed ion pair complexes with ECC, SCPS, BPR and PCV in chloroform, are shown in Figure 1, The reagent blanks prepared under similar conditions showed no absorption.
3.1. Composition and Formation Constant of Ion-Pair Complexes
Using job’s method of continuous variation [35], the results revealed a 1:1 ratio between ECC and the studied drugs, Figure 2, 1:4 ratios between SCPS and the investigated drugs, Figure 3, 1:1 ratio between BPR and the studied drugs, Figure 4 and 1:1 ratio between PCV and the studied drugs, Figure 5. The formation constant (Kf) of the studied drugs in complex with ECC, SCPS, BPR and PCV were calculated also the Gibbs free energy change of the reaction were calculated [36] and the collected data are illustrated in Table 1.
3.2. Optimization of the Reaction Conditions
The optimum conditions for quantitative estimation of the drug were established via number of preliminary experiments.
3.2.1. Effect of Extracting Solvent
Preliminary experiments were carried out without adjusting variables. The absorption intensities of the formed complexes were greatly affected by different immiscible solvents, it was observed that the highest absorption intensity was obtained on using chloroform as an extracting solvent; thus it was selected for all the subsequent work.
3.2.2. Effect of Acid Type
This study revealed that the use of acids led to higher absorption intensities than those obtained upon using buffers. Among different acids, citric acid gave the maximum color intensity than others with ECC but sulfuric acid gave the maximum color intensity with SCPS, BPR and PCV.
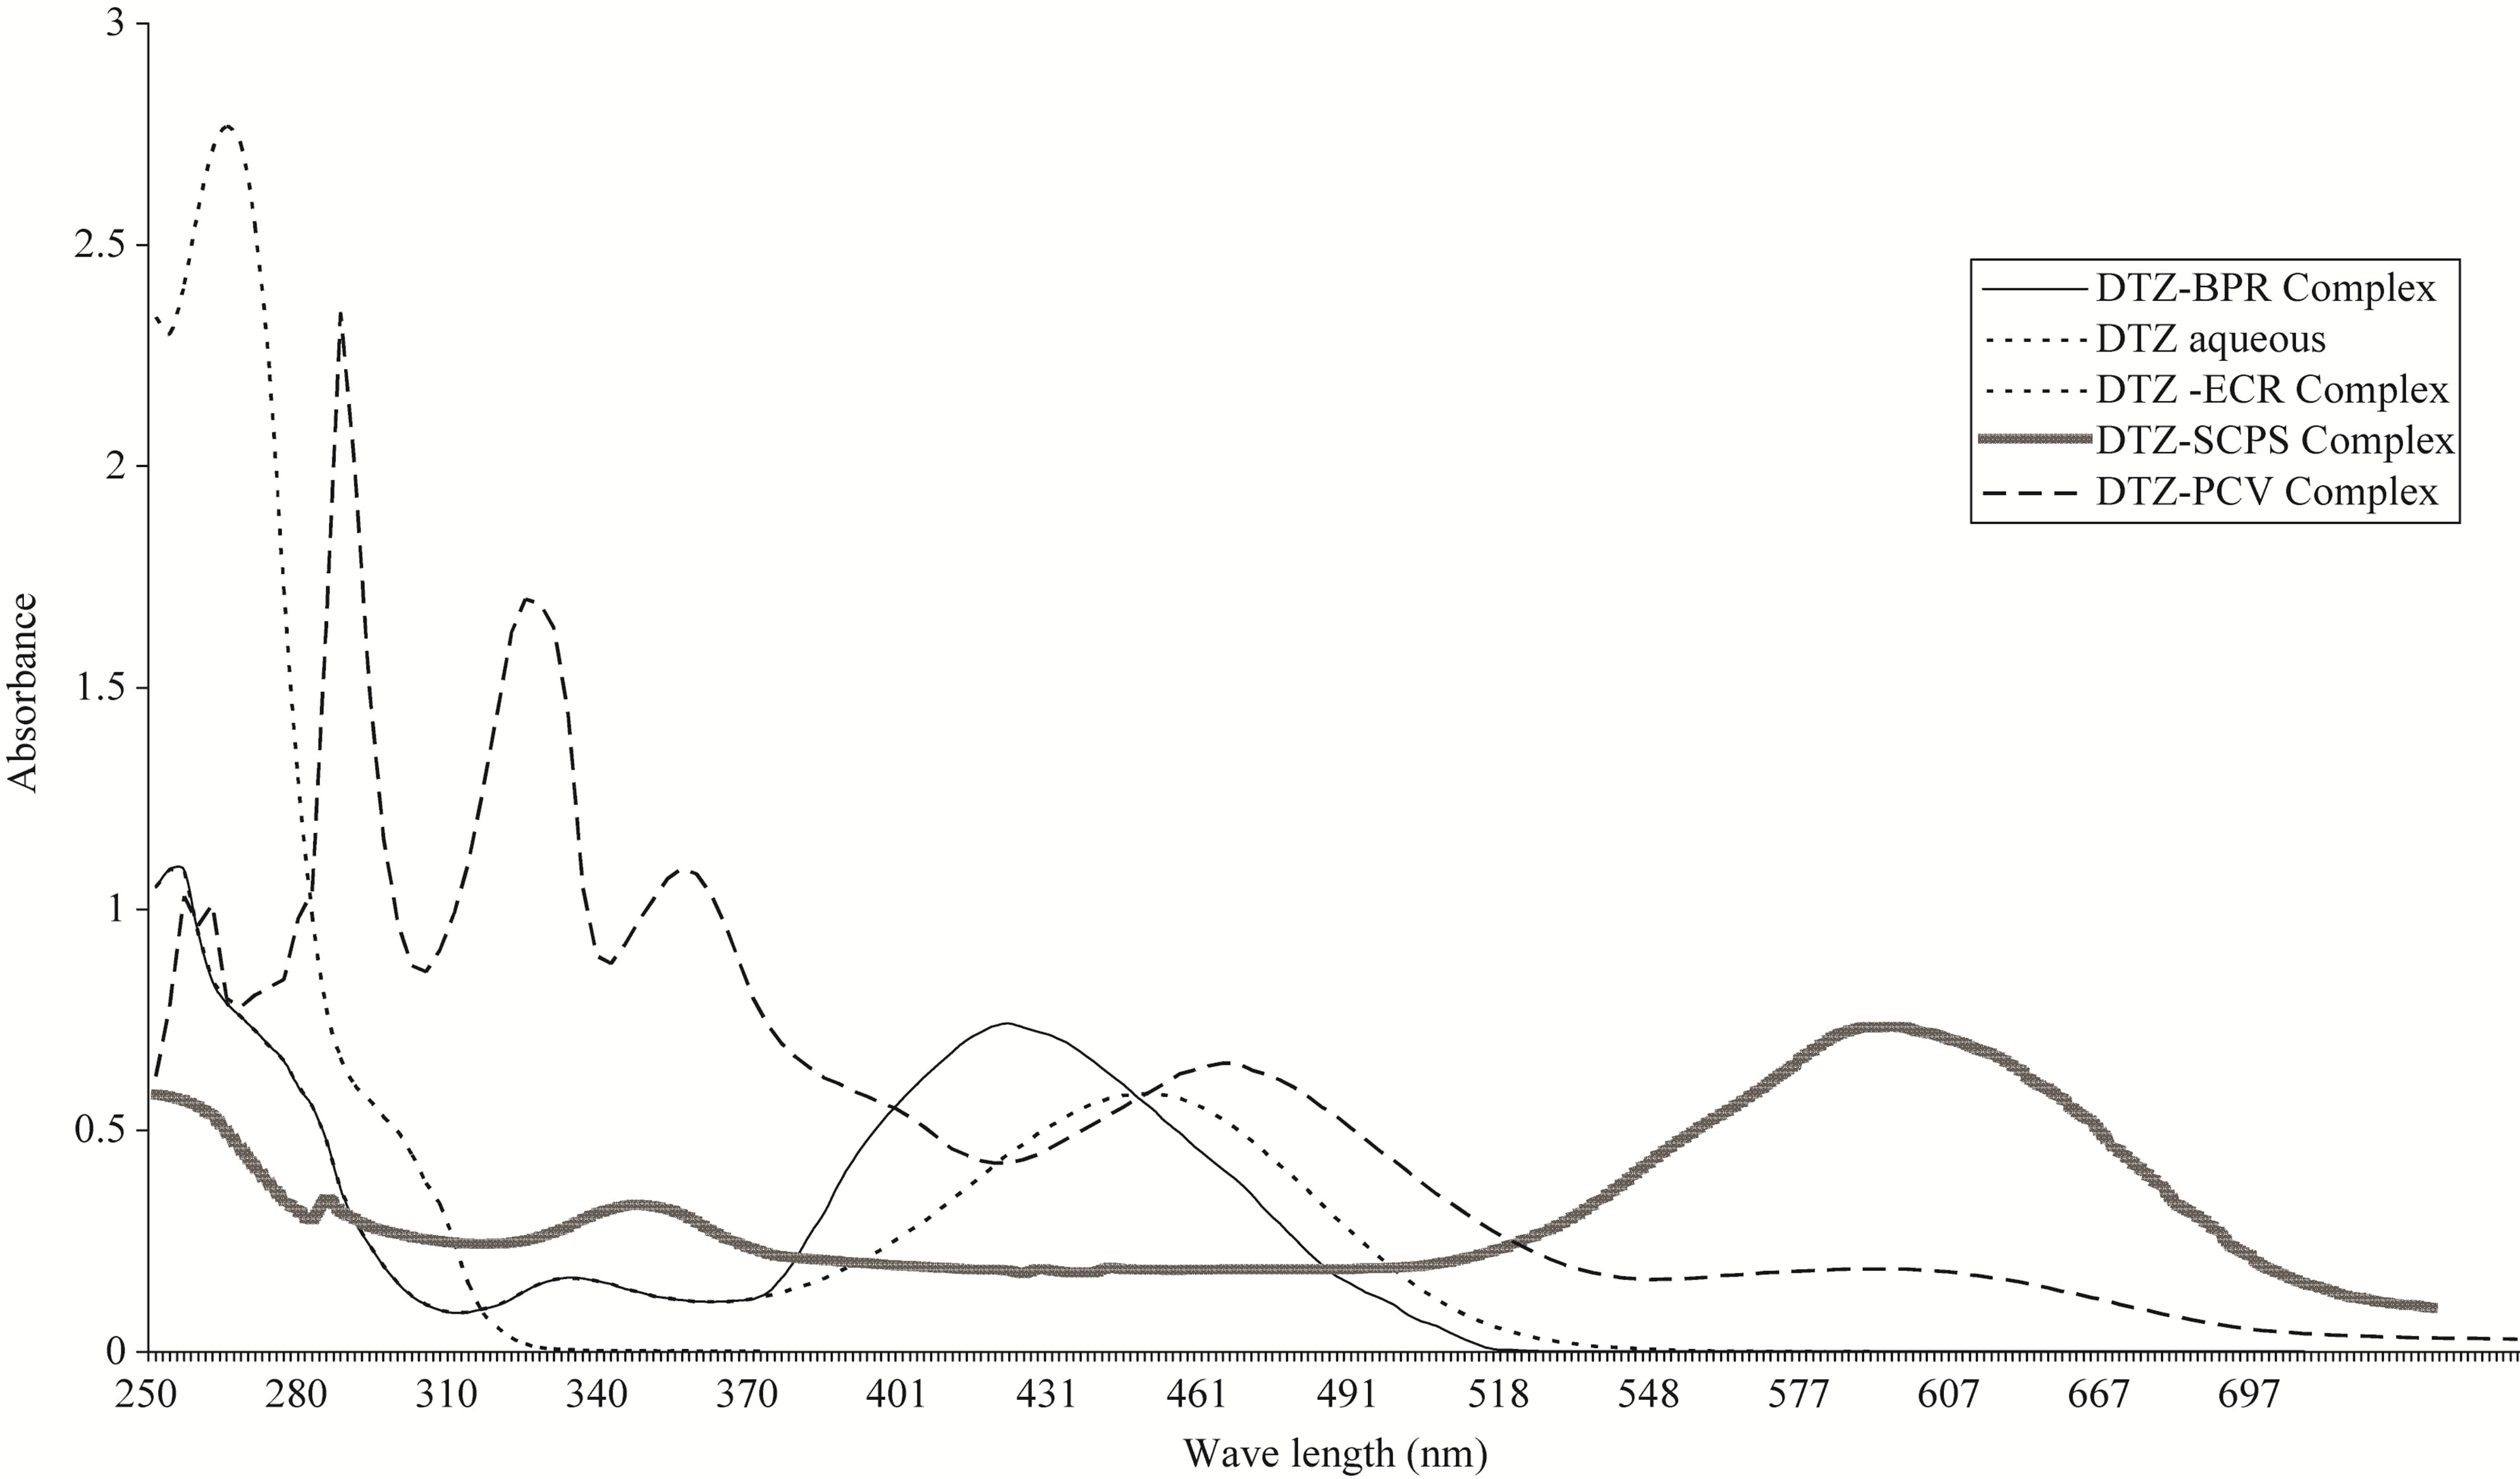
Figure 1. Absorption spectra of aqueous diltiazem hydrochloride 30 µg∙ml−1, 15 µg∙ml−1, 50 µg∙ml−1 and 50 µg∙ml−1 with BPR, ECC, SCPS and PCV dyes respectively, to form diltiazem hydrochloride ion pair complexes with these dyes in chloroform.
Table 1. Calculated stability constants and molar absorptivities of the formed chelates between the studied drugs and the four dyes.
3.2.3. Effect of Acid Concentration and Volume
As shown in Figures 5-8, 3 M citric acid gave the maximum color intensity with the highest stability in case of using ECC; 1 M sulfuric acid gave the maximum color intensity with the highest stability in case of using BPR and PCV; 0.5 M sulfuric acid gave the maximum color intensity with the highest stability in case of using SCPS with VPM. 0.3 M sulfuric acid gave the maximum color intensity with the highest stability in case of using SCPS with ADB and DTZ.
The optimum volume was also studied for each acid where; in case of using 0.5 - 3 ml of 3 M citric acid; 1.5 ml gave the maximum color intensity with the highest stability as indicated in Figure 9 For ECC. In case of using 0.5 - 3 ml of 0.3 M sulfuric acid 1.5 ml gave the maximum color intensity with the highest stability in
Figure 2. Job’s plots method of continuous variation between the studied drugs and ECC ion pair complex.
Figure 3. Job’s plots method of continuous variation between the studied drugs and SCPS ion pair complex.
Figure 4. Job’s plots method of continuous variation between the studied drugs and BPR ion pair complex.
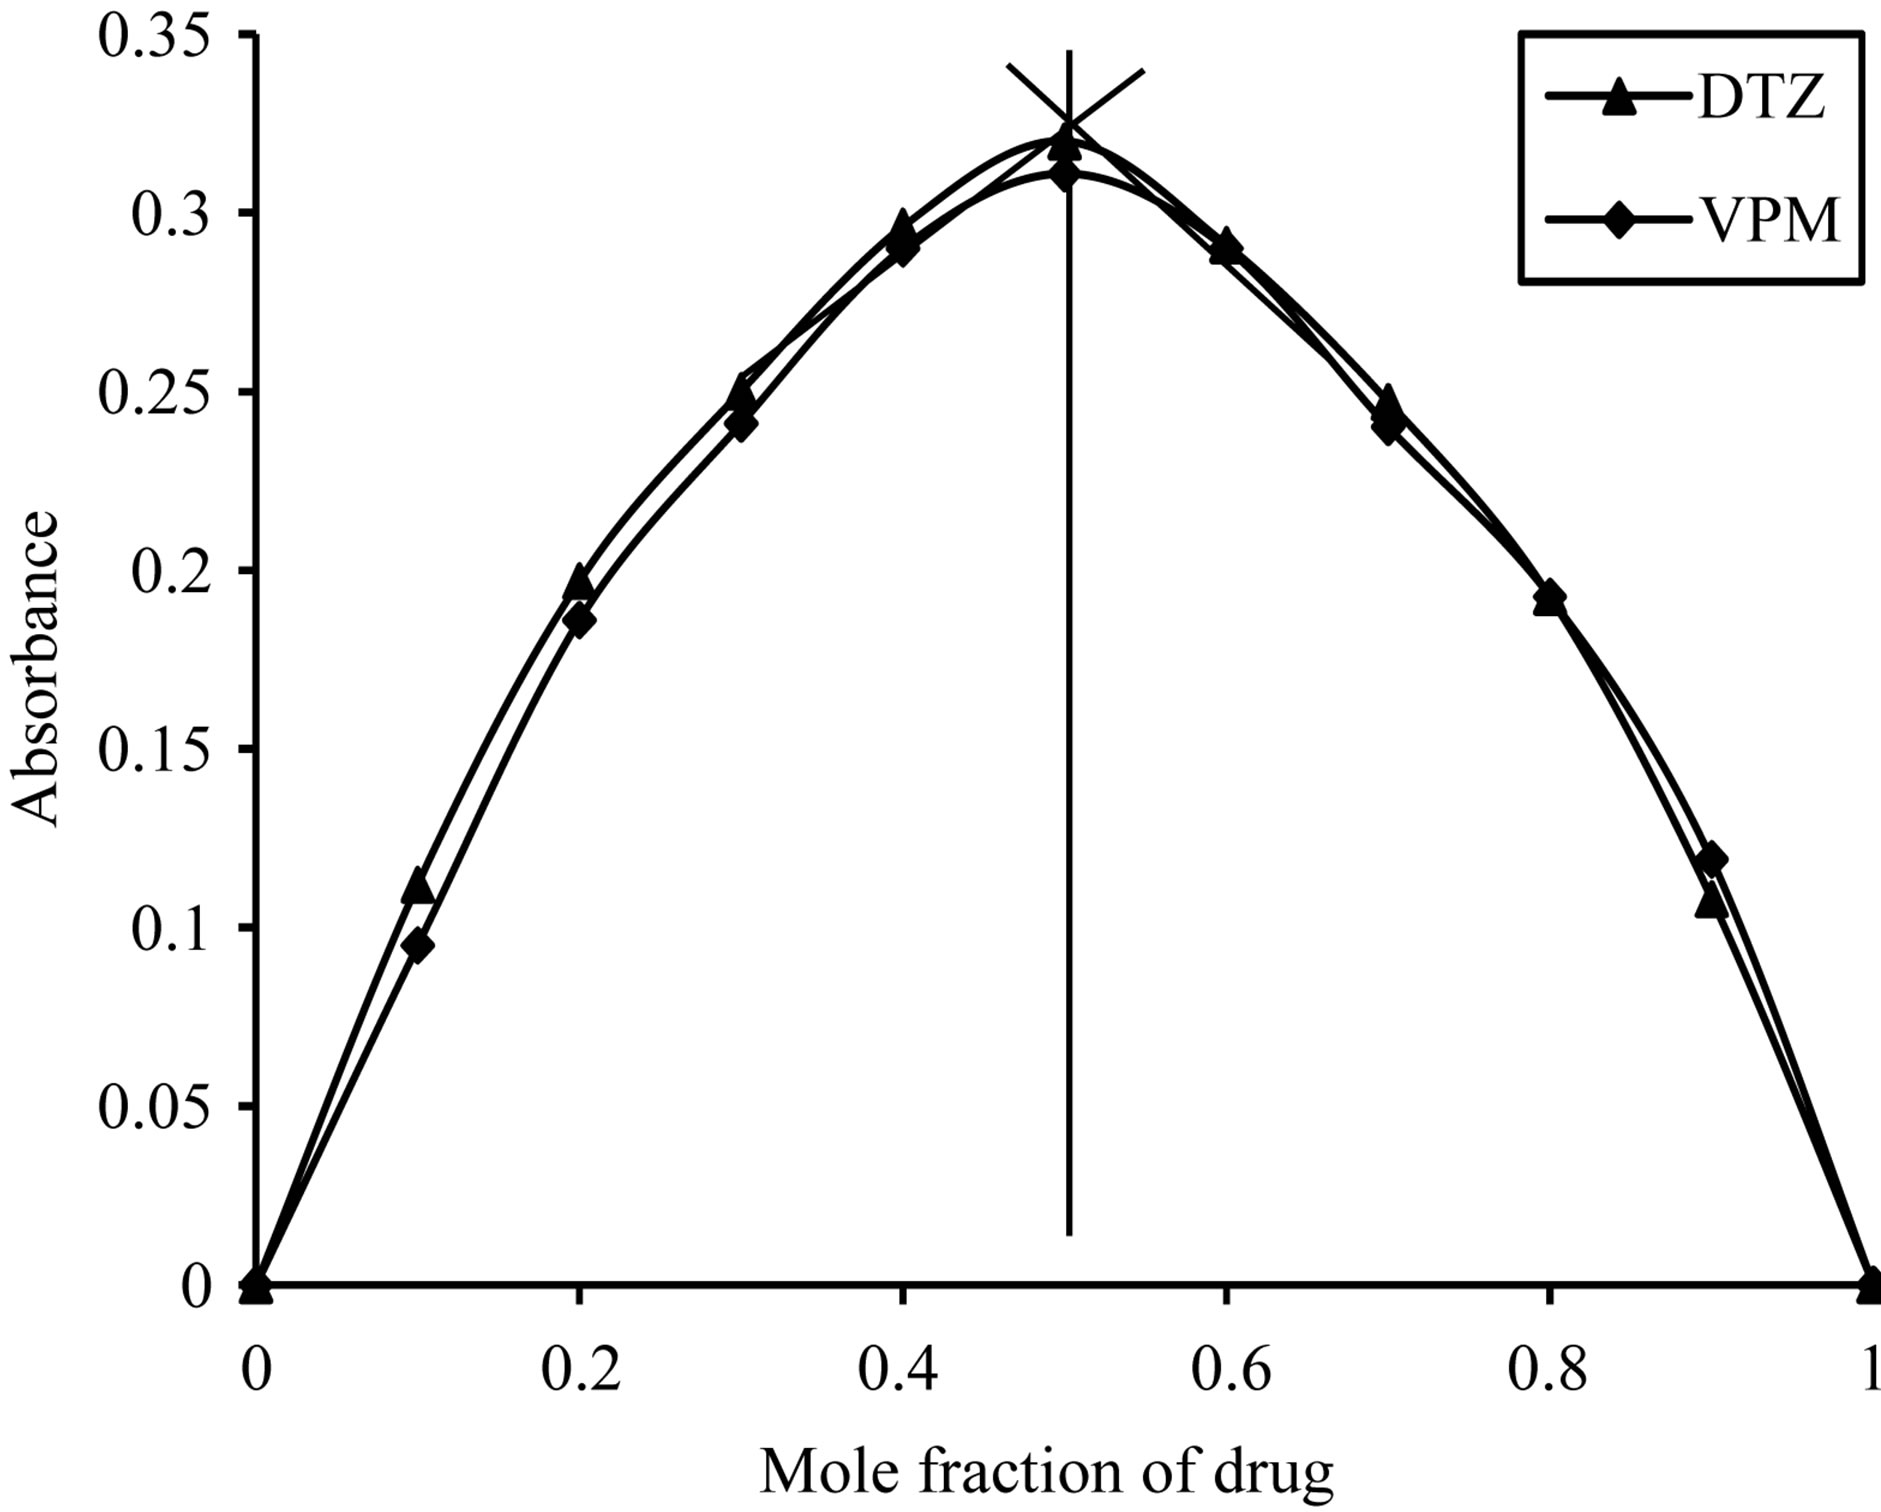
Figure 5. Job’s plots method of continuous variation between the studied drugs and PCV ion pair complex.
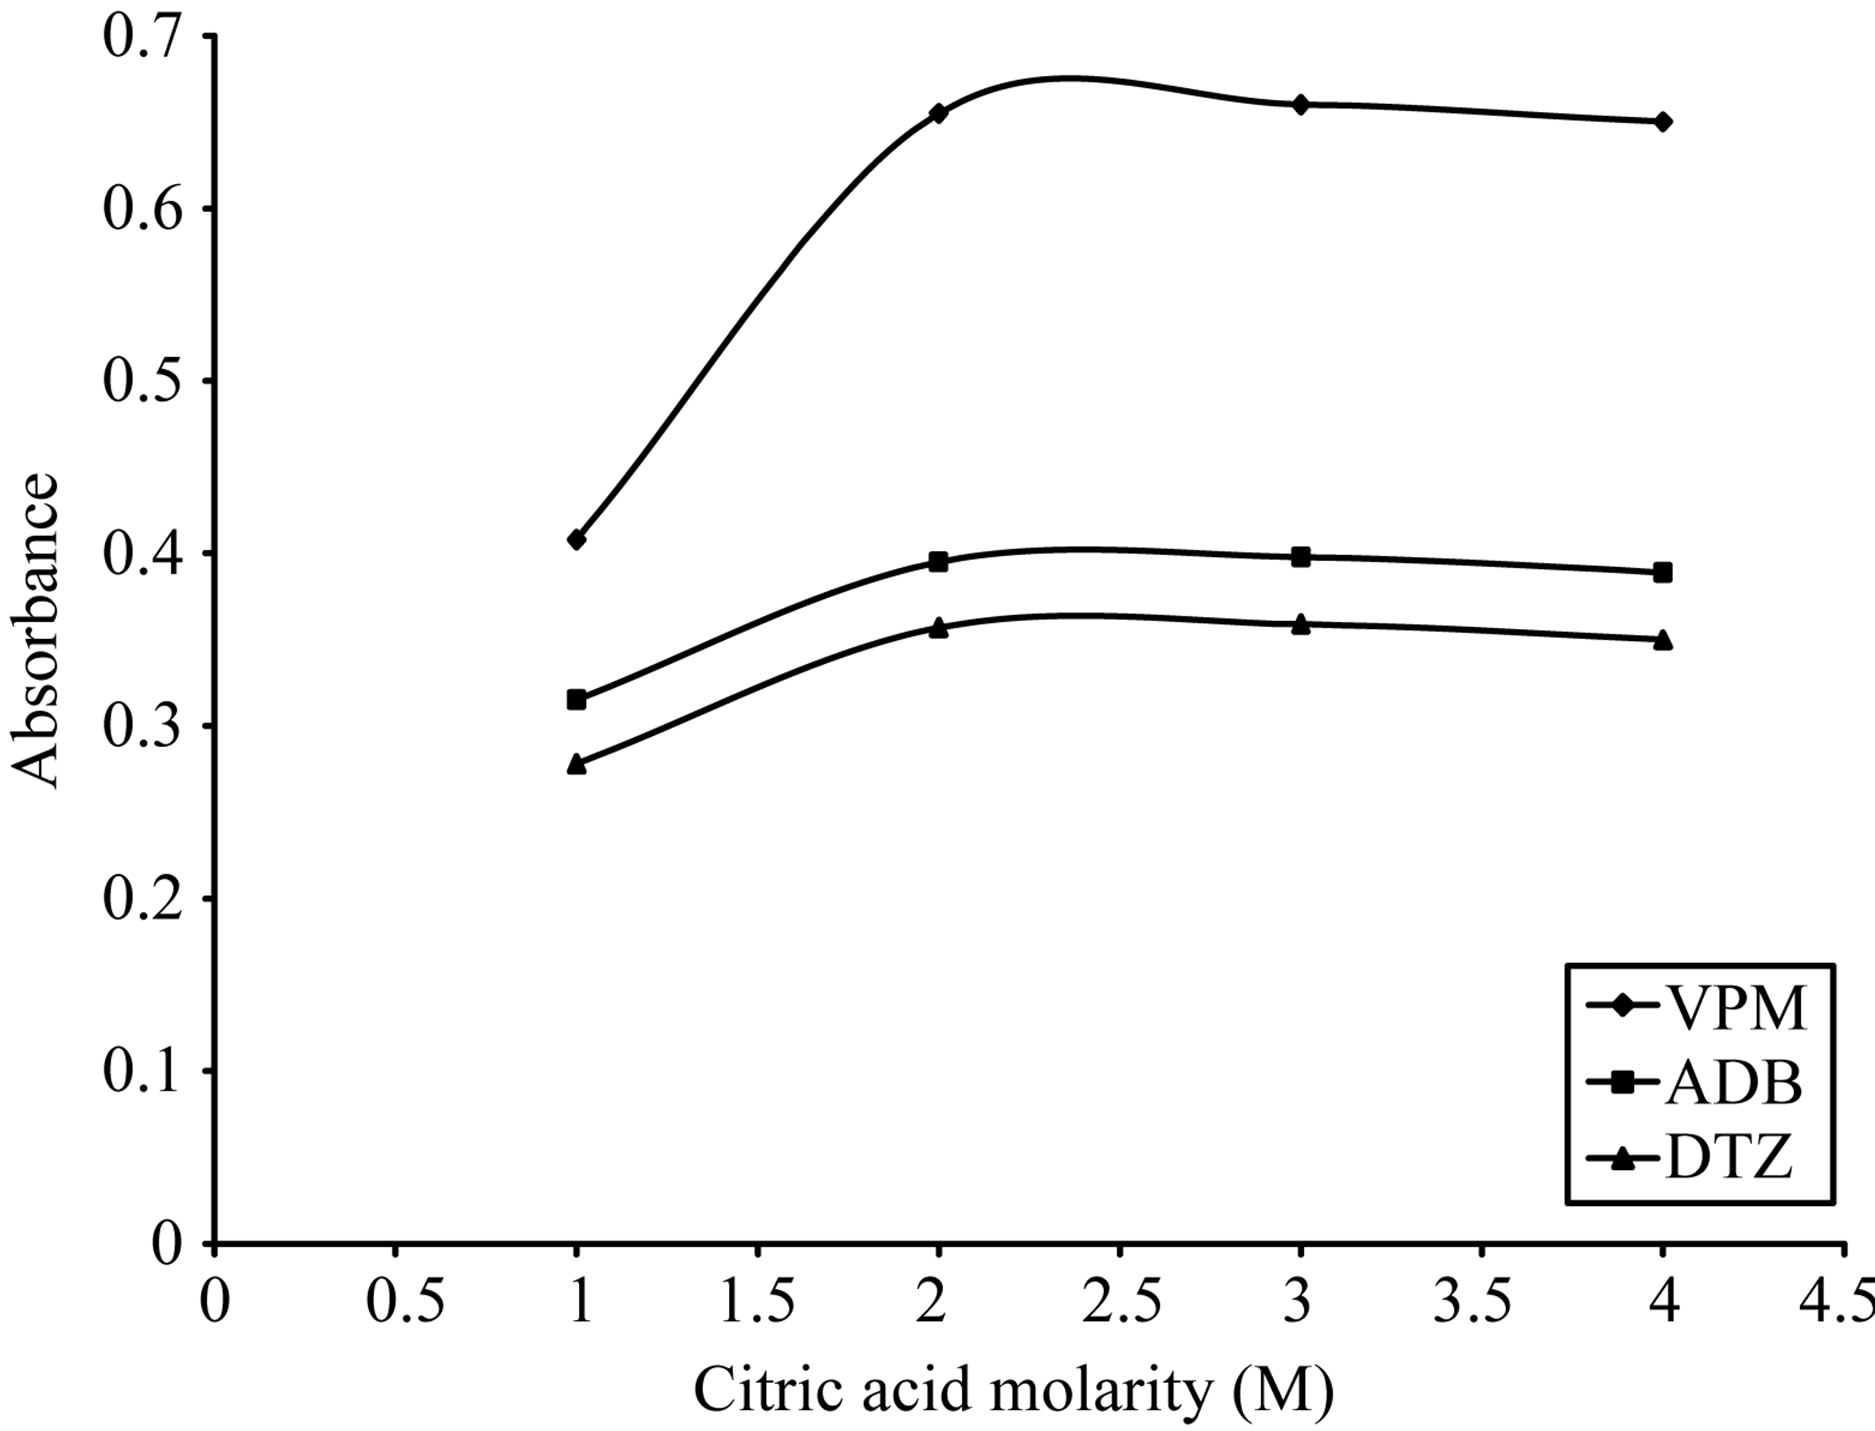
Figure 6. Effect of citric acid morality on the absorption spectra of formed ion pair complex using 15 µg∙ml−1 from each studied drug and 0.2% w/v ECC.
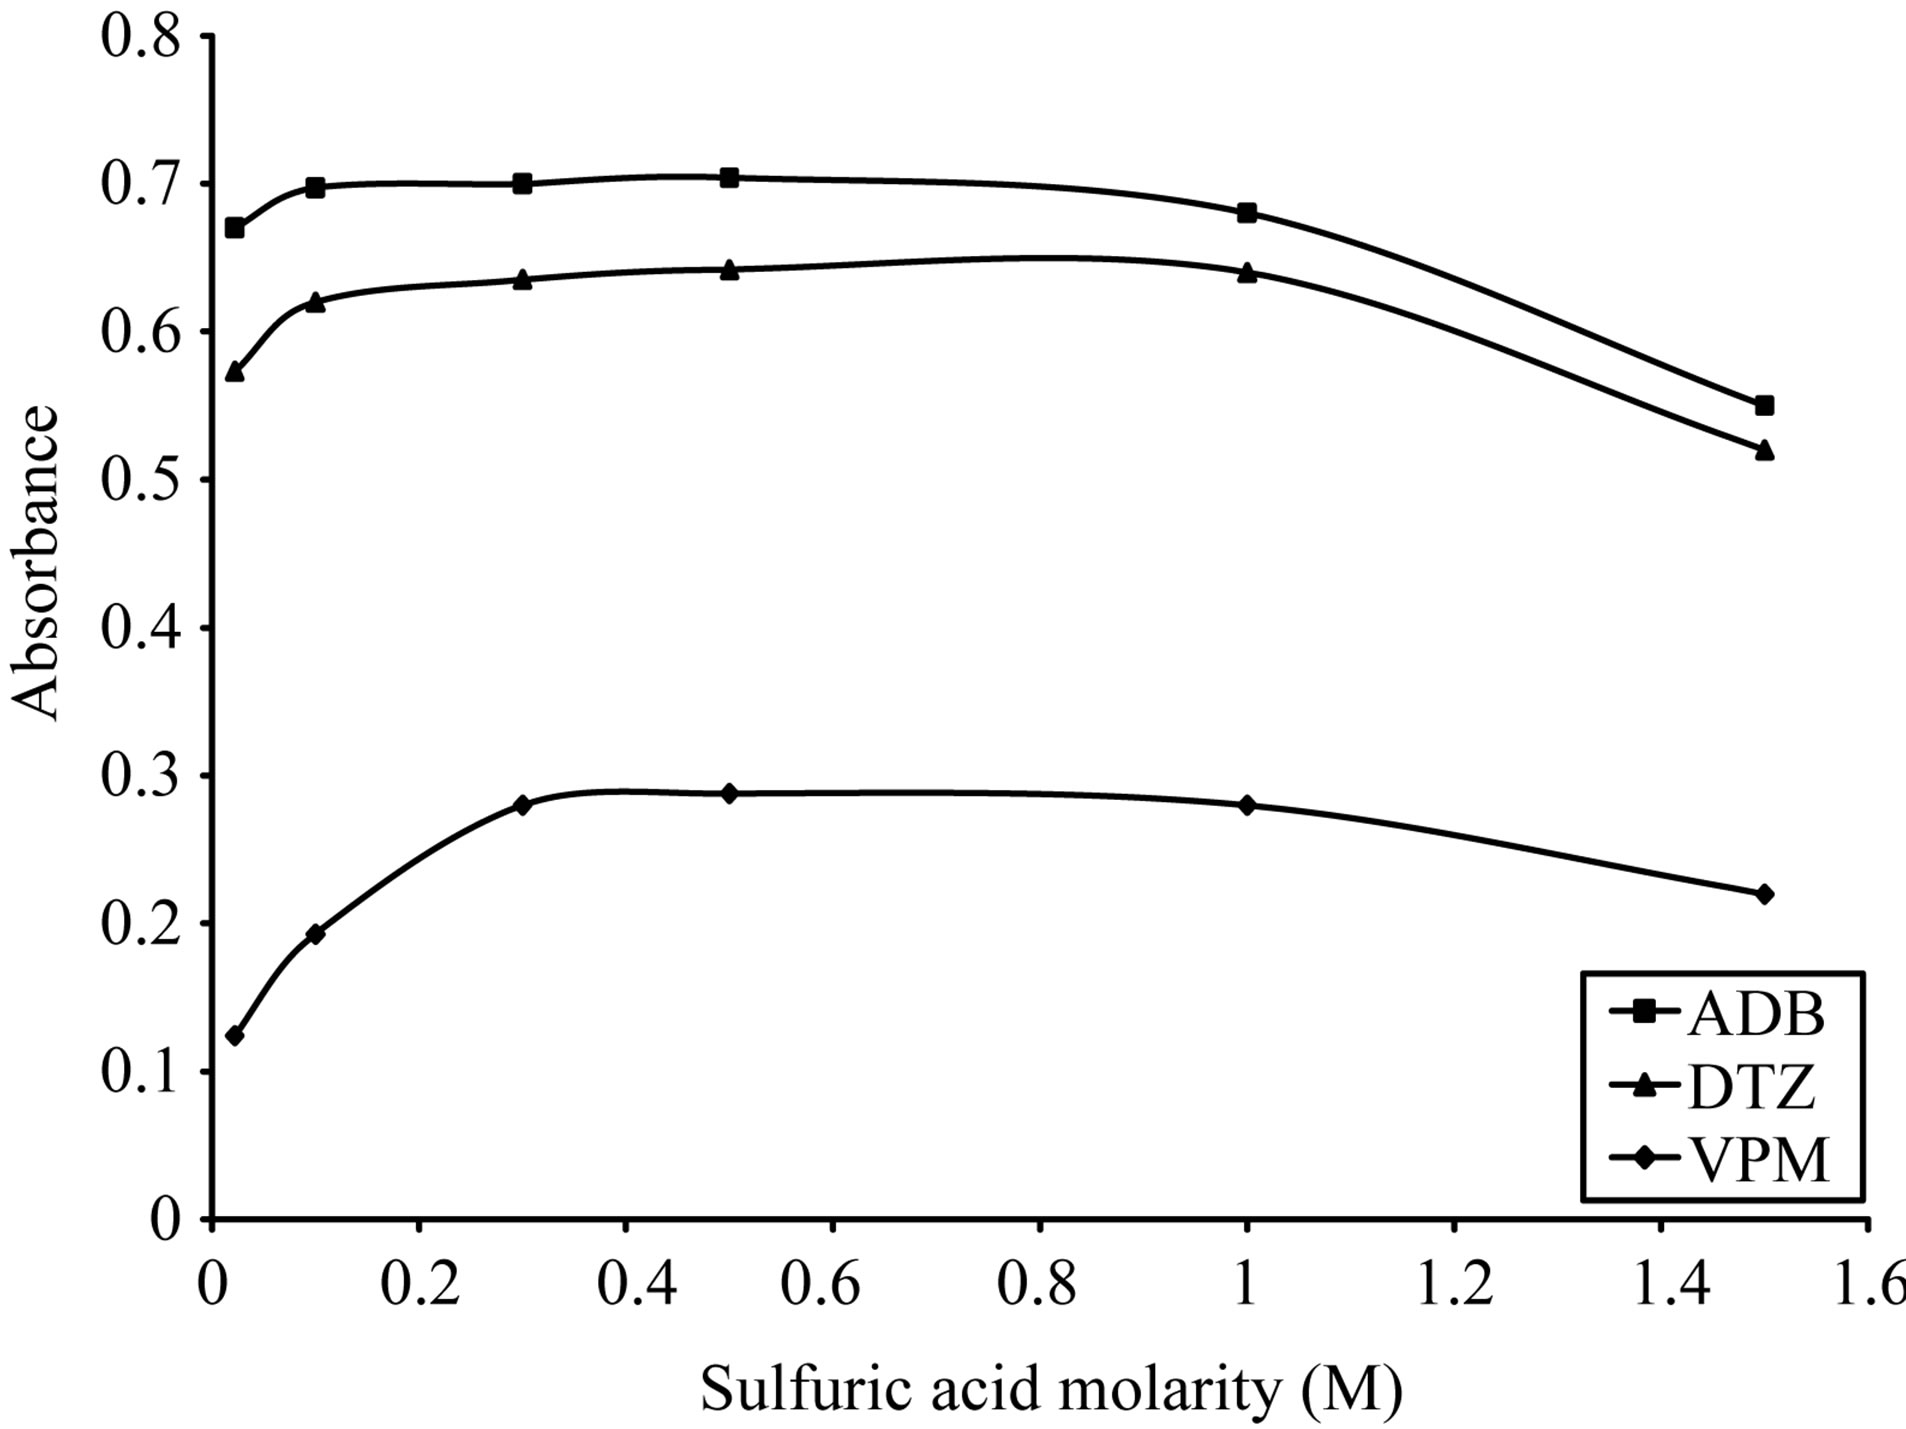
Figure 7. Effect of sulfuric acid morality on the absorption spectra of formed ion pair complex using 50 µg∙ml−1 of each studied drug and 0.1% w/v SCPS.
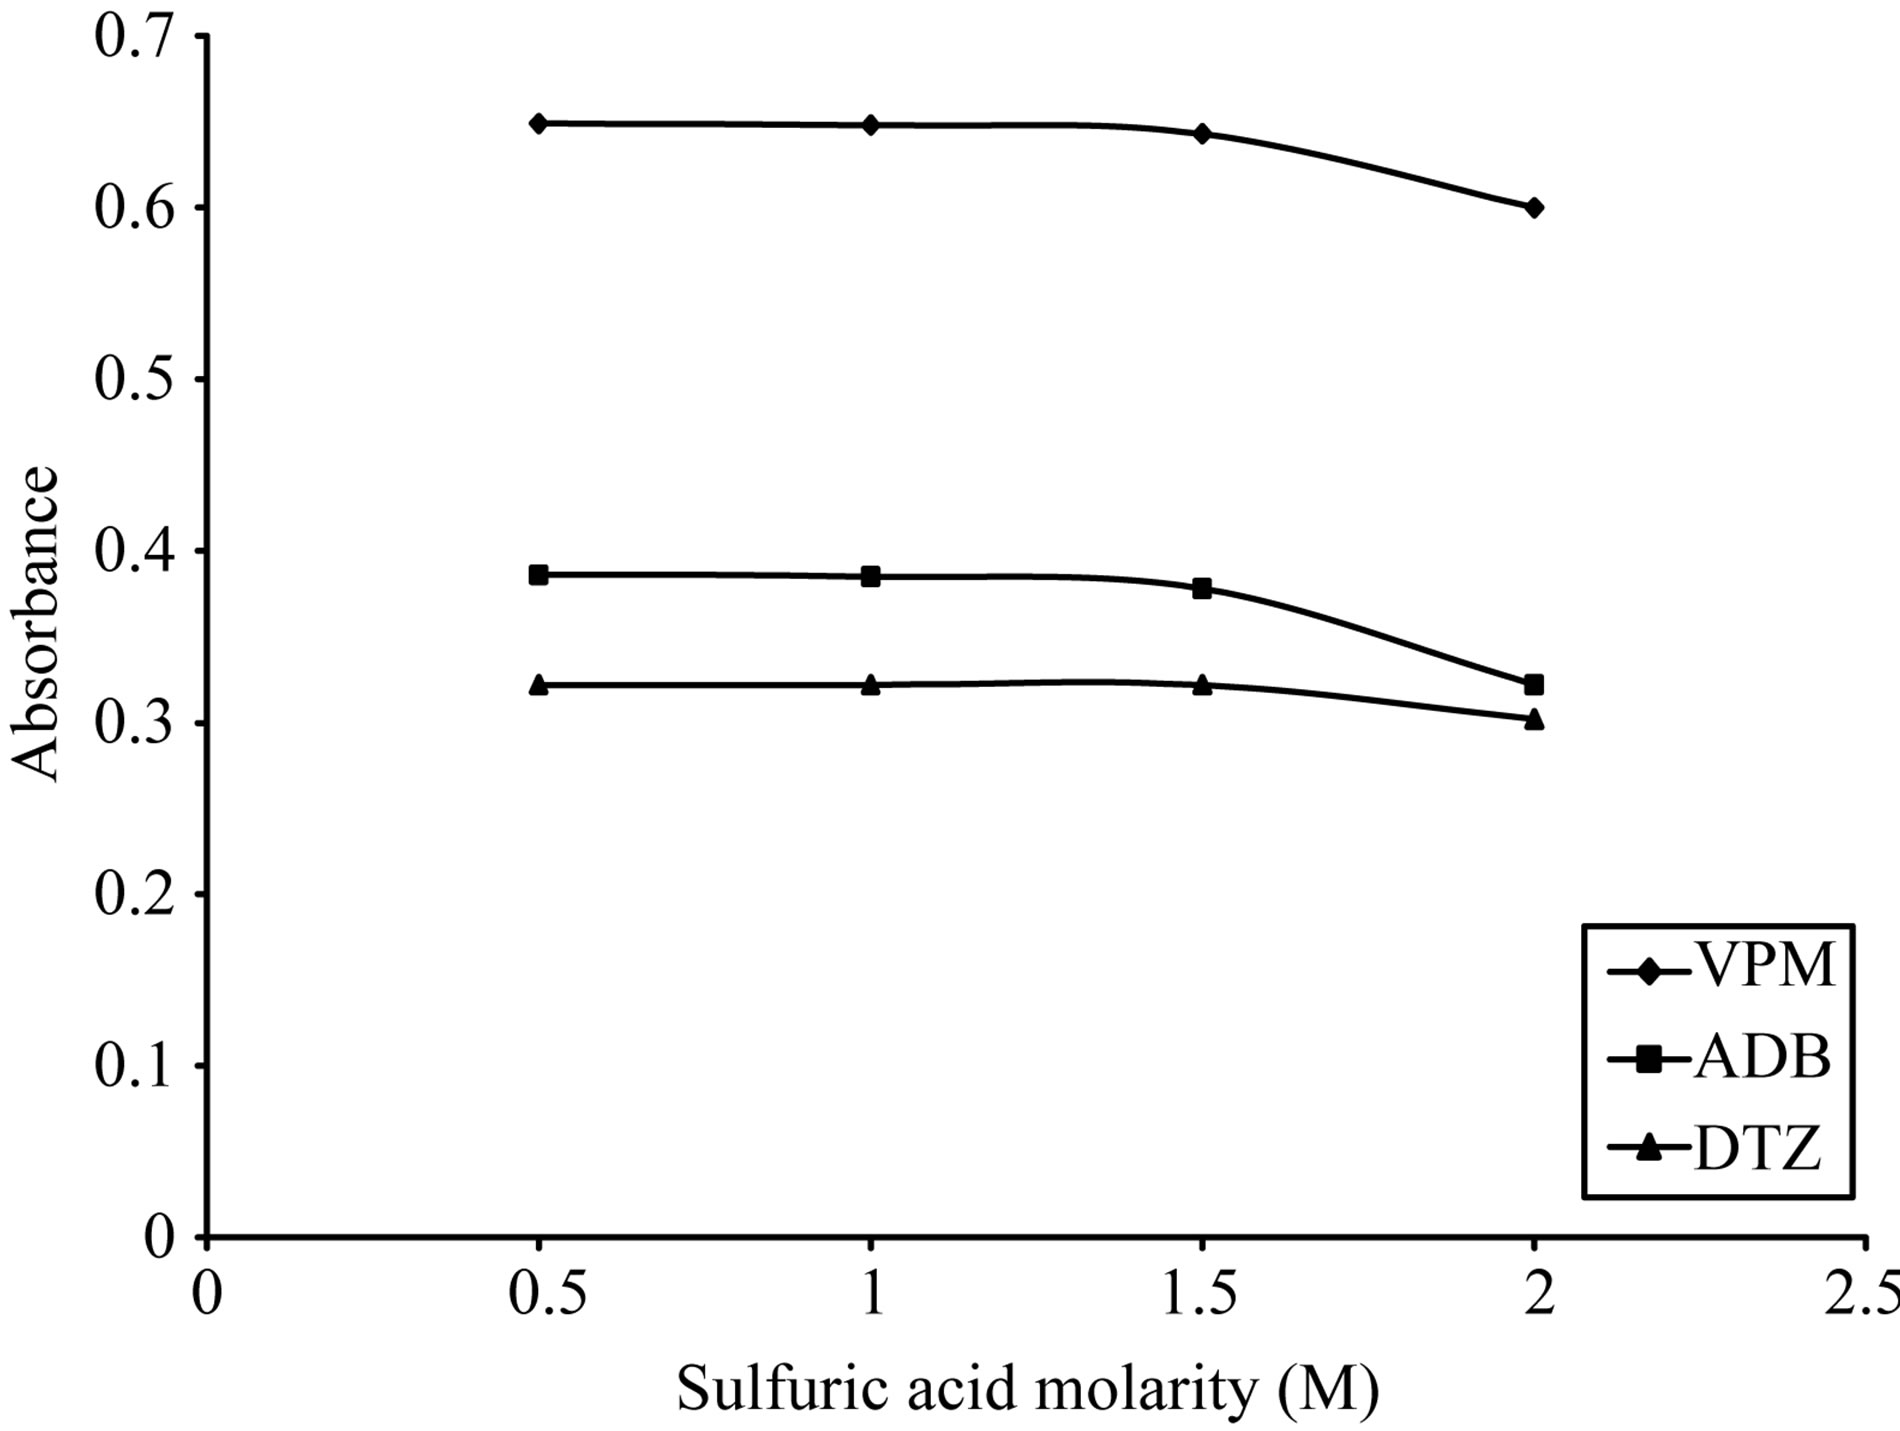
Figure 8. Effect of sulfuric acid morality on the absorption spectra of formed ion pair complex using 30 µg∙ml−1 of each studied drug and 0.05% w/v BPR complex.
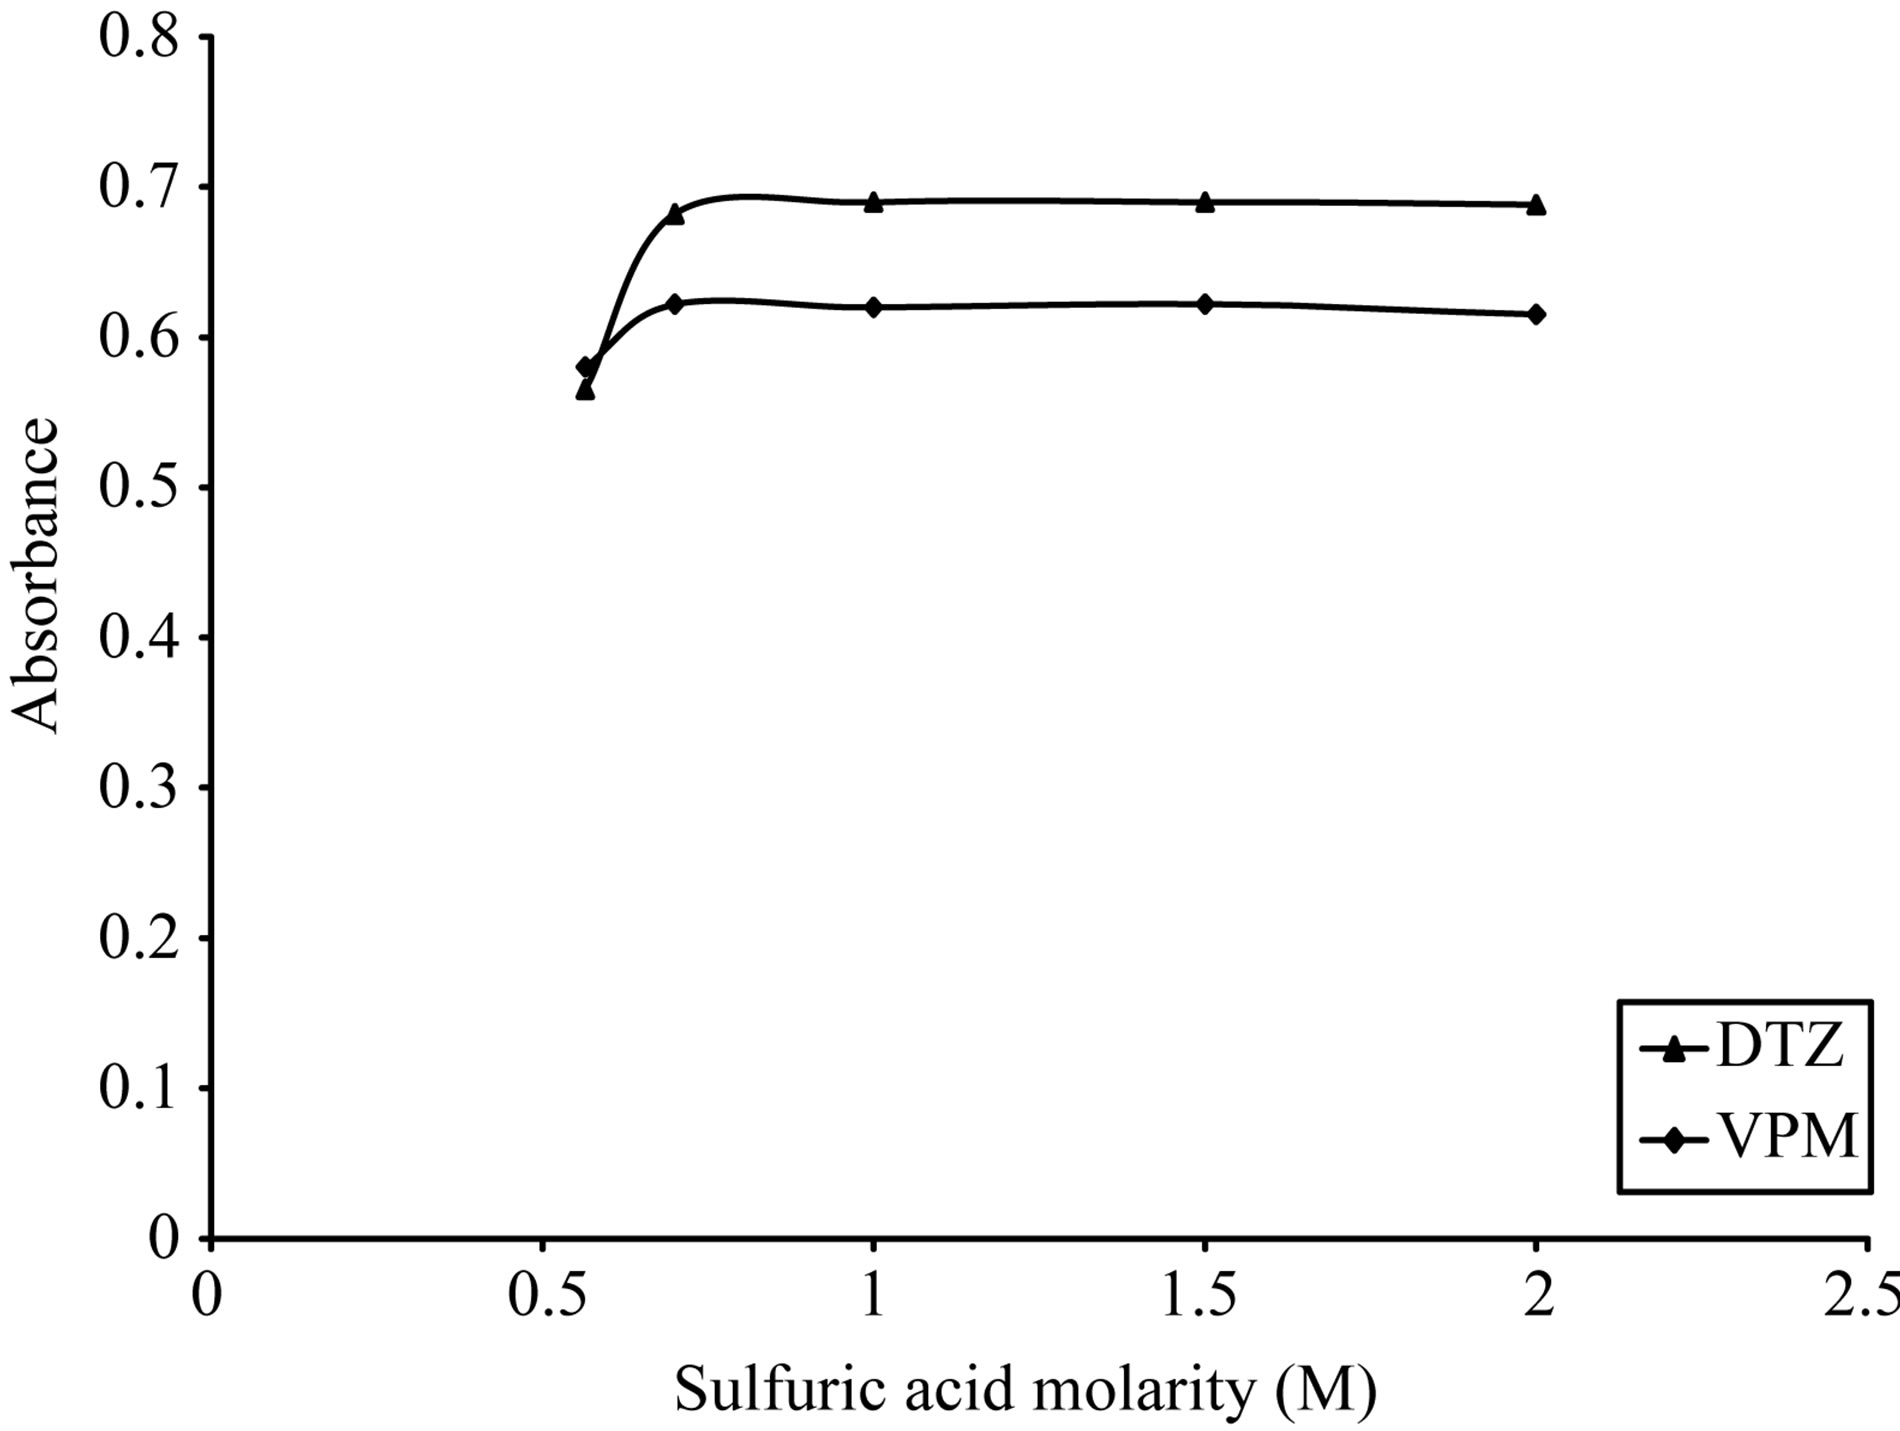
Figure 9. Effect of sulfuric acid morality on the absorption spectra of formed ion pair complex using VPM 20 µg∙ml−1, DTZ 50 µg∙ml−1 and 0.1% w/v PCV.
case of ADB and DTZ, respectively. 2 ml of 0.5 M sulfuric acid in case of VPM gave the maximum color intensity with the highest stability as indicated in Figure 10. For SCPS, in case of using 0.5 - 2.5 ml of 1 M sulfuric acid 1.5 ml gave the maximum color intensity with the highest stability as indicated in Figure 11. For BPR, in case of using 0.1 - 1.5 ml of 1 M sulfuric acid 0.5 ml gave the maximum color intensity with the highest stability as indicated in Figure 12 For PCV.
3.2.4. Effect of Dye Concentration
The absorption intensities of the formed complexes were dependent upon the dye concentration; for ECC dye, the optimum range was 0.1% - 0.3% w/v, thus 0.2% w/v was selected, Figure 13. For SCPS dye, the optimum range was 0.05% - 0.2% w/v, thus 0.1% w/v was selected, Figure 14. For BPR dye, the optimum range was
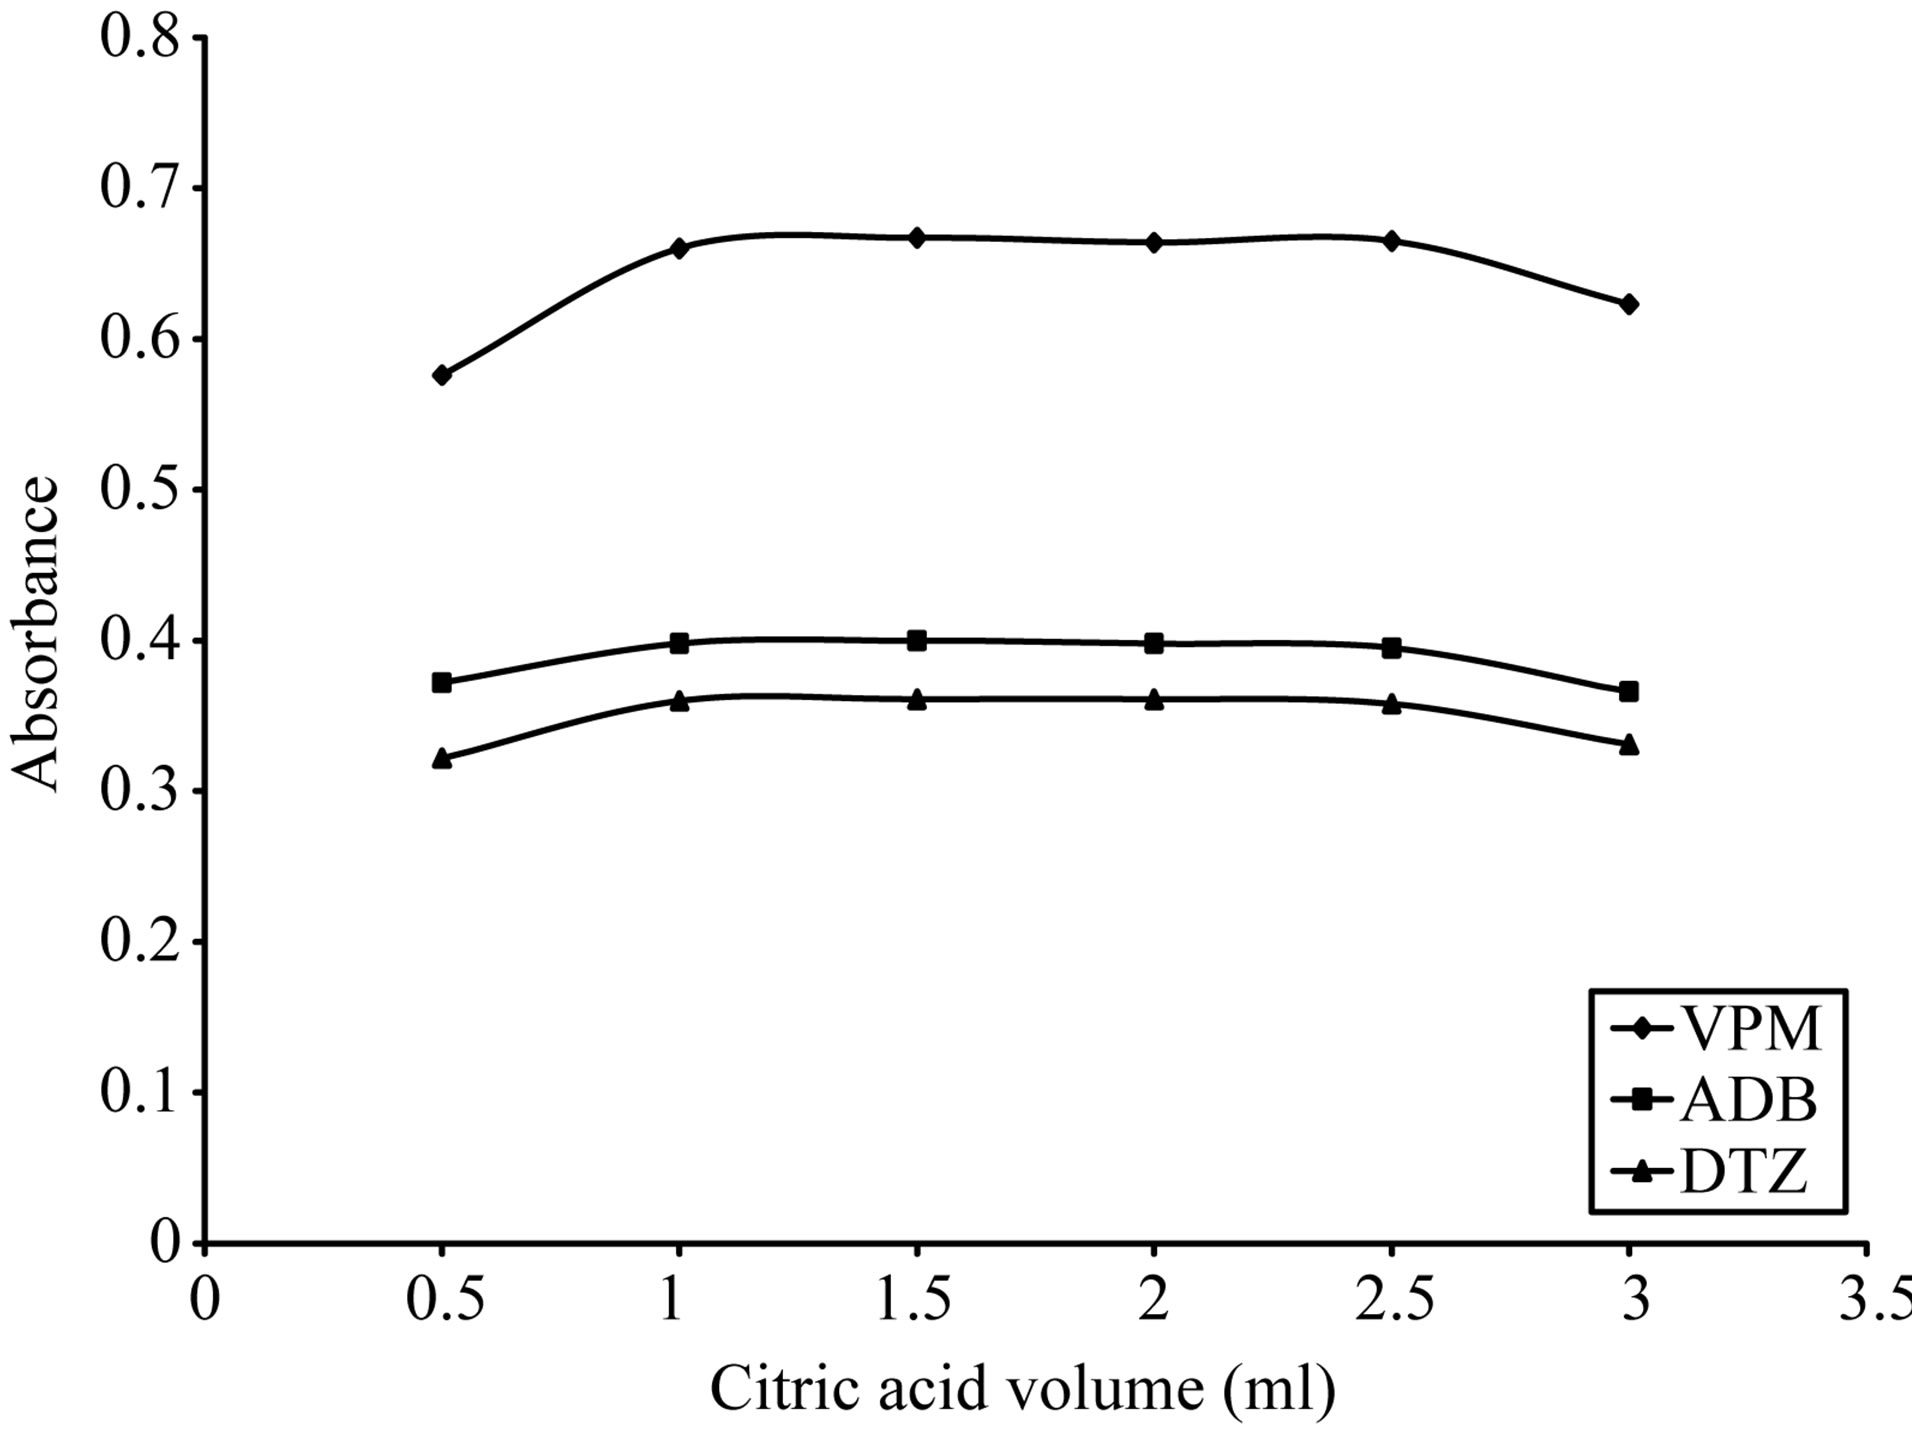
Figure 10. Effect of citric acid volume on the absorption spectra of the formed ion pair complex using 15 µg∙ml−1 of each studied drug and 0.2% w/v ECC.
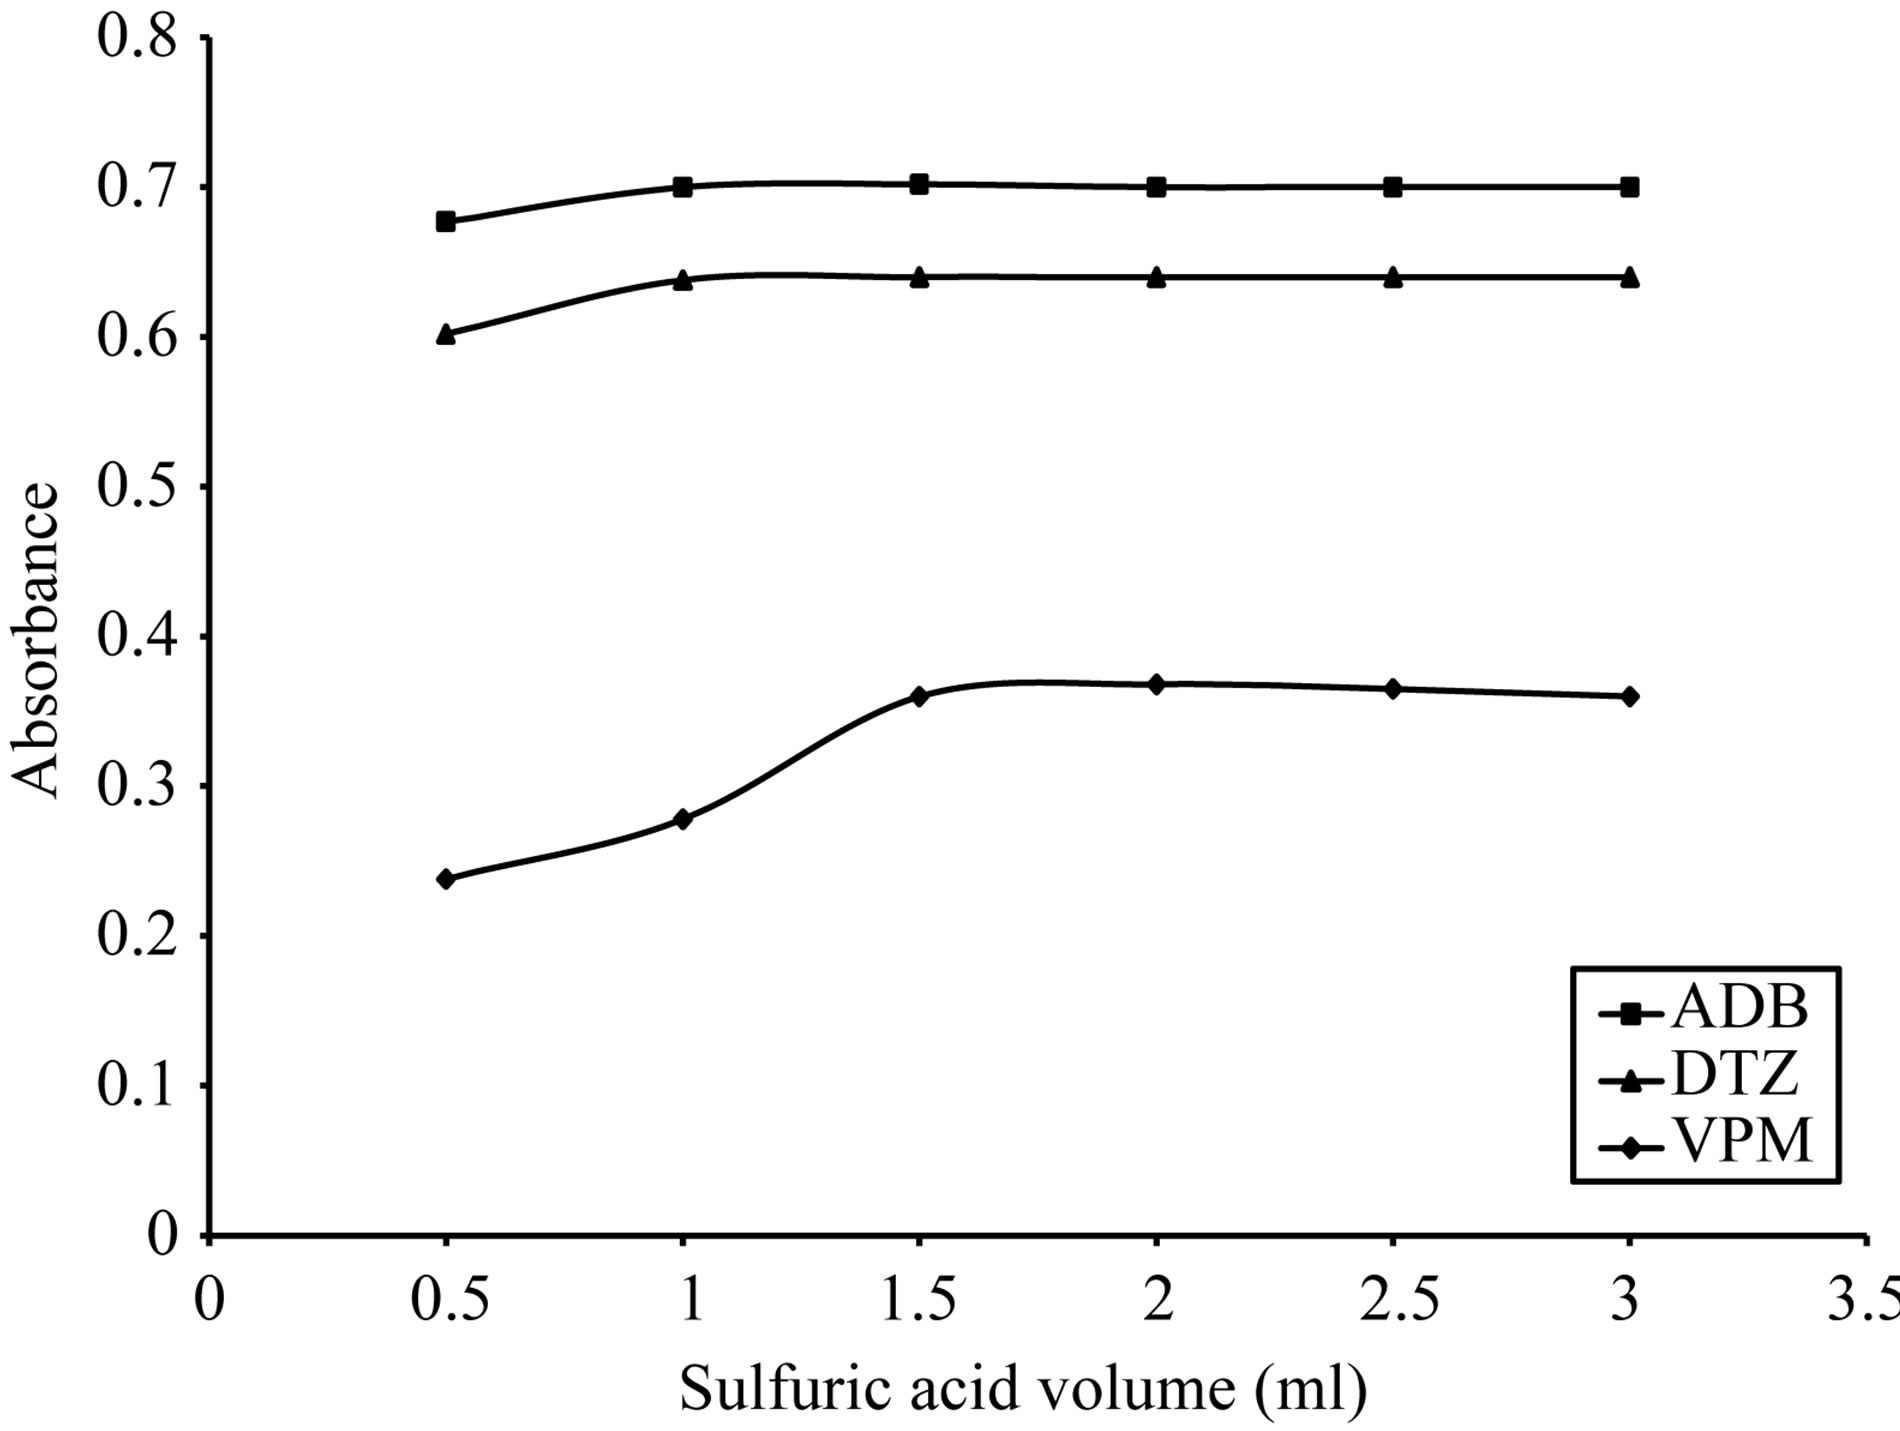
Figure 11. Effect of sulfuric acid volume on the absorption spectra of the formed ion pair complex using 50 µg∙ml−1 of each studied drug and 0.1% w/v SCPS.
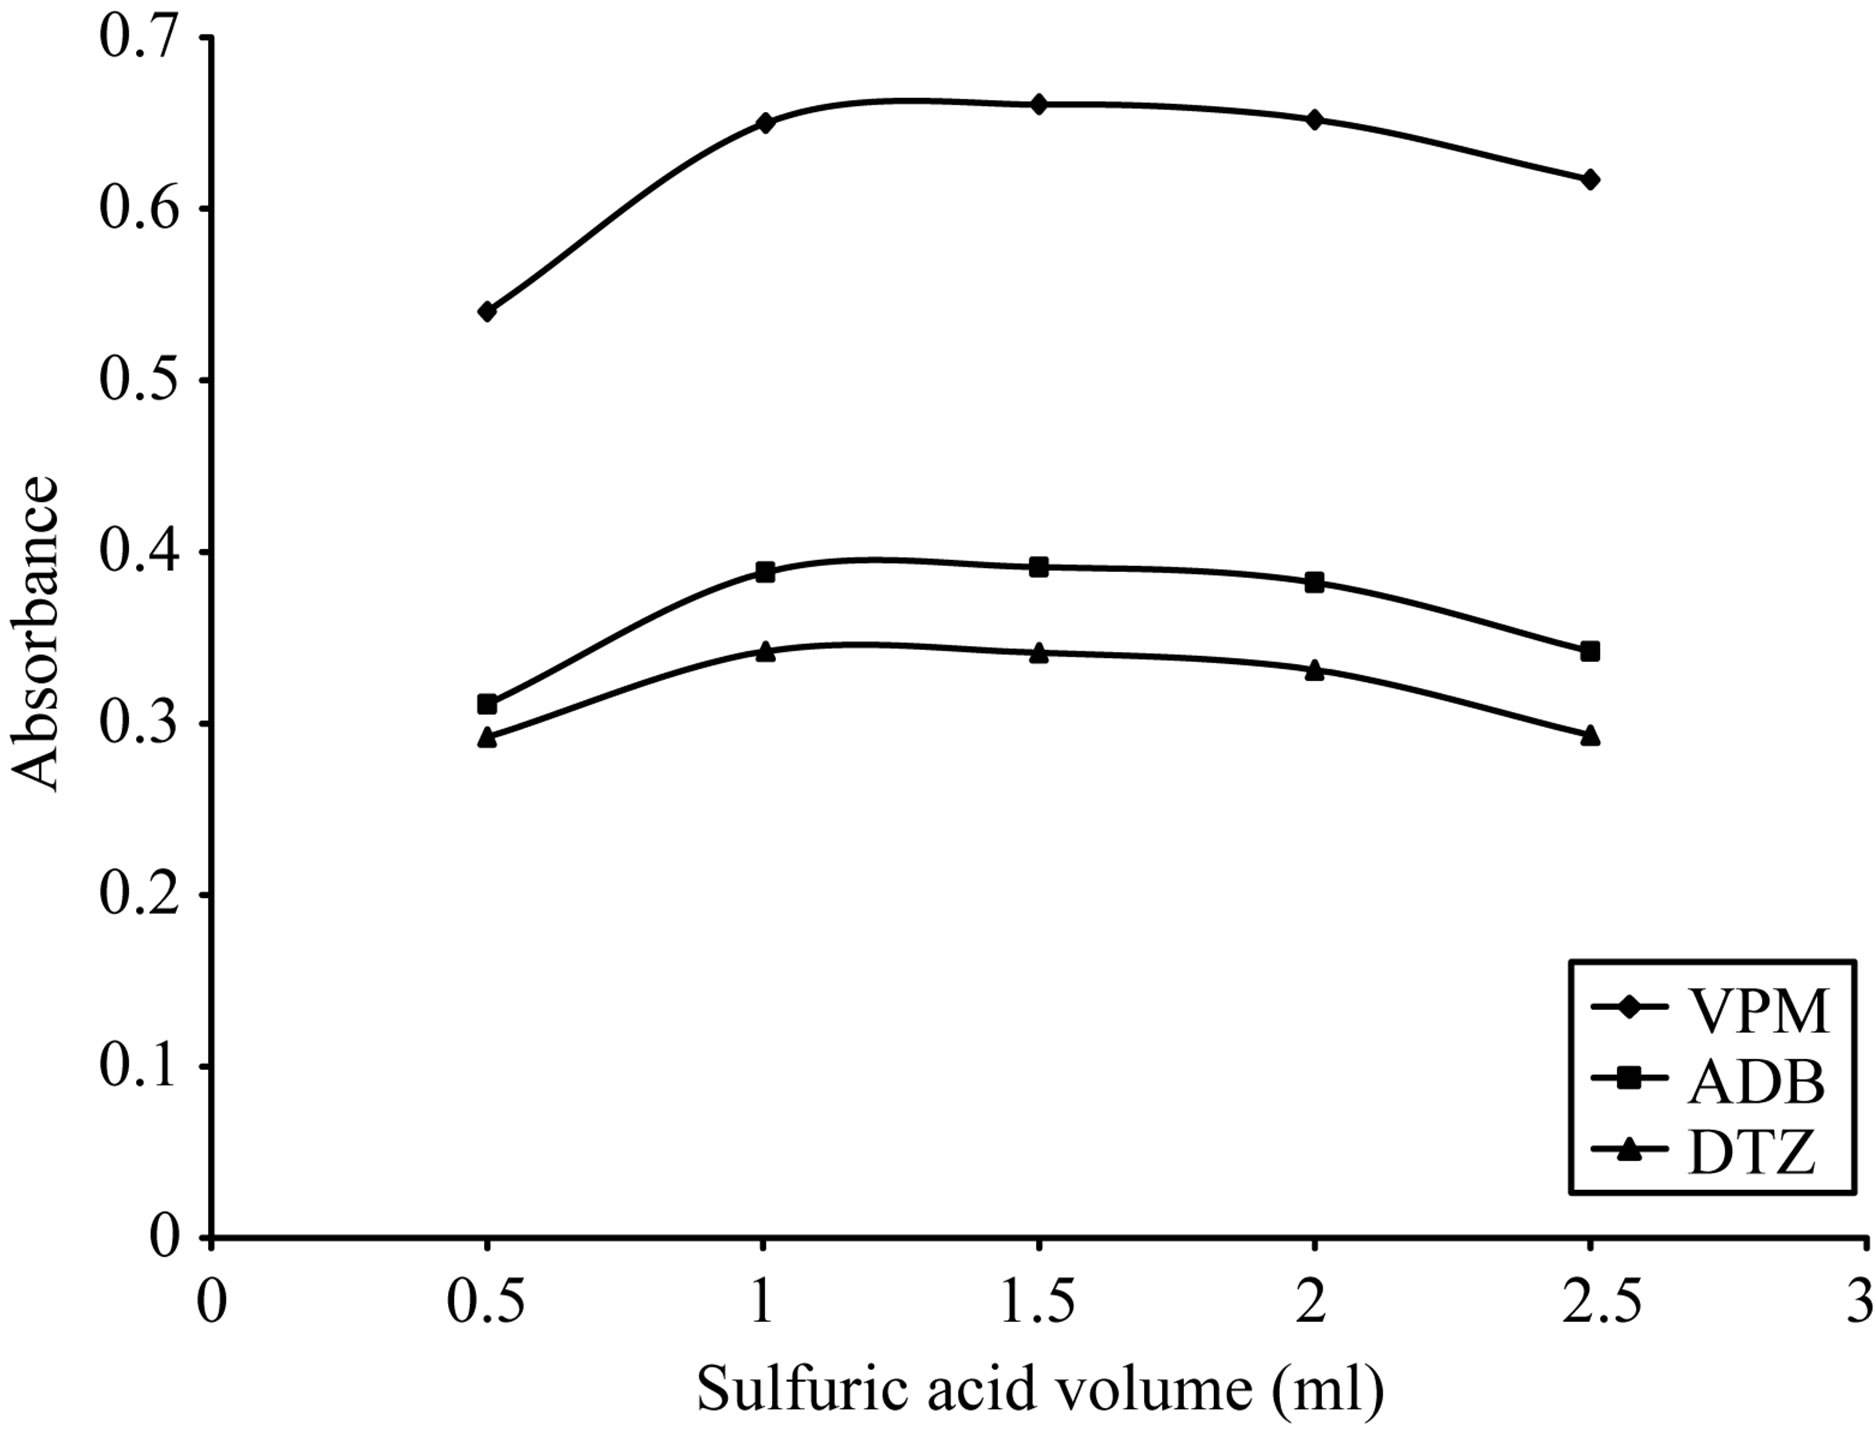
Figure 12. Effect of sulfuric acid volume on the absorption spectra of the formed ion pair complex using 30 µg∙ml−1 of each studied drug and 0.05% w/v BPR.
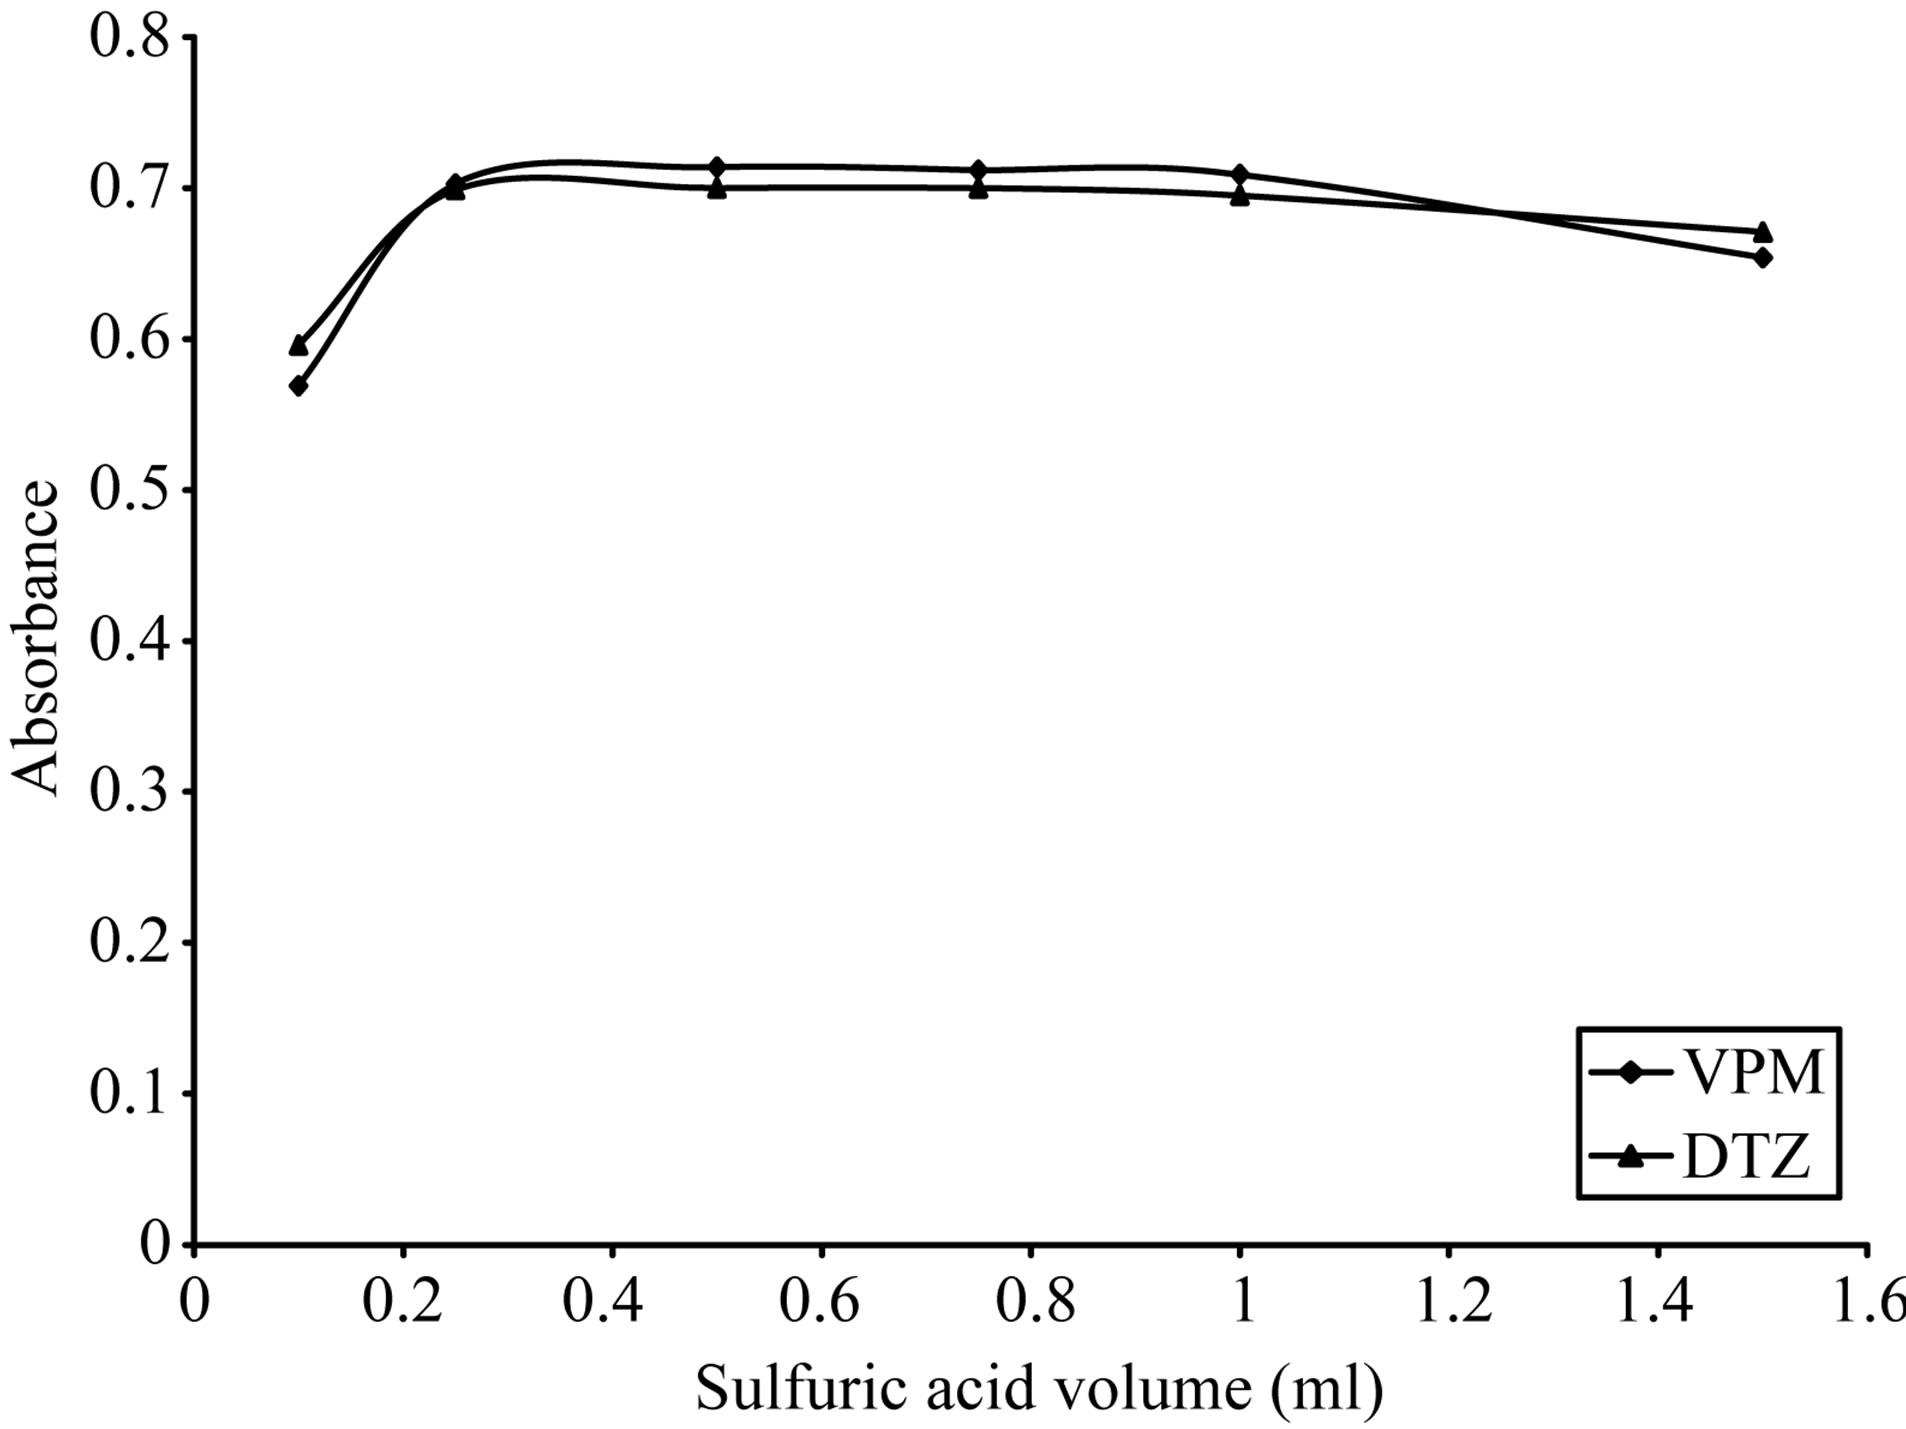
Figure 13. Effect of sulfuric acid volume on the absorption spectra of the formed ion pair complex using VPM 20 µg∙ml−1, DTZ 50 µg∙ml−1 and 0.1% w/v PCV.
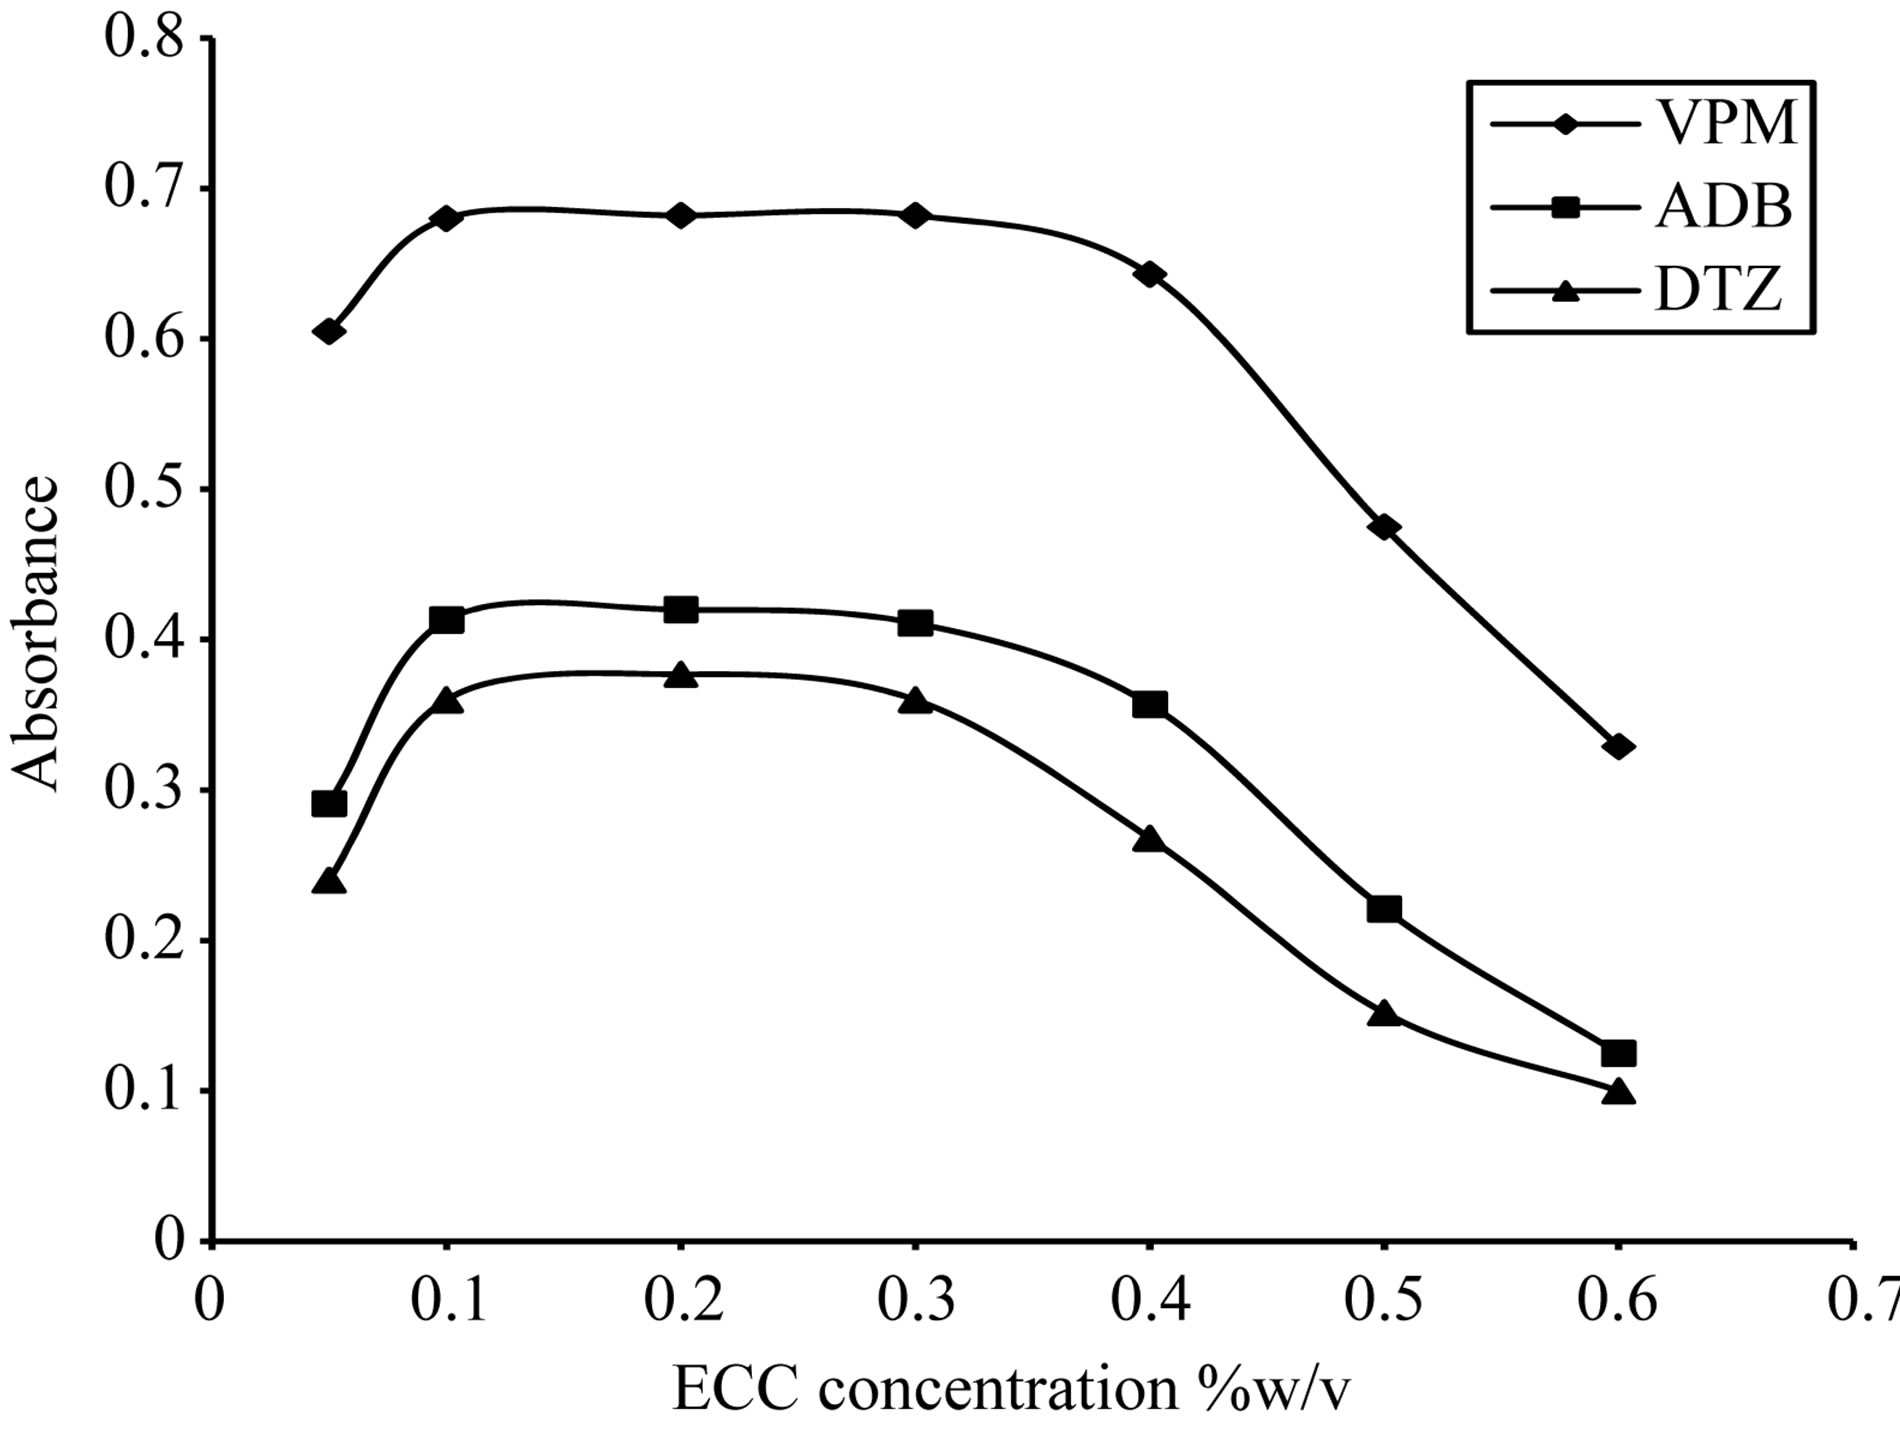
Figure 14. Effect of eriochrome cyanine concentration on the absorption spectra of the formed ion pair complex using 15 µg∙ml−1 of each studied drug.
0.03% - 0.07% w/v, thus 0.05% w/v was selected, Figure 15. For PCV dye the optimum range was 0.07% - 0.2% w/v, thus 0.1% w/v was selected, Figure 16. Then the formed colored complex was extracted using different volumes of dyes. For ECC dye, optimum range was 0.5 - 3 ml, thus 2 ml for DTZ and 1.5 ml for both ADB and VPM was selected, Figure 17. For SCPS and BPR dyes, the optimum range were 0.25 - 2 ml and 0.5 - 2 ml respectively, thus 1.5 ml for each drug was selected, Figures 18 and 19. For PCV dye, the optimum range was 0.5 - 2.5 ml, thus 1.5 ml in case DTZ and 2 ml in case of VPM was selected, Figure 20 and 21.
3.3. Analytical Data
Standard calibration graphs for the studied drugs with each dye were constructed by analyzing a series of concentrations of the drugs. Beer’s plots showed linear cor-
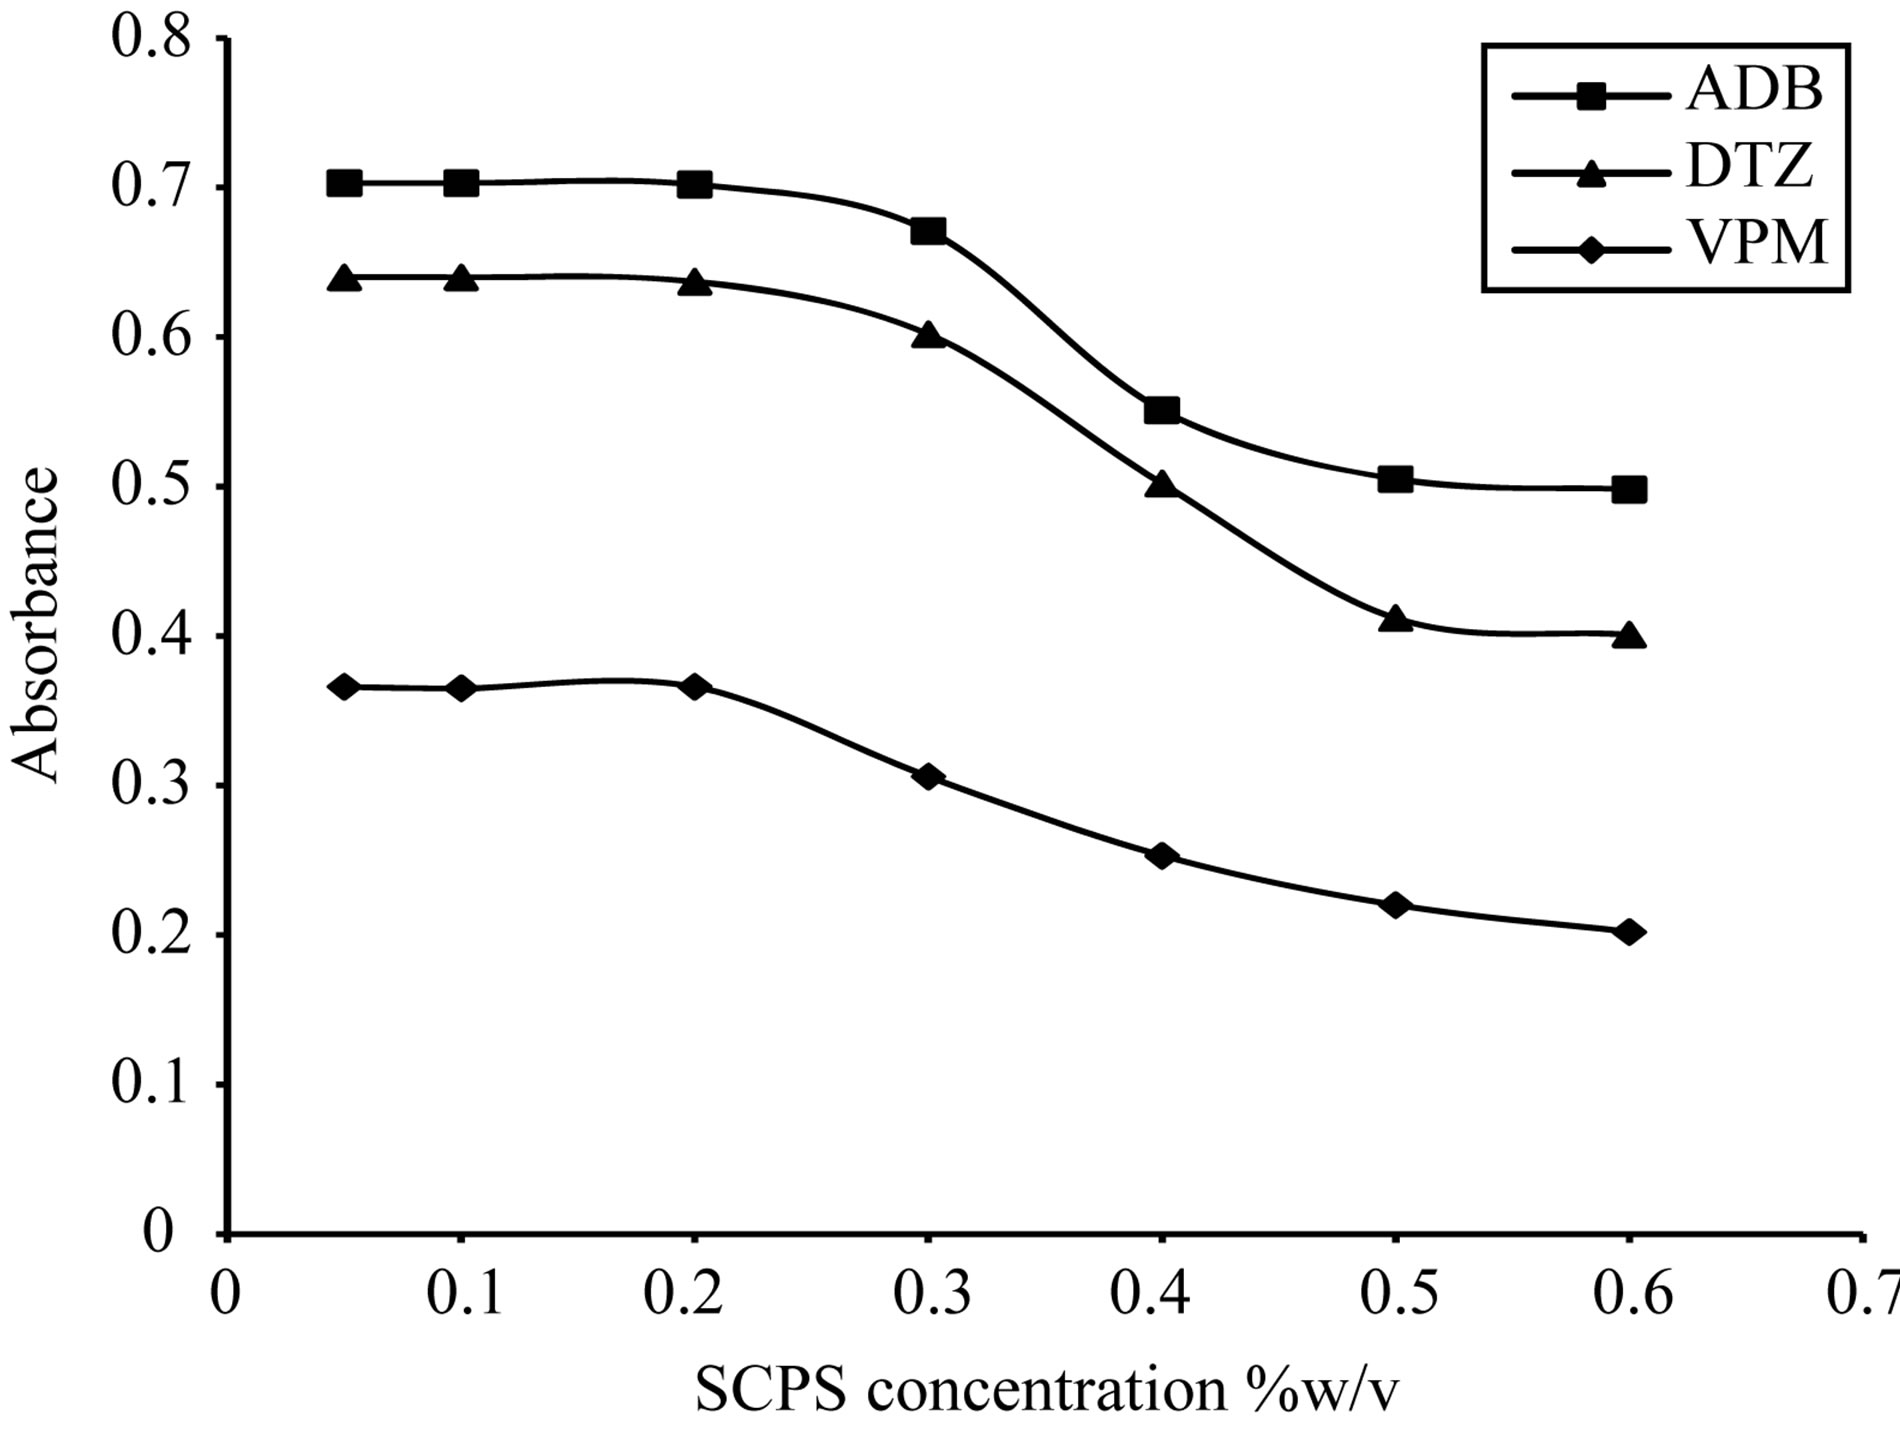
Figure 15. Effect of Sulfochlorophenol-S concentration on the absorption spectra of the formed ion pair complex using 50 µg∙ml−1 of each studied drug.
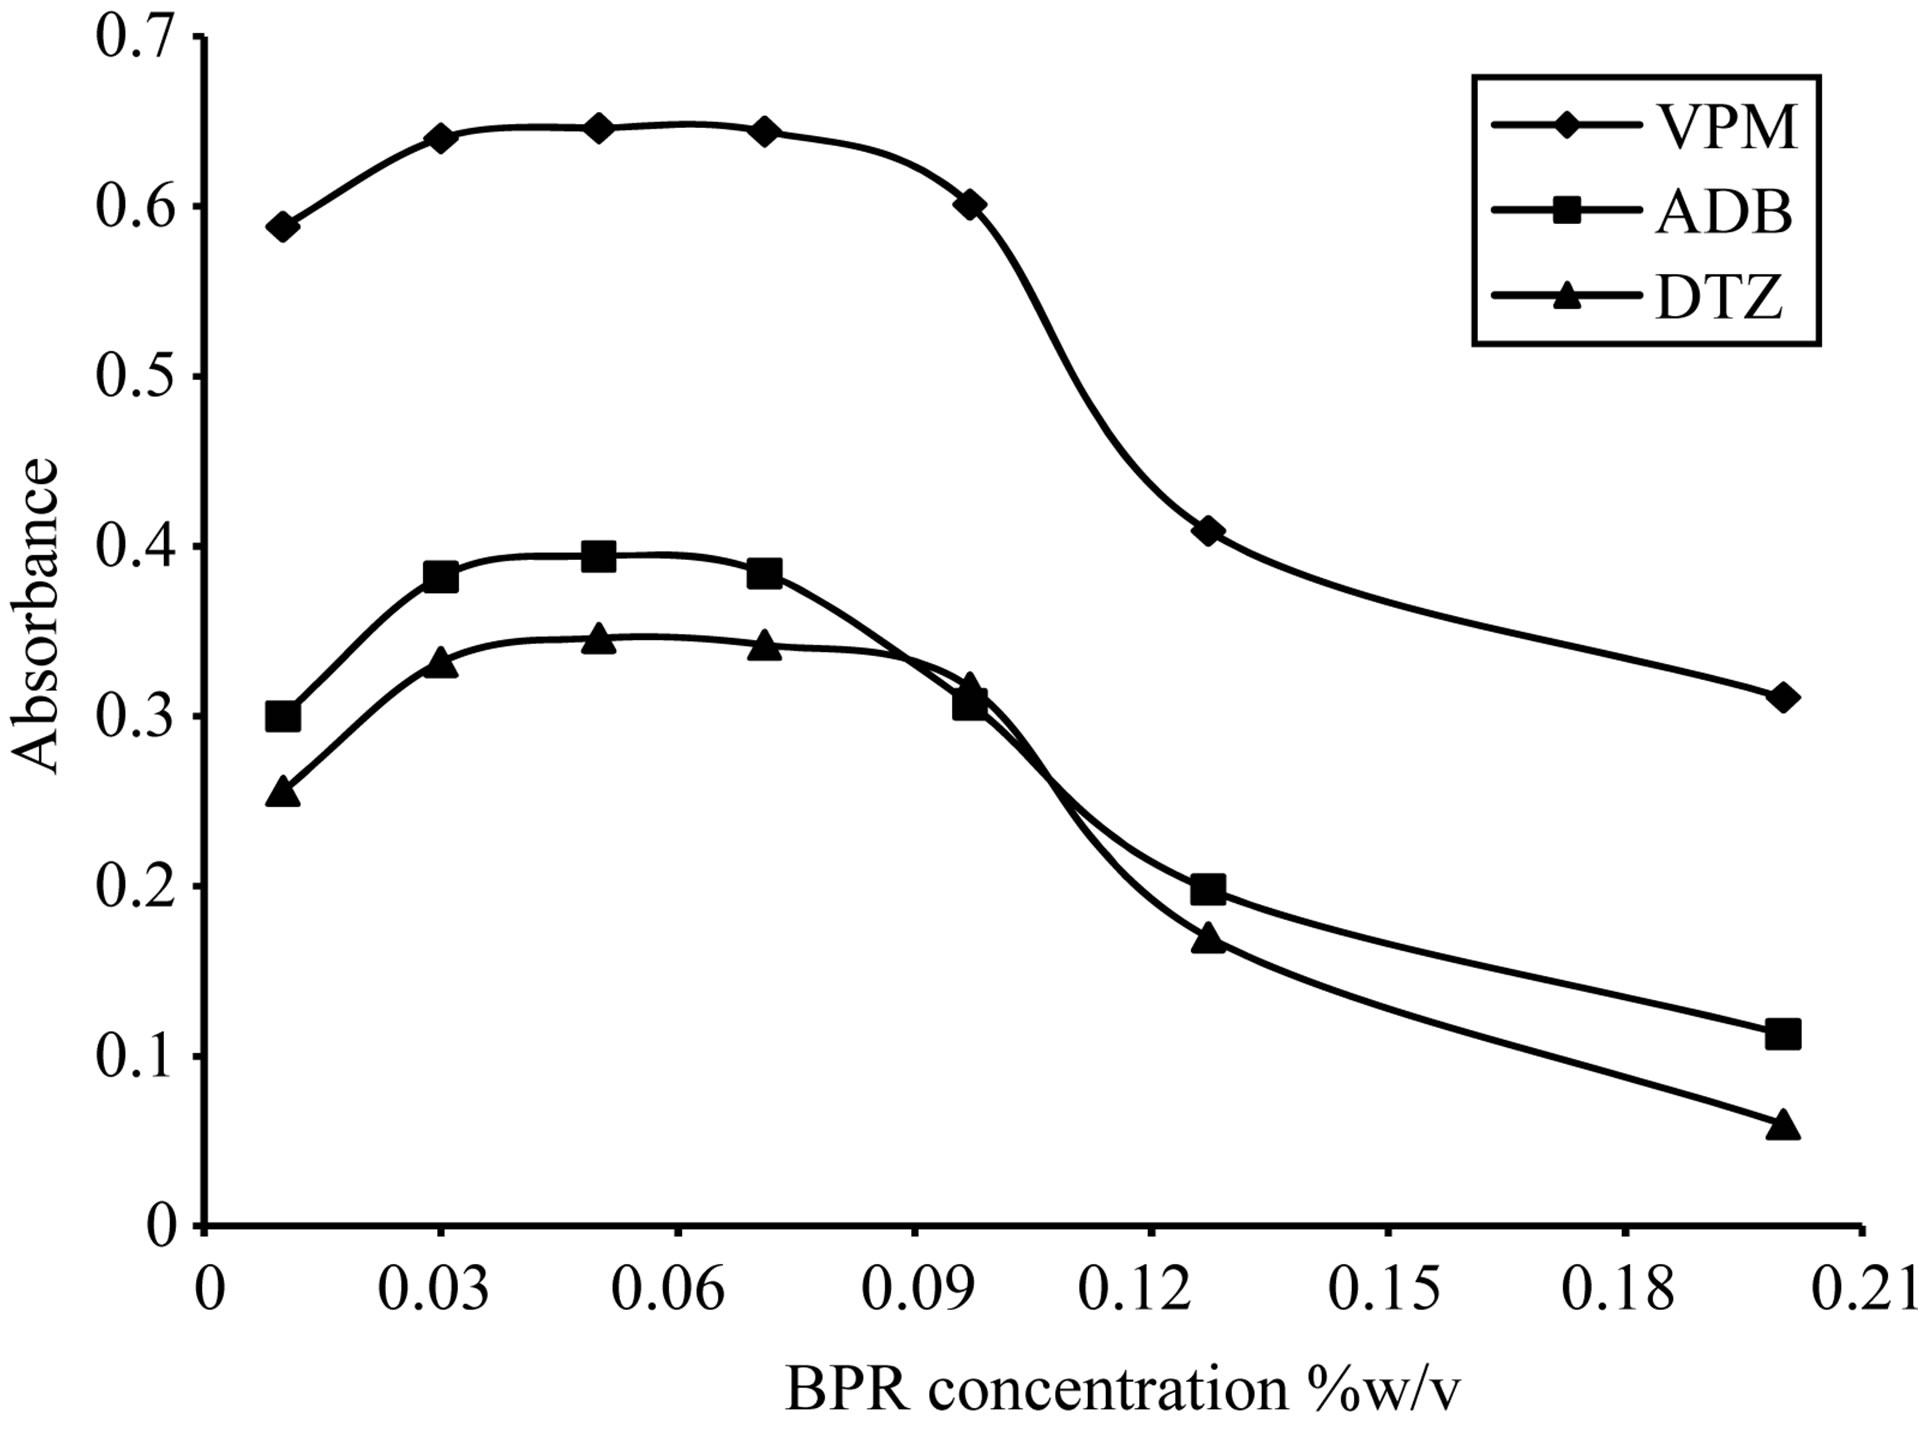
Figure 16. Effect of Bromopyrogallol red concentration on the absorption spectra of the formed ion pair complex using 30 µg∙ml−1 of each studied drug.
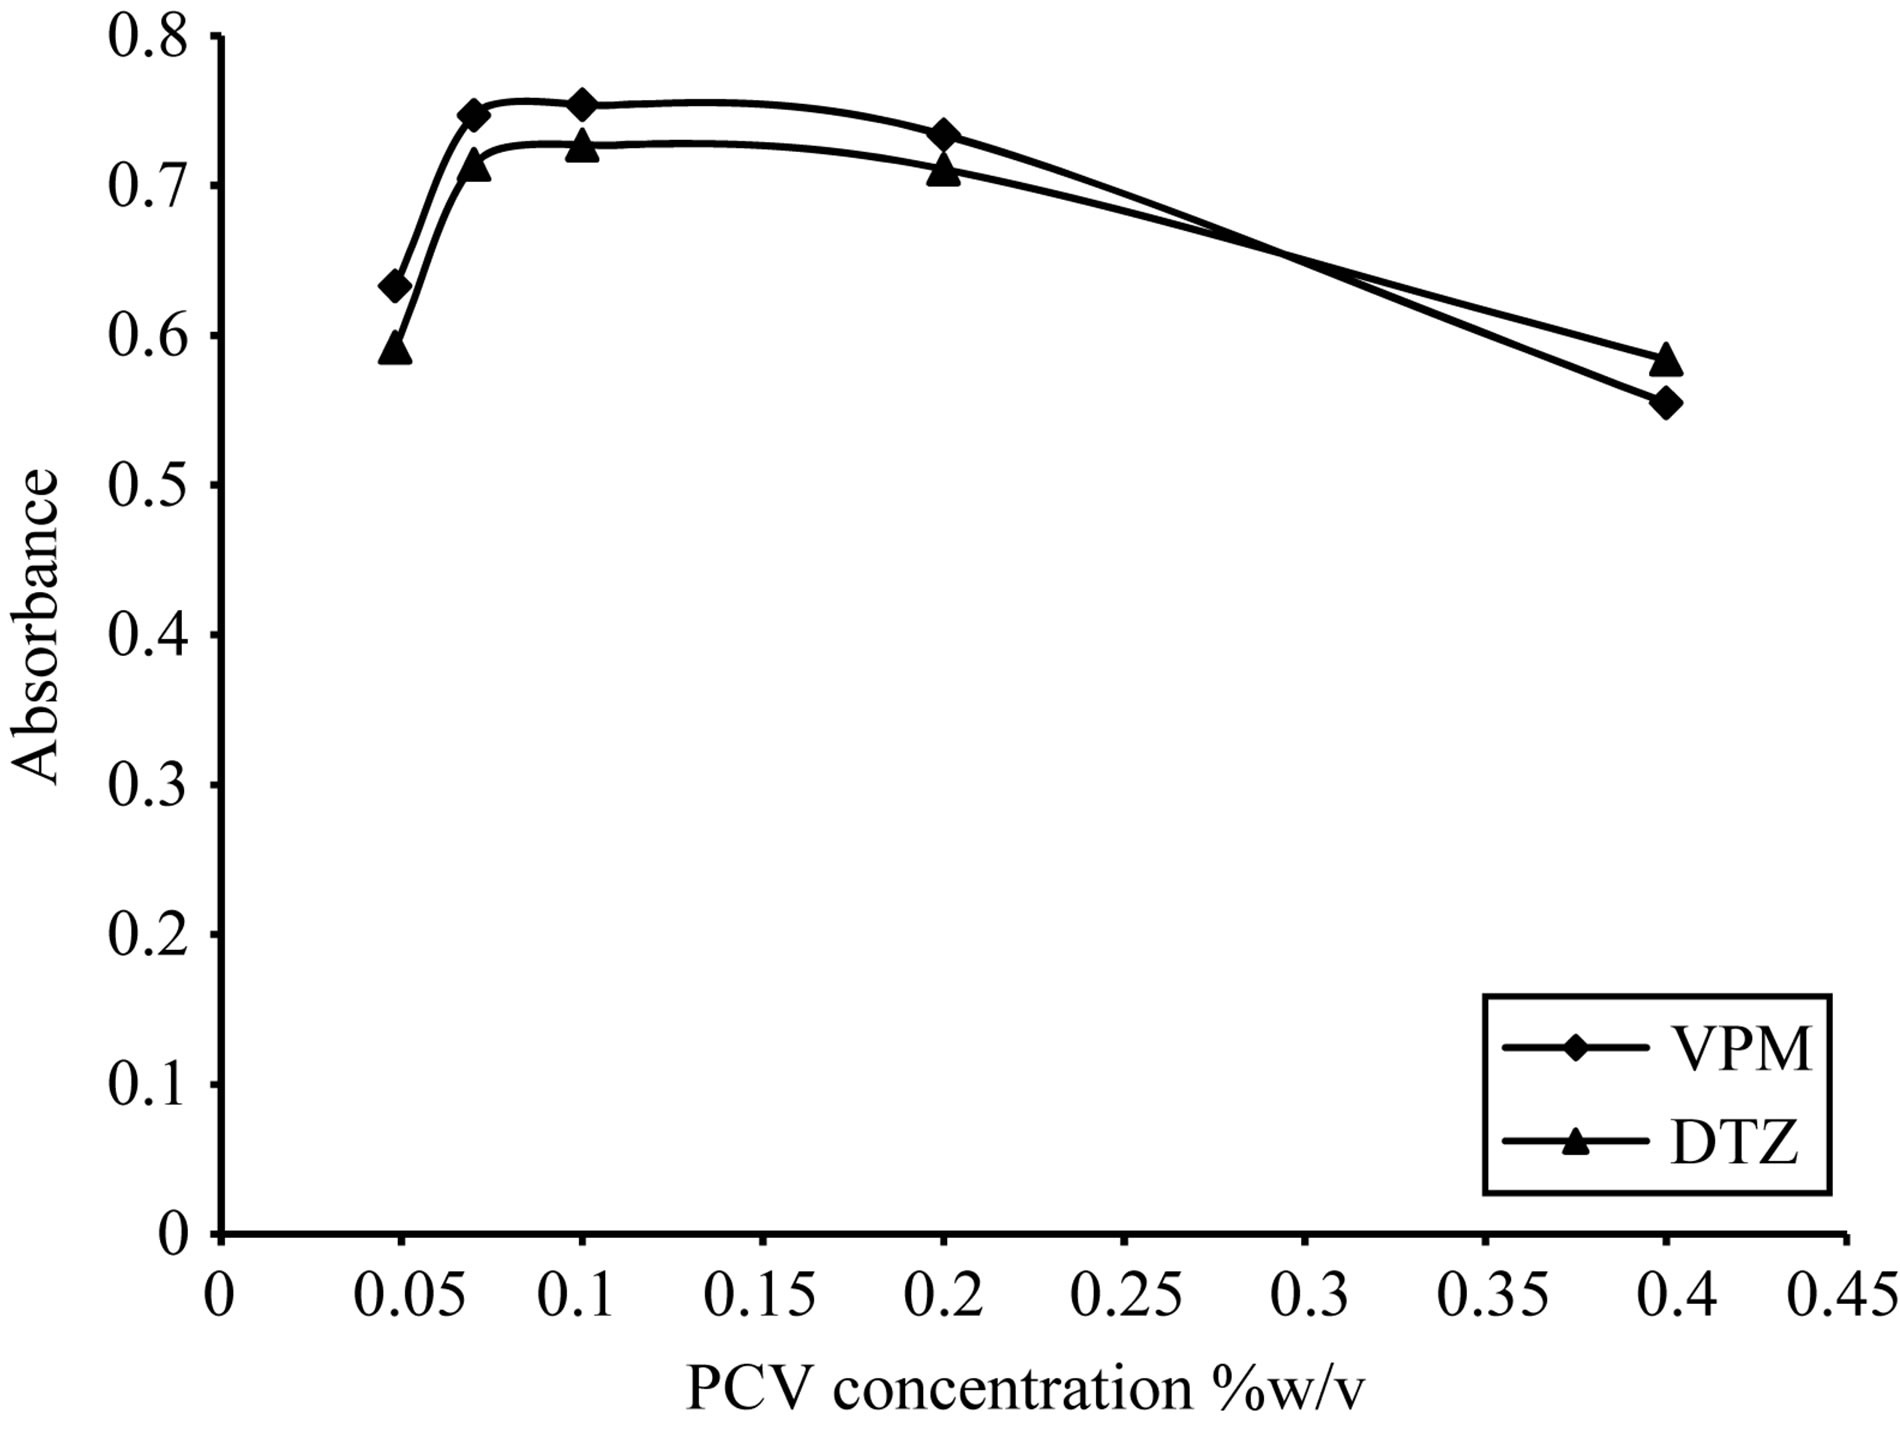
Figure 17. Effect of pyrocatechol violet concentration on the absorption spectra of the formed ion pair complex using VPM 20 µg∙ml−1, DTZ 50 µg∙ml−1.
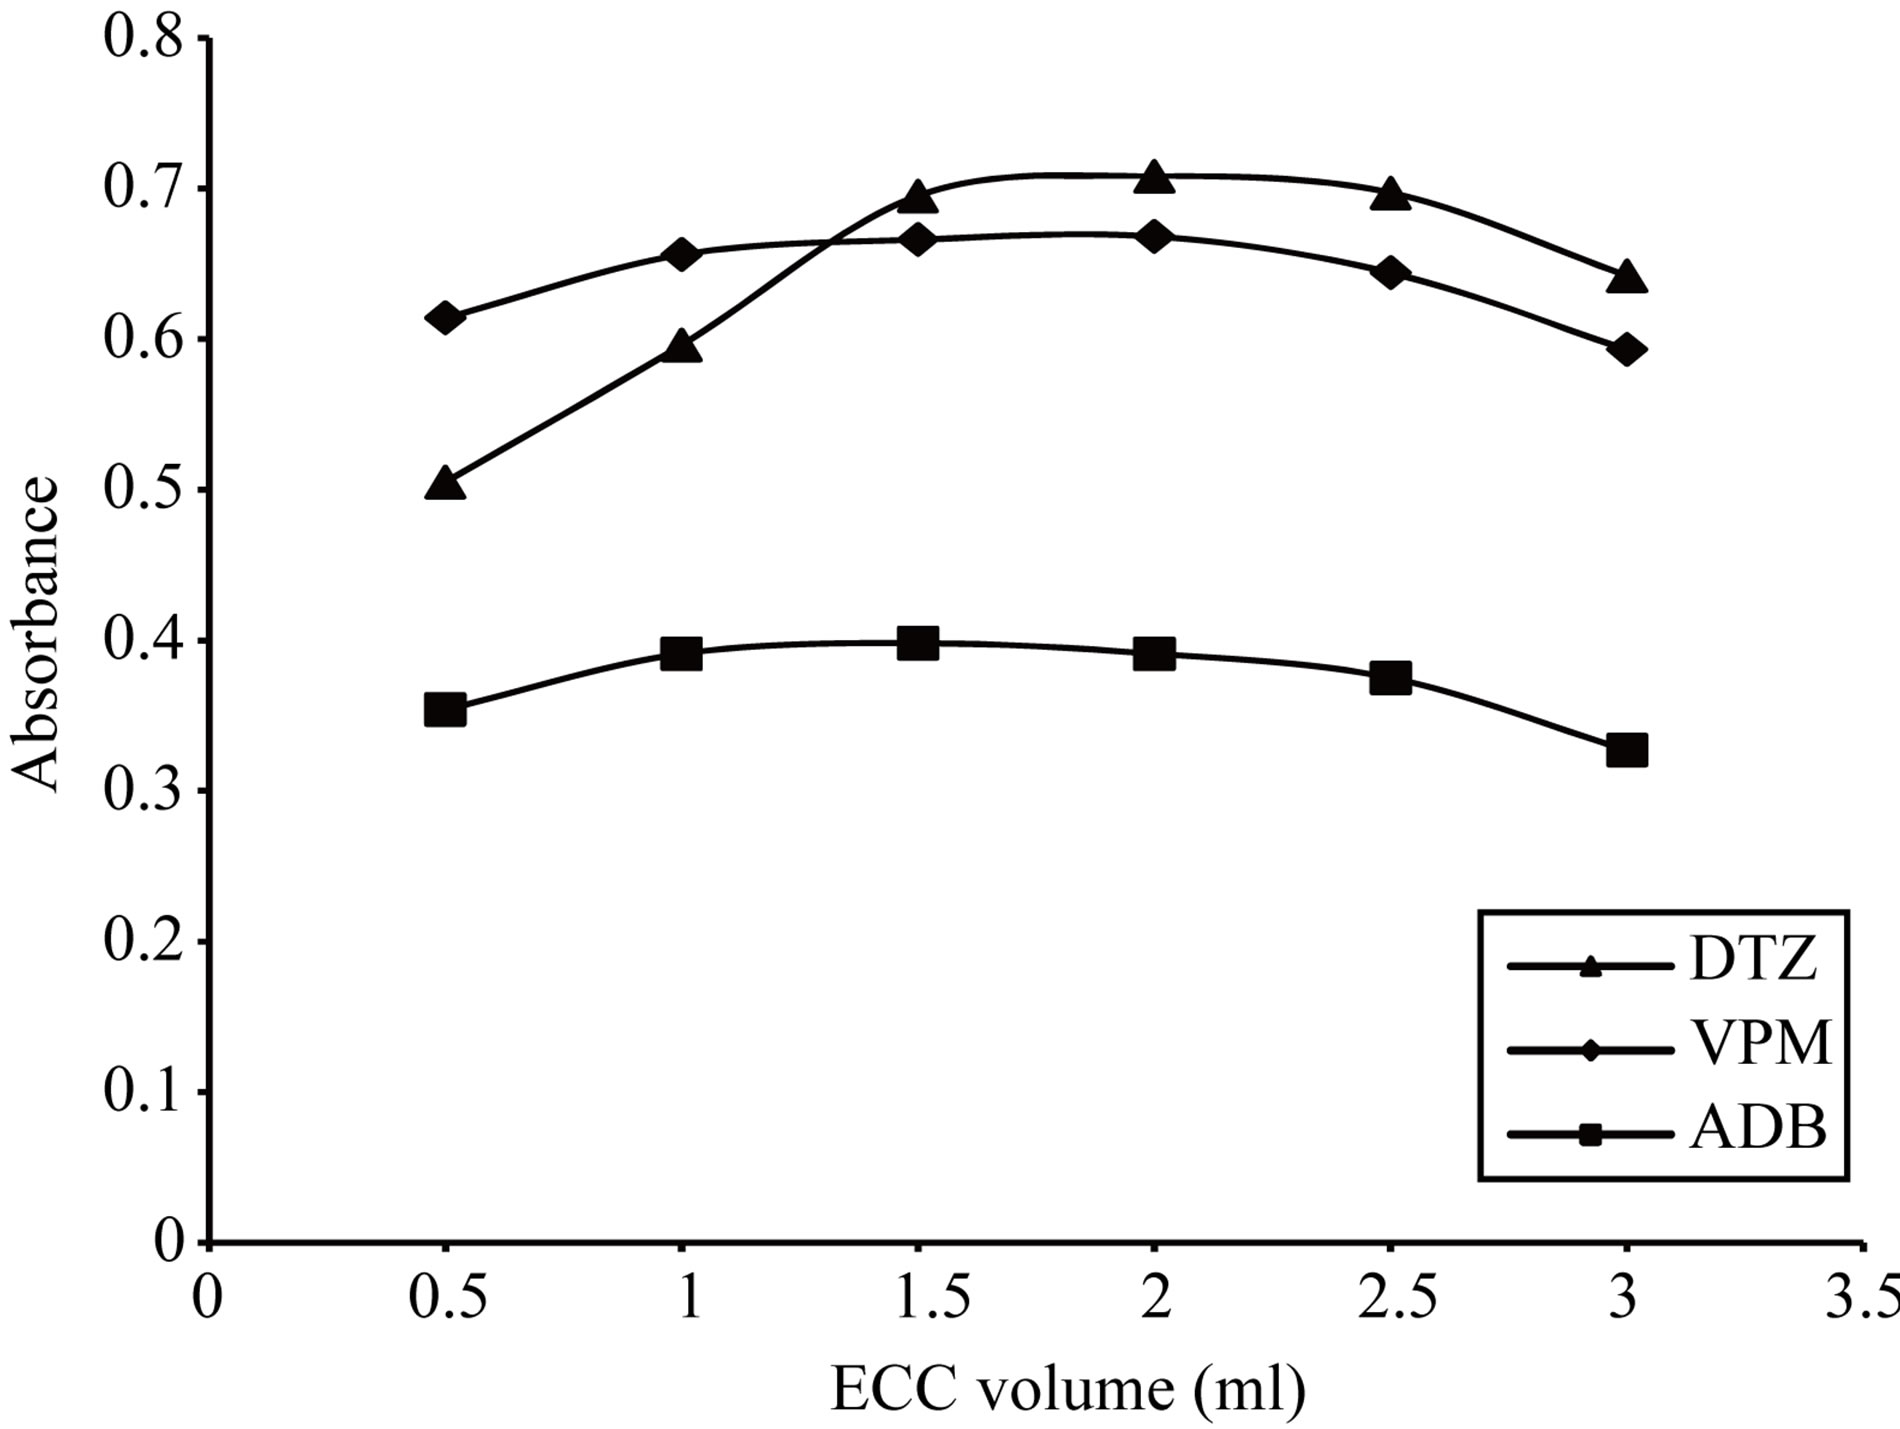
Figure 18. Effect of eriochrome cyanine concentration on the absorption spectra of the formed ion pair complex using 15 µg∙ml−1 of each studied drug.
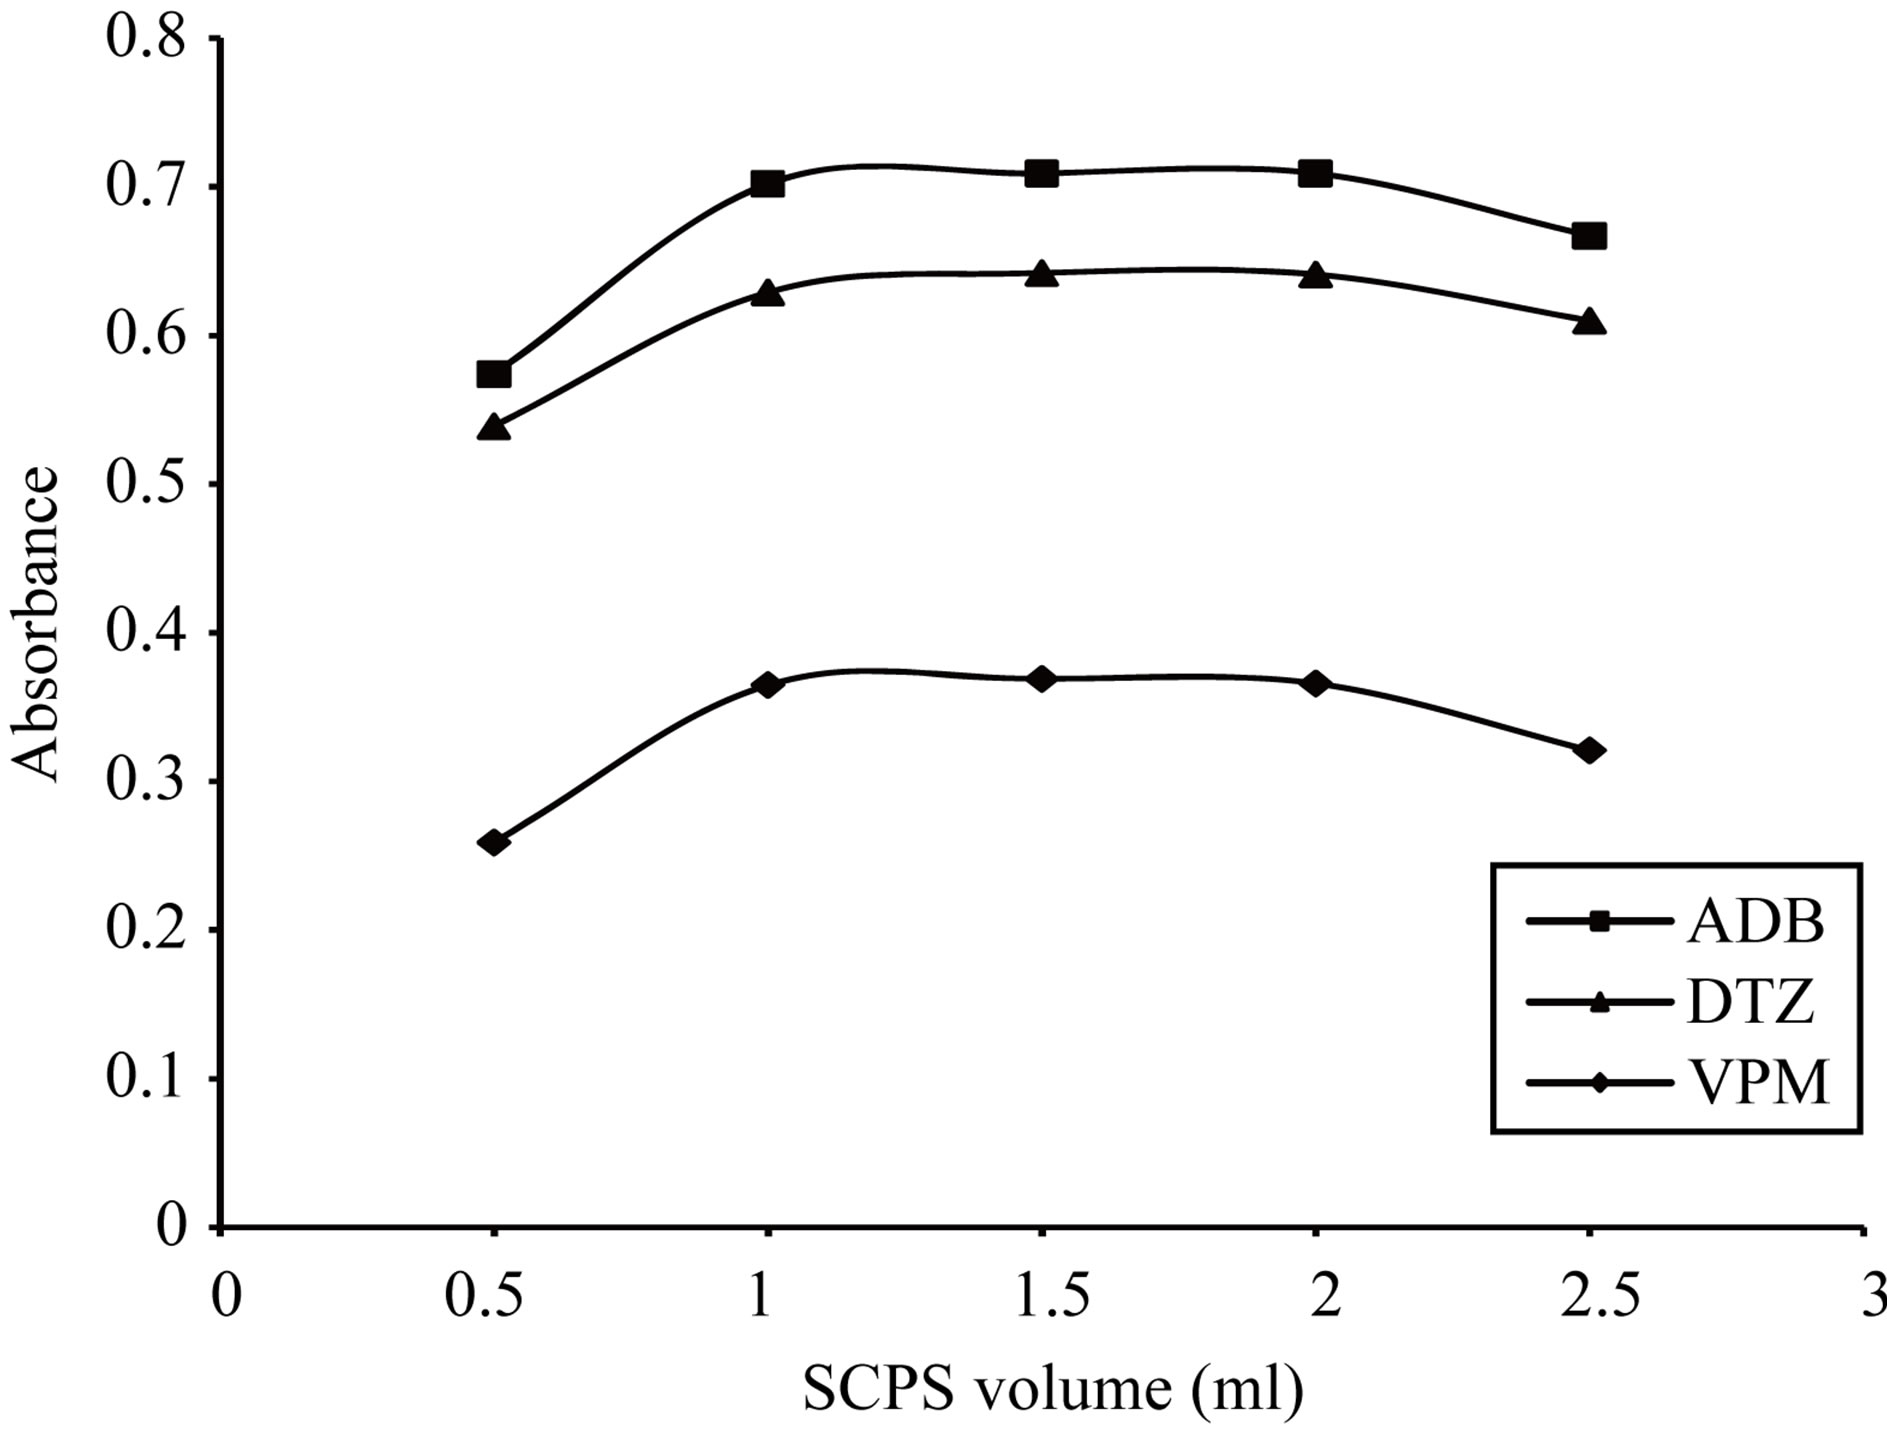
Figure 19. Effect of 0.1% w/v Sulfochlorophenol-S volume on the absorption spectra of the formed ion pair complex using 50 µg∙ml−1 of each studied drug.
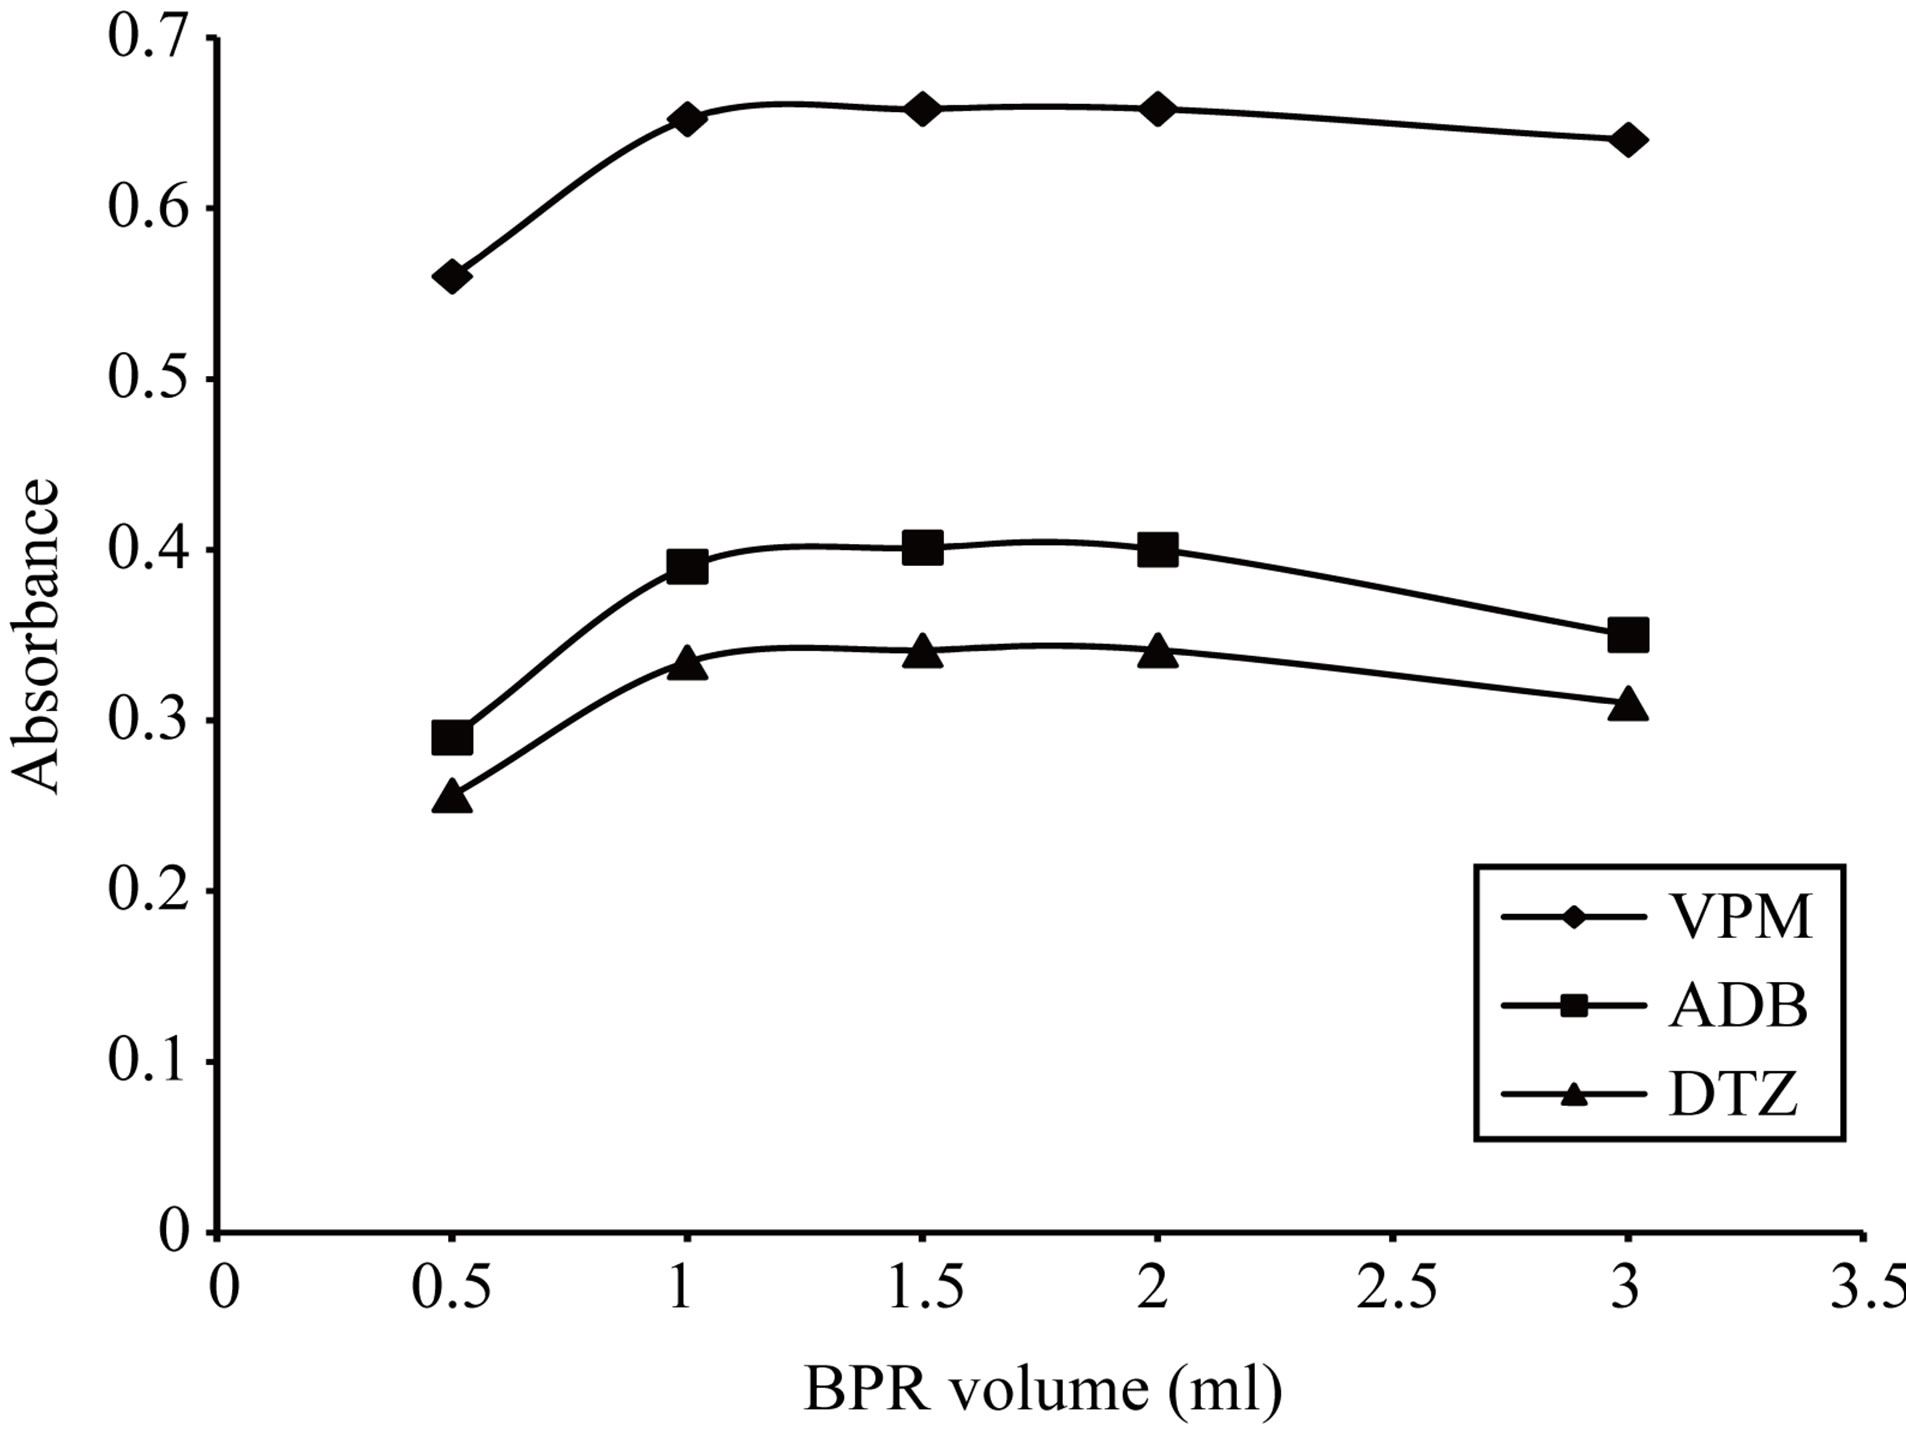
Figure 20. Effect of 0.05% w/v Bromopyrogallol red volume on the absorption spectra of the formed ion pair complex using 30 µg∙ml−1 of each studied drug.
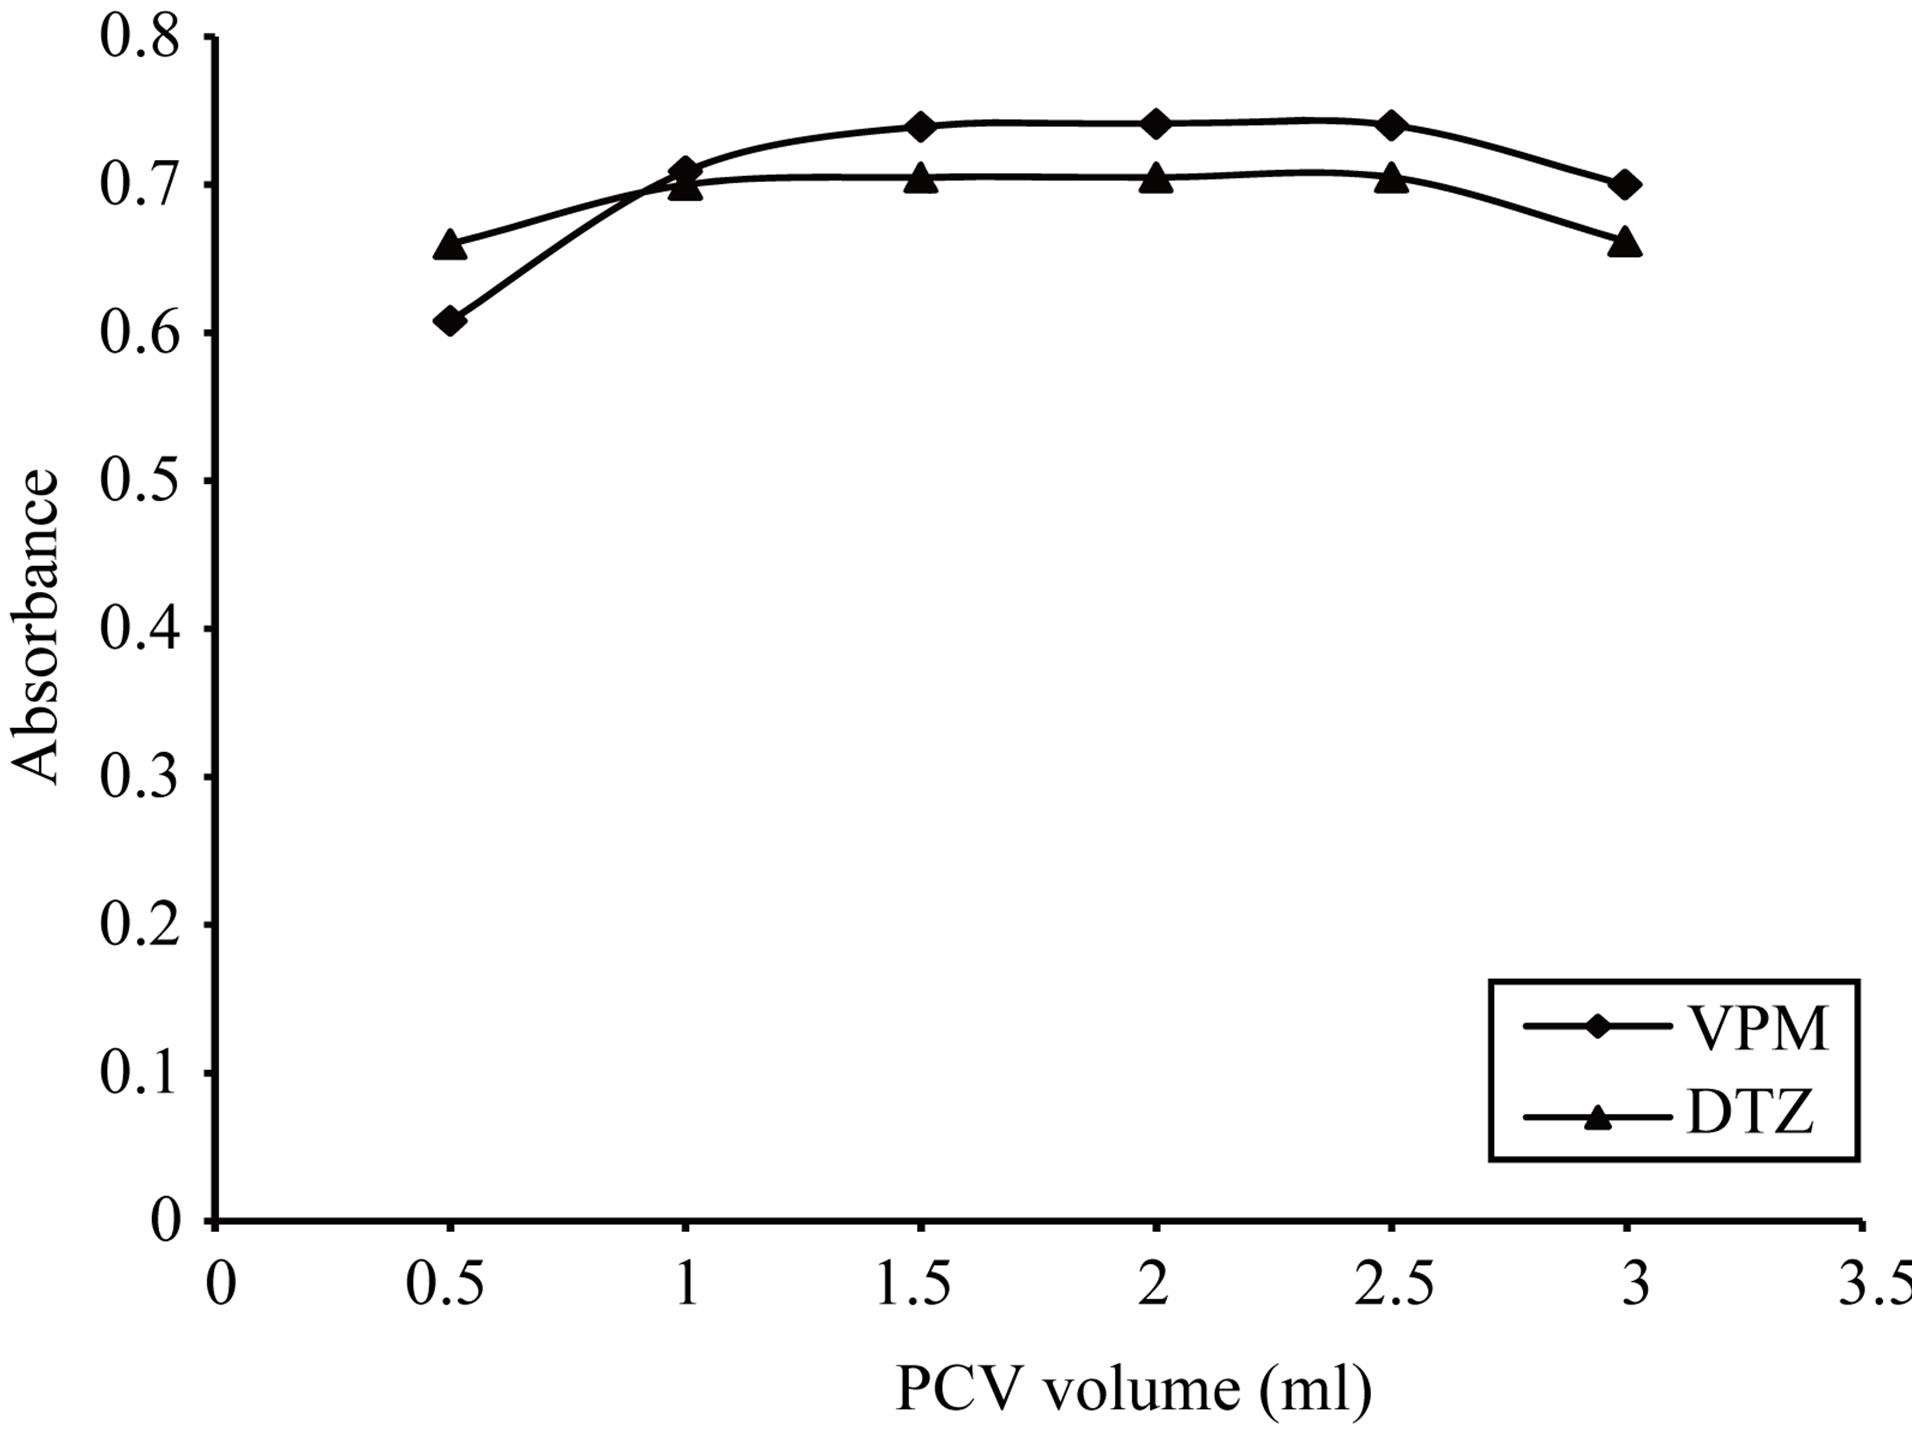
Figure 21. Effect of 0.1% w/v pyrocatechol violet volume on the absorption spectra of the formed ion pair complex using VPM 20 µg∙ml−1 and DTZ 50 µg∙ml−1.
relations over a wide range of drug concentrations with good correlation coefficients. Data of such studies are illustrated in Table 2. The slopes (b) of the calibration curves indicated the high sensitivity of the proposed method while the small intercept reflected the low interfering background [37].
The accuracy of the proposed method was demonstrated by recovery experiments, which were carried out by adding a fixed amount of pure drug to pre-analyzed dosage forms. The analytical results obtained were summarized in Table 3. The percentage of RSDs can be considered to be very satisfactory.
The performance of the proposed methods was statistically compared with those of reported ones [38-40] using student’s t-test and the variance ratio F-test [41], Table 4. This comparison did not show any significance differences indicating good accuracy and high sensitivity of the proposed procedure.
The effect of the presence common excipients such as: starch, lactose, sucrose, glucose, magnesium stearate, gum acacia and talc was studied. The excellent recoveries, obtained in Table 5 for ECC as representative example, indicated that the presence of these excipients did not interfere with the proposed method. This could be explained on the basis that all these additives are natural and almost non extractable by organic solvents as well as very or non basic at all and so they do not contribute in the reaction.
The Precision [42] of the proposed method was checked by replicate analysis of five separate standard solutions of each compound at three concentration levels. The calculated relative standard deviation values were below 2% indicating good repeatability and reliability of the proposed method [37,43]. The results and their statistical analysis were summarized in Table 6. for ECC as representative example.
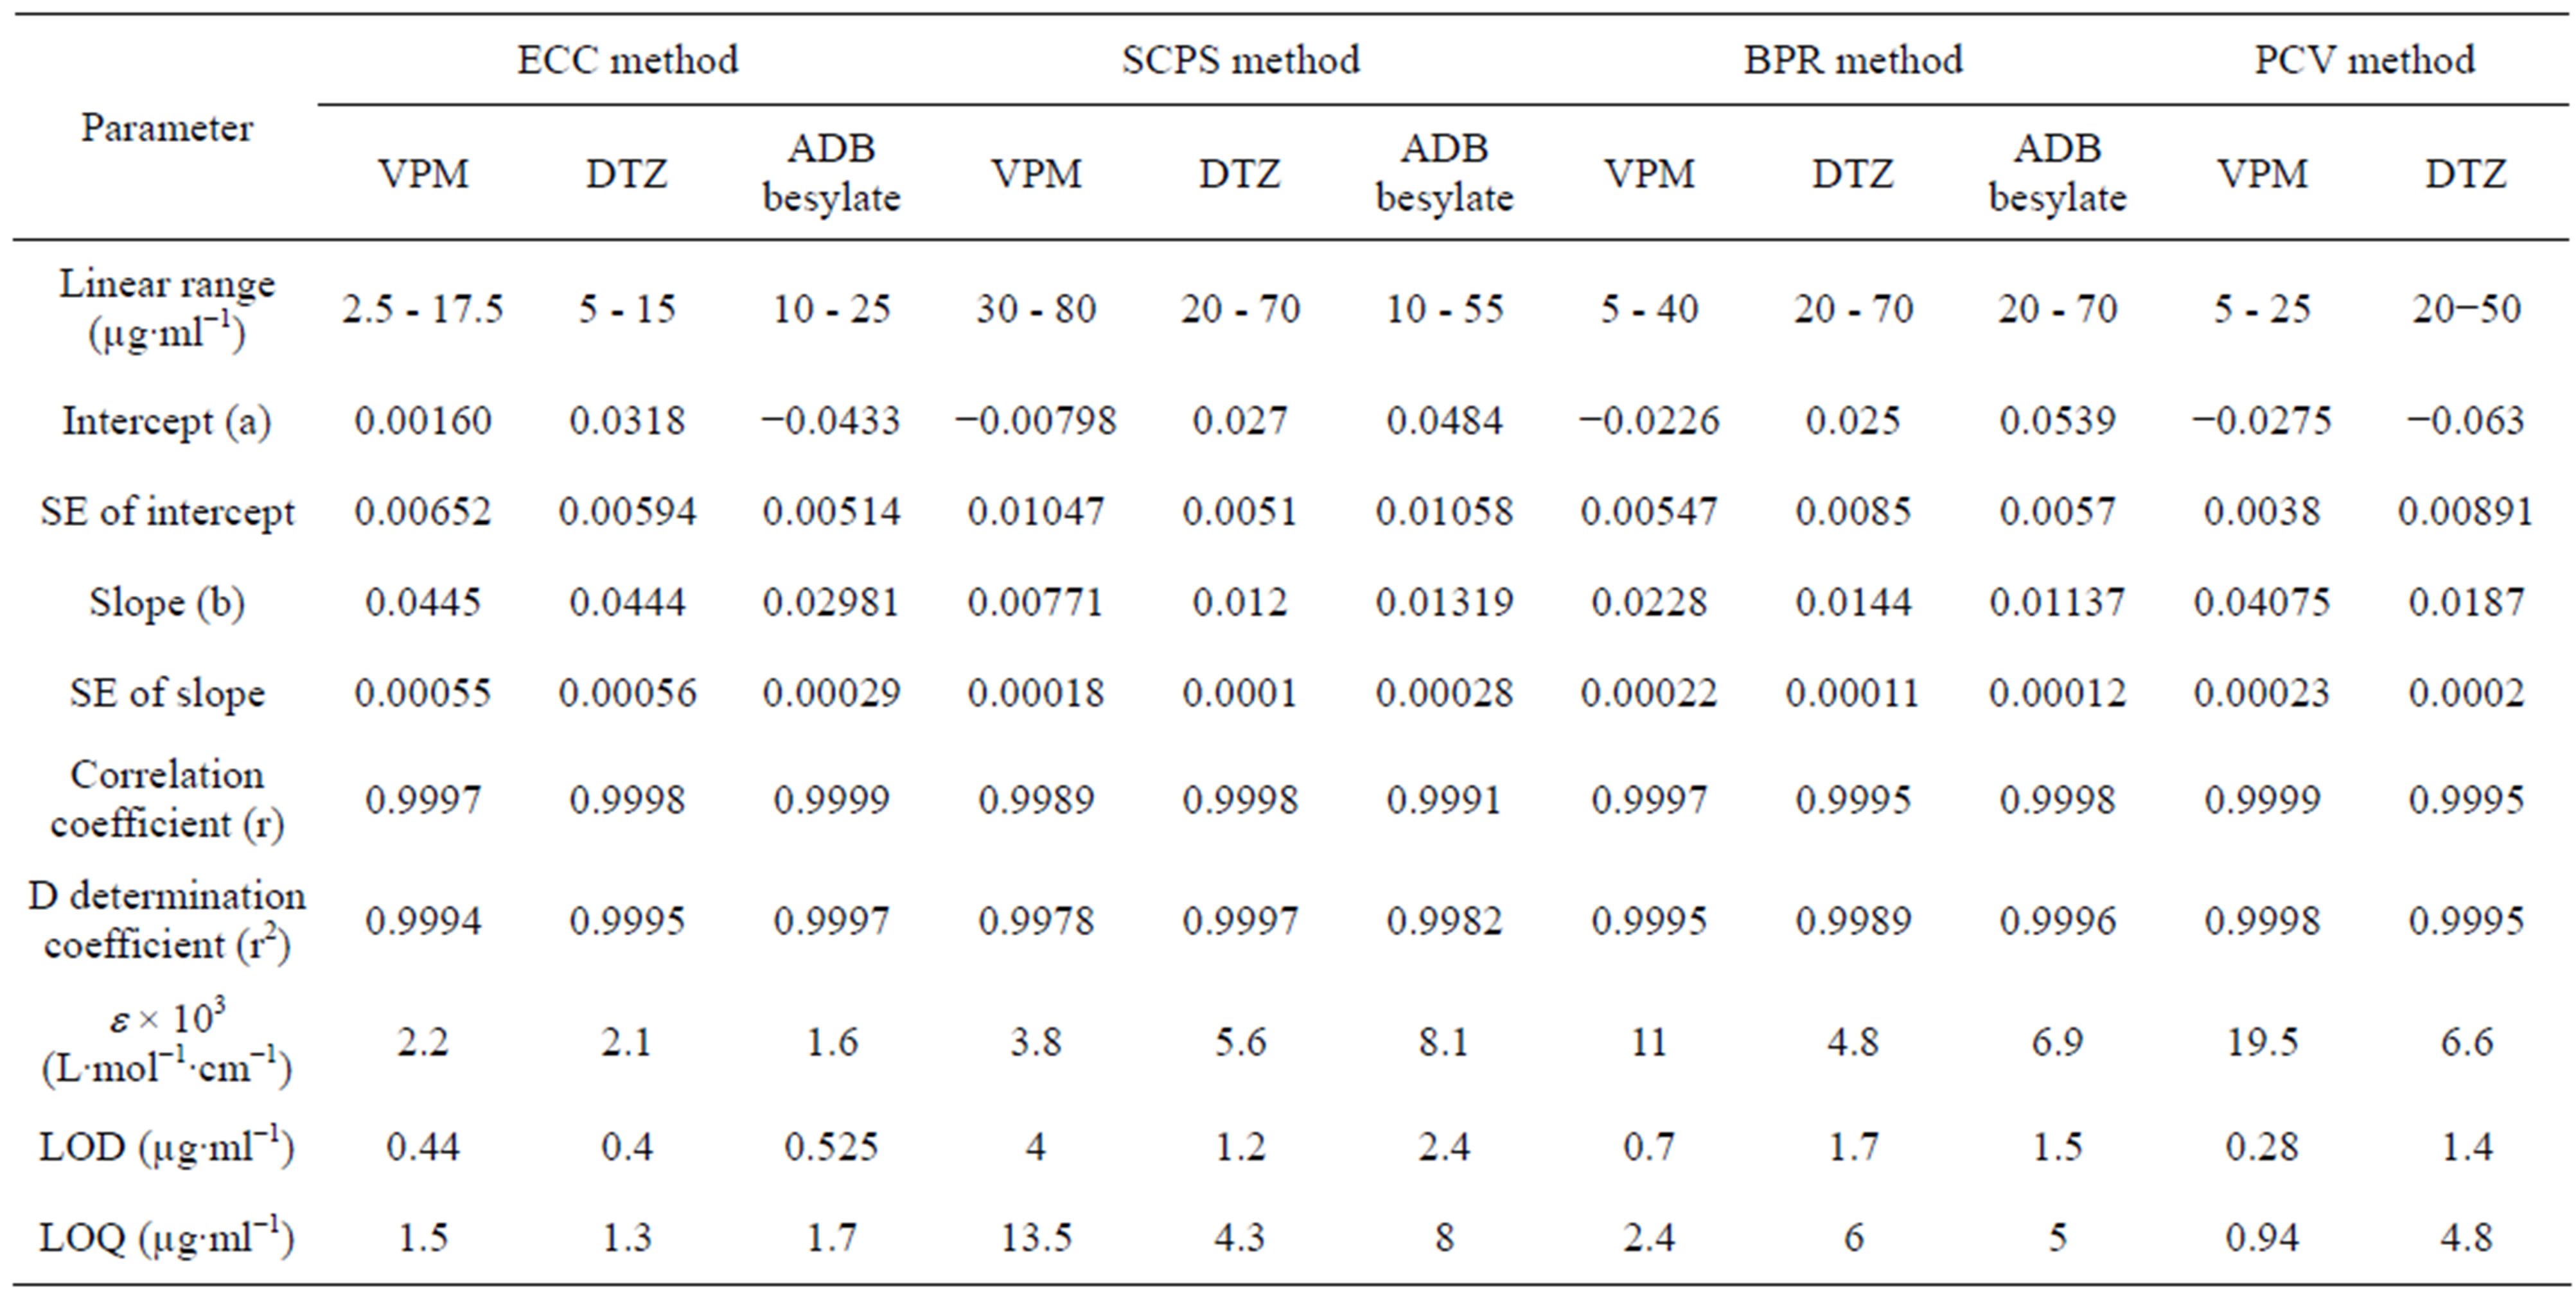
Table 2. Quantitative parameters for proposed method.
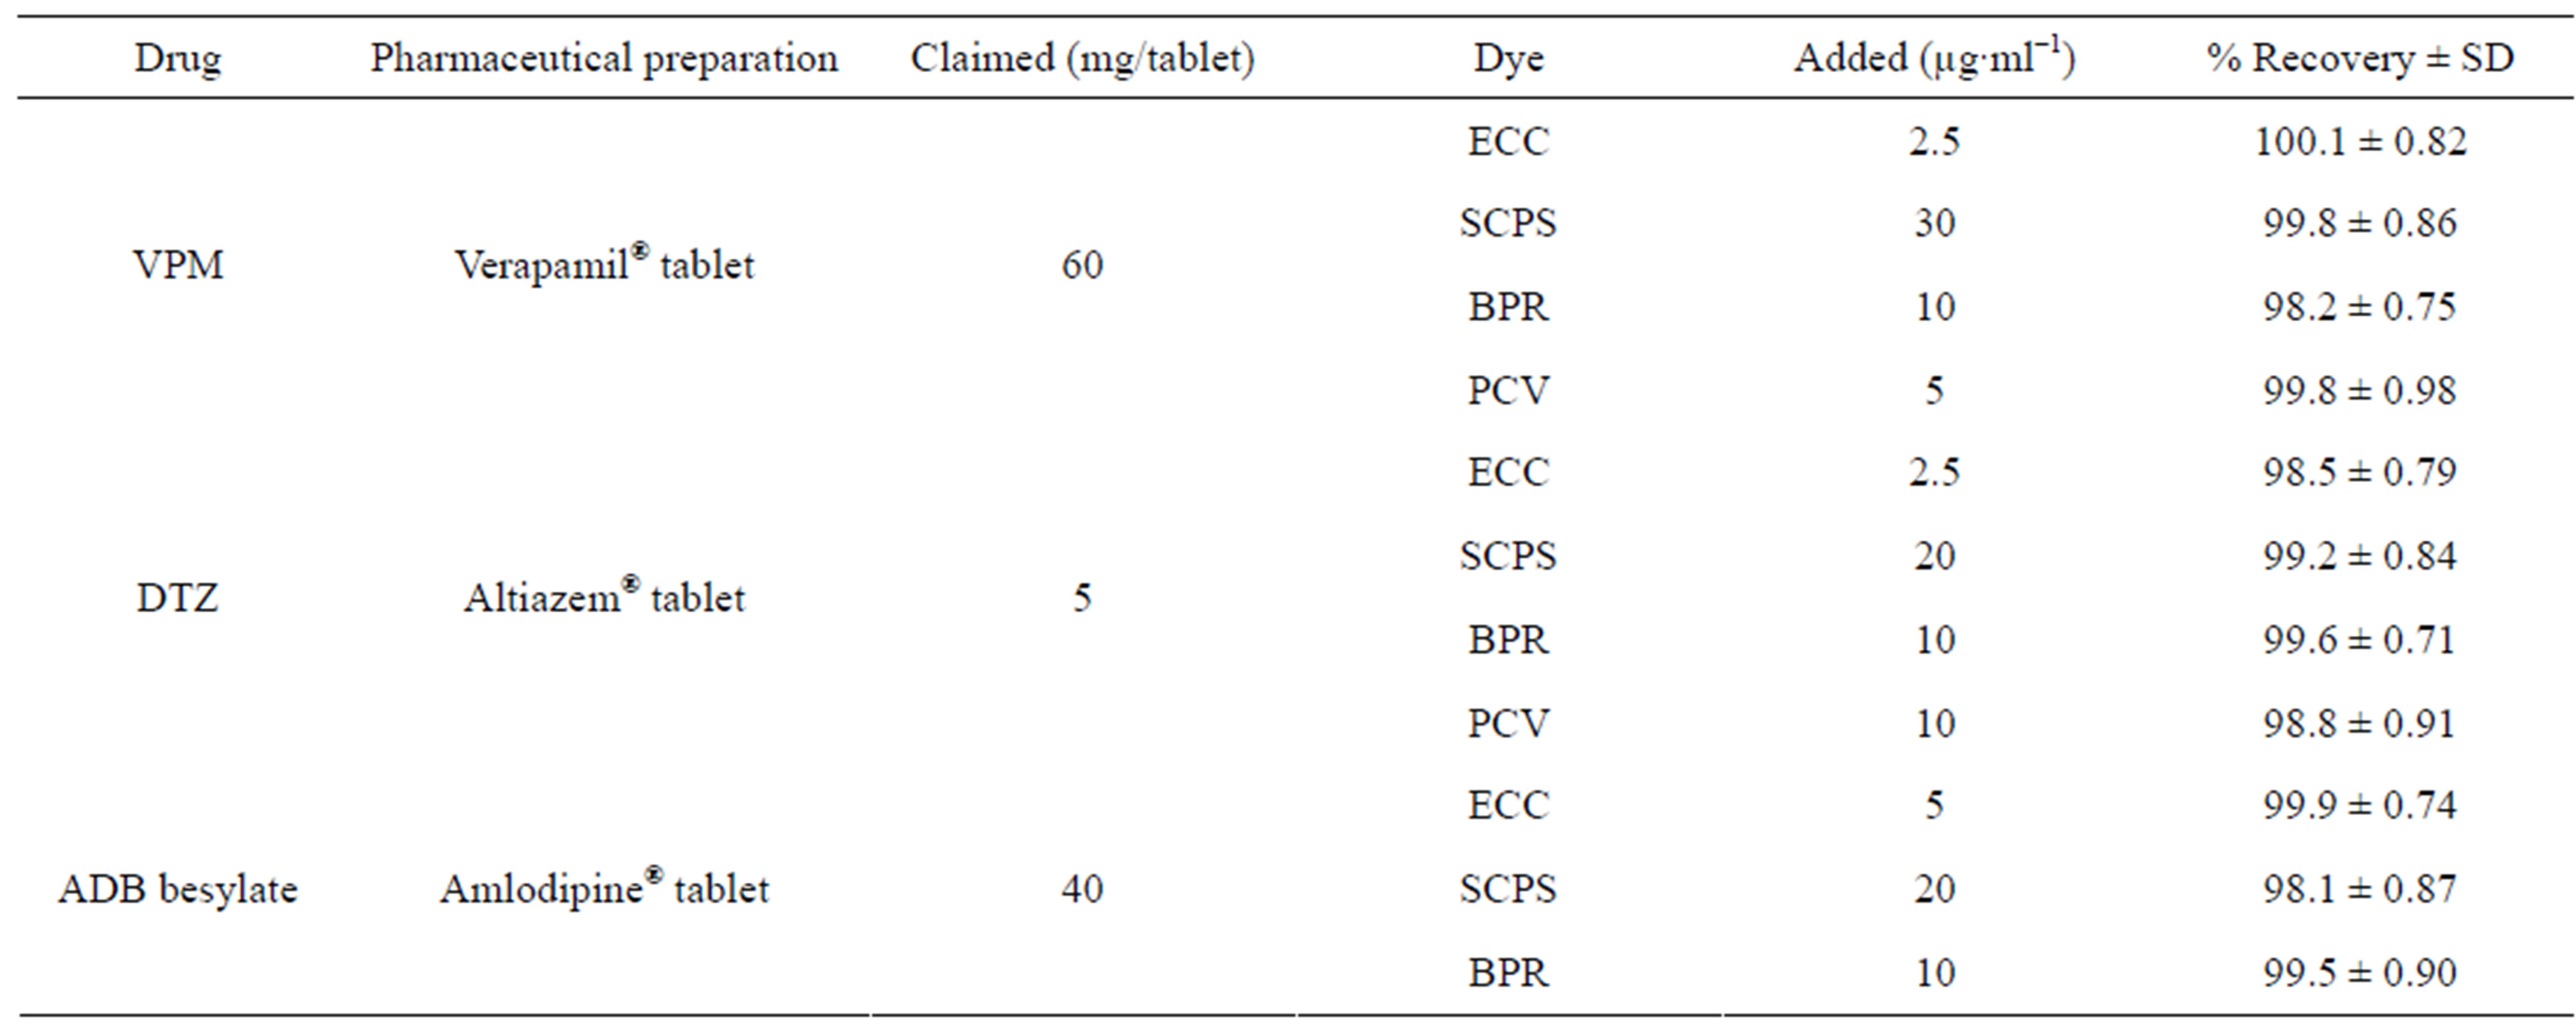
Table 3. Analysis of pharmaceutical preparations using ECC, SCPS, BPR and PCV methods, applying standard addition technique.
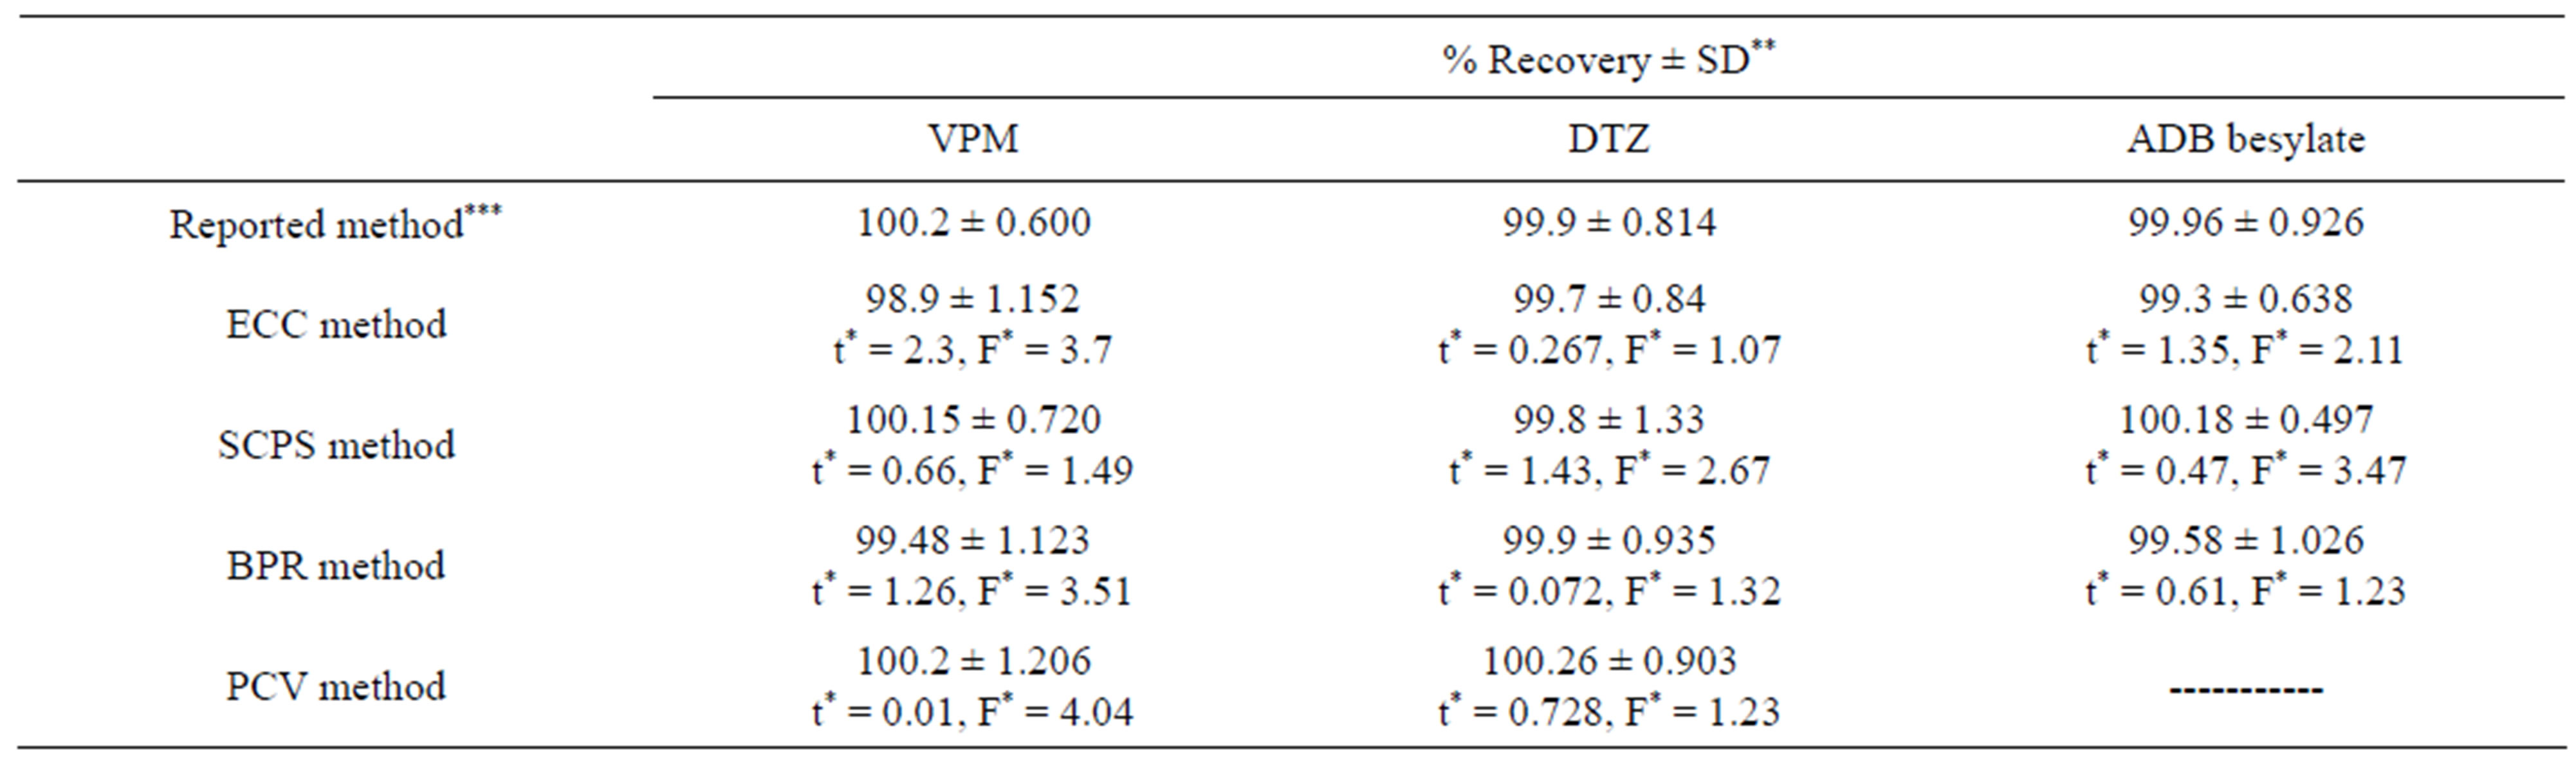
Table 4. Statistical comparison between the proposed and reported methods for determination of studied drugs in their pharmaceutical formulations.
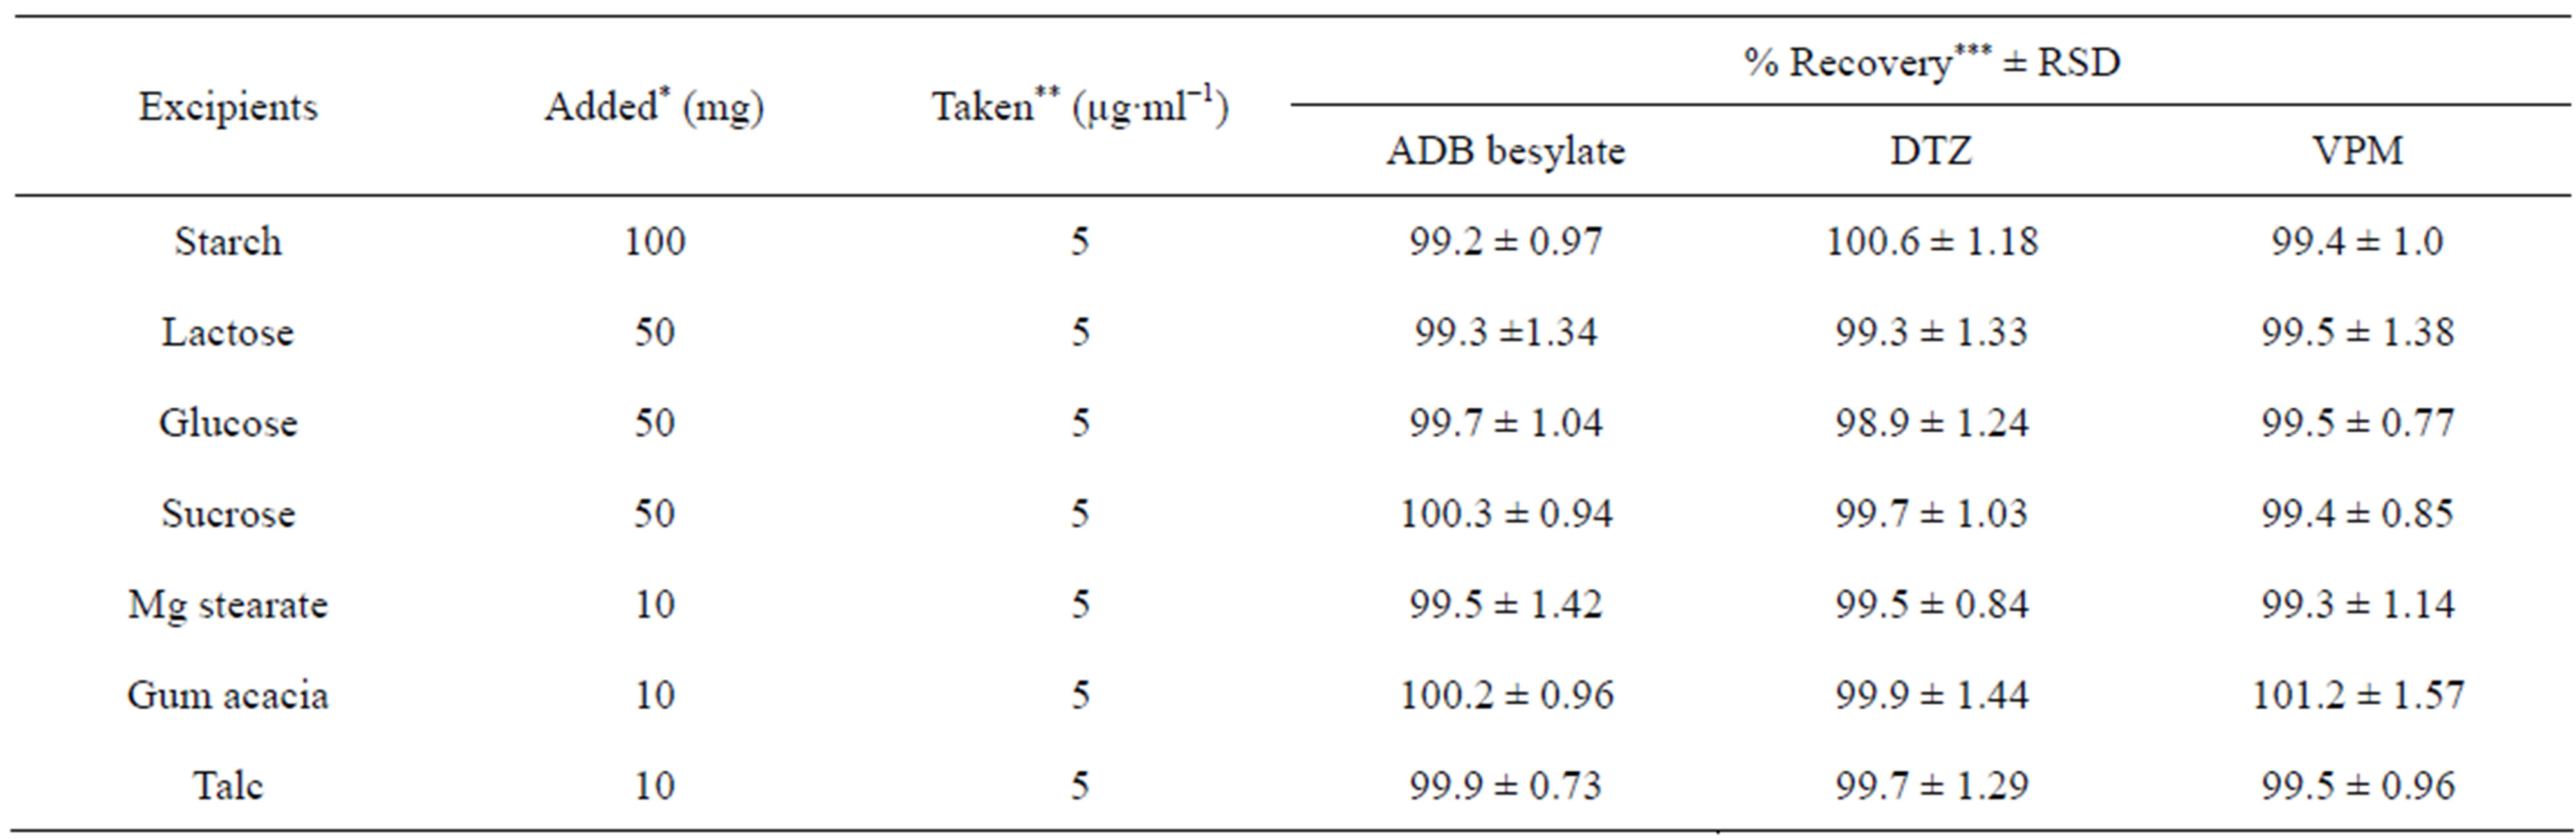
Table 5. Assay of the studied drugs in presence of some common excipients using eriochrome cyanine method.
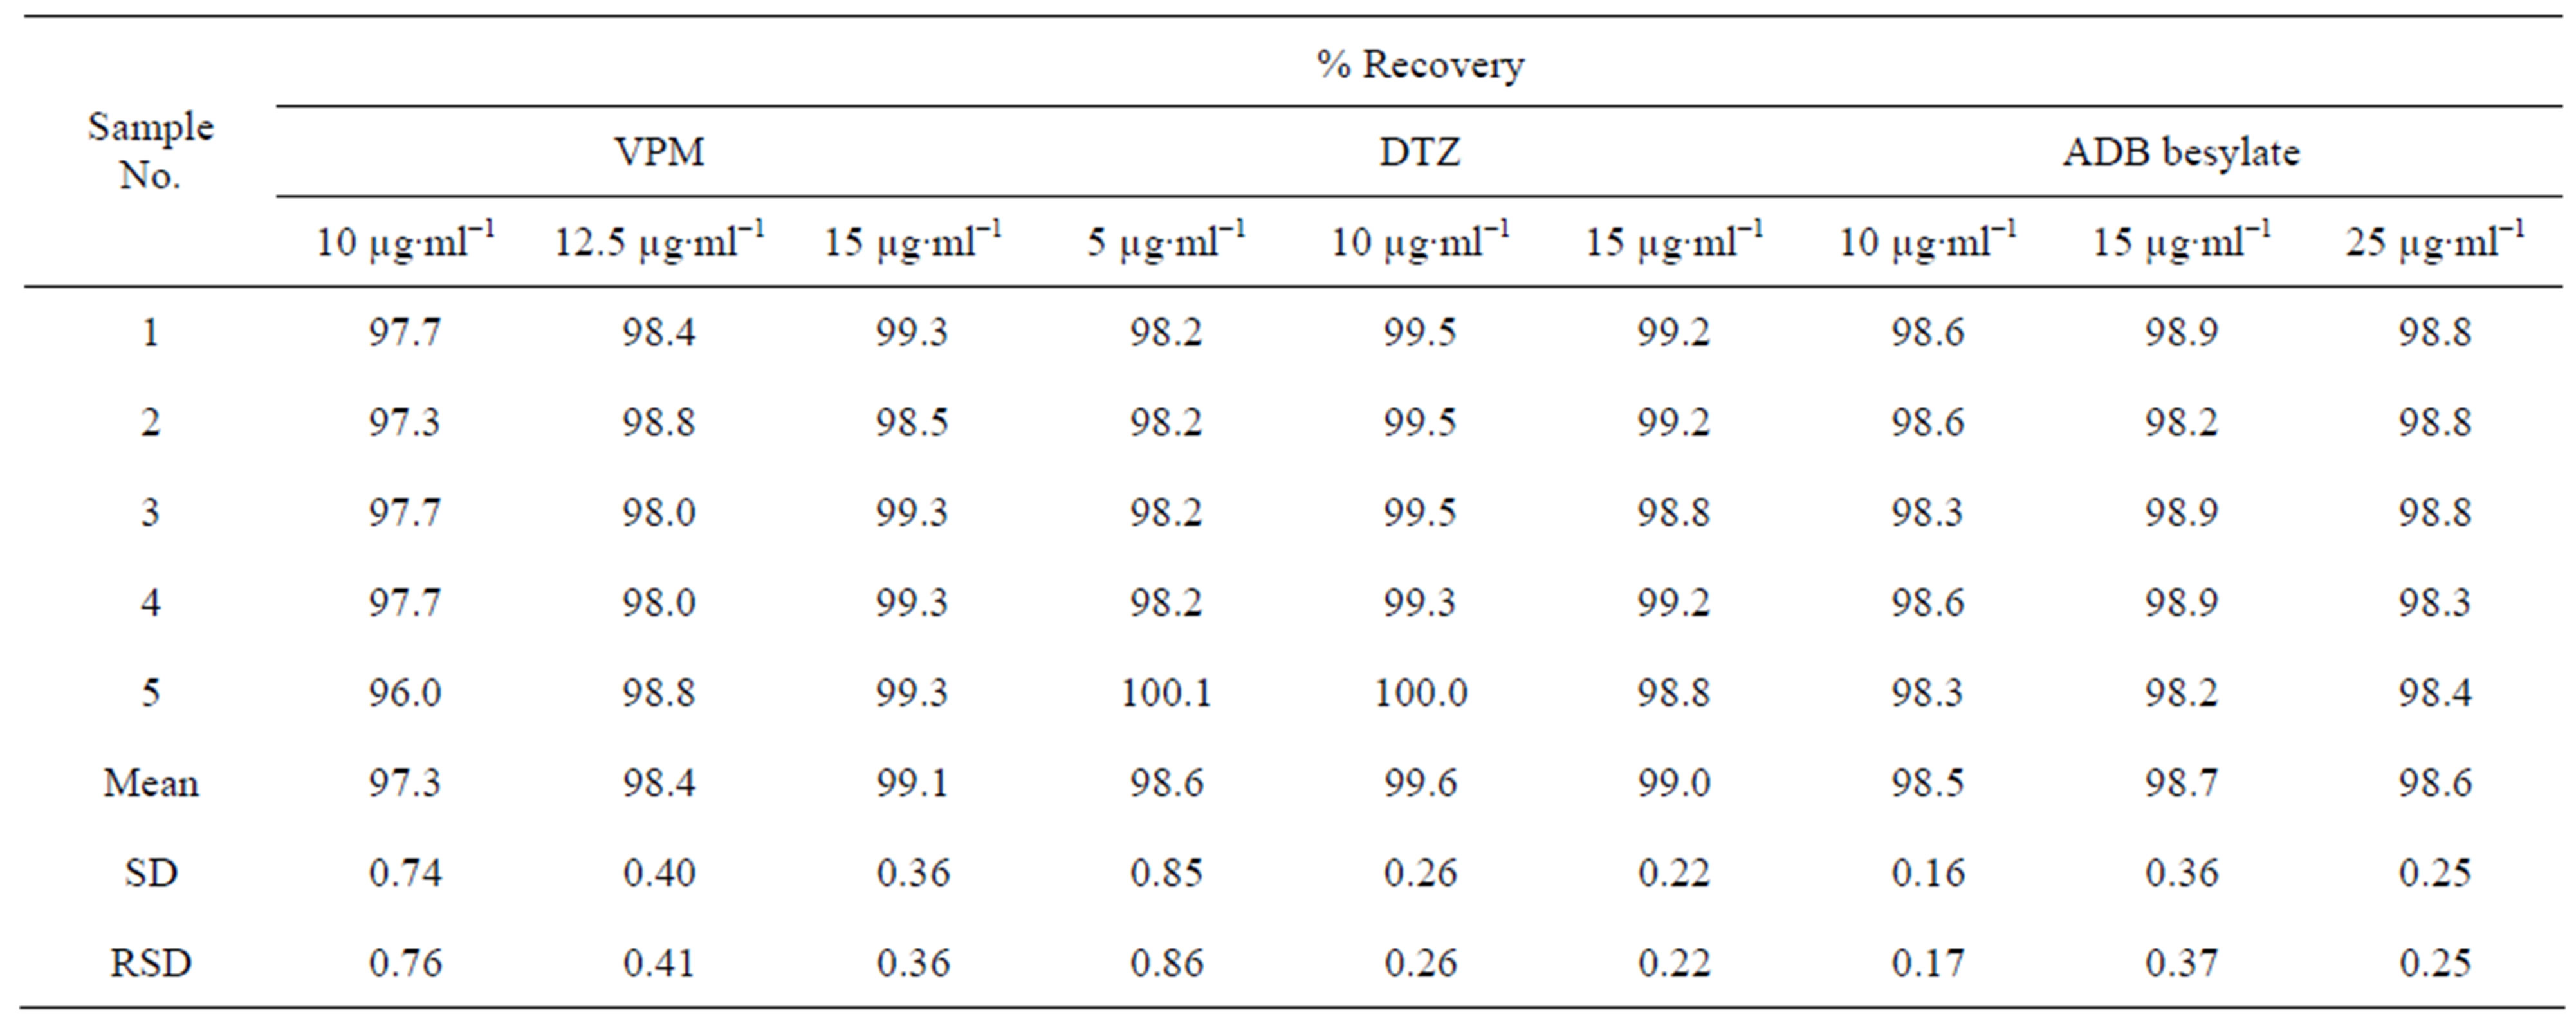
Table 6. Evaluation of the precision of Eriochromecyanine method.
4. CONCLUSION
The proposed methods are advantageous in comparison to other existing spectrophotometric methods because the detection limits are low. The molar absorptivities are also comparable with low RSDs. No interference from common excipients was encountered. Thus the proposed methods are simple, sensitive, accurate, precise and easy to use and might be preferred to other published methods for assay of the drug in clinical and quality control laboratories.
REFERENCES
- Delgado, J.M. and Remers, W.R. (1998) Text book of organic medicinal and pharmaceutical chemistry. 9th Edition, J. B. Lippincott Co., Philadelphia, New York and London, 543, 544, 583.
- Mohammadi, A., Rezanour, N., Dogaheh, M.A., Bidkorbeh, F.G., Hashem, M. and Walker, R.B. (2007) A stability-indicating high performance liquid chromatographic (HPLC) assay for the simultaneous determination of atorvastatin and amlodipine in commercial tablets. Journal of Chromatography, B: Analytical Technologies in the Biomedical and Life Sciences, 846, 215-221. doi:10.1016/j.jchromb.2006.09.007
- Li, C.P., Yan, X.P. and Shan, W.G. (2006) HPLC determination of amlodipine besylate tablets. Chinese Journal of Pharmaceutical Analysis, 26, 1878-1879.
- Bhushan, R., Gupta, D. and Singh, S.K. (2006) Liquid chromatographic separation and UV determination of certain antihypertensive agents. Biomedical Chromatography, 20, 217-224. doi:10.1002/bmc.557
- Zendelovska, D., Stafilov, T. and Stefova, M. (2003) Determination of diltiazem in human plasma after solidphase and liquid-liquid extraction. Analytical and Bioanalytical Chemistry, 376, 848-853. doi:10.1007/s00216-003-1996-9
- Ola, M.A. and Amr, M.B. (2011). Derivative-ratio spectrophotometric, chemometric and HPLC validated methods for simultaneous determination of amlodipine and atorvastatin in combined dosage form. International Journal of Industrial Chemistry, 2, 78-85.
- Najma, S., Muhammad, S.A. and Waheed, A. (2011) In-vitro interaction studies of verapamil with fluoroquinolones using first order dervative UV spectrophotometry and RP-HPLC. Journal of the Chilean Chemical Society, 56, 848-855. doi:10.4067/S0717-97072011000400005
- Venkatesh, G., Ramanathan, S., Mansor, S.M., Nair, N.K., Sattar, M.A., Croft, S.L. and Navaratnam, V. (2007) Development and validation of RP-HPLC-UV method for simultaneous determination of buparvaquone, atenolol, propranolol, quinidine and verapamil: A tool for the standardization of rat in situ intestinal permeability studies. Journal of Pharmaceutical and Biomedical Analysis, 43, 1546-1551. doi:10.1016/j.jpba.2006.11.013
- Jhee, O.H., Hong, J.W., Om, A.S., Lee, M.H., Lee, W.S., Shaw, L.M., Lee, J.W. and Kang J.S. (2005) Direct determination of verapamil in rat plasma by coupled column microbore-HPLC method. Journal of Pharmaceutical and Biomedical Analysis, 37, 405-410. doi:10.1016/j.jpba.2004.11.003
- Bharat, K.D., Jitendra, P., Pranati, C., Shabana, B. and Suddhasatya, D. (2010). Analytical method development and validation of Amlodipine and Benazepril hydrochloride in combined dosage form by RP-HPLC. International Journal of Chemical and Pharmaceutical Sciences, 2, 26-30.
- Bhushan, R., Gupta, D. and Singh, S.K. (2006) Liquid chromatographic separation and UV determination of certain antihypertensive agents. Biomedical Chromatography, 20, 217-224. doi:10.1002/bmc.557
- Aniruddha, R.C., Swati, C.J., Kumbhar, S.V., Vinayak, J.K., Vinit, D.P., Bhanudas, S.K. and Pradeep, D.L. (2010) Simultaneous HPTLC estimation for Telmisartan and Amlodipine besylate in tablet dosage form. Archives of Applied Science Research, 2, 94-100.
- Vidhya, K.B. and Sunil, R.D. (2011) Validated HPTLC method for simultaneous estimation of atenolol, hydrochlorothiazide and amlodipine besylate in bulk drug and formulation. International Journal of Analytical and Bioanalytical Chemistry, 1, 70-76.
- Deval, B.P., Falgun, A.M. and Kashyap, K.B. (2012) Simultaneous estimation of amlodipine besylate and indapamide in pharmaceutical formulation by thin-layer chromatographic-densitometric method. Novel Science International Journal of Pharmaceutical Science, 1, 74-82.
- Kowalczuk, D. (2005) Simultaneous high-performance thin-layer chromatography densitometric assay of trandolapril and verapamil in the combination preparation. Journal of AOAC International, 88, 1525-1529.
- Bhushan, R. and Gupta, D. (2005) Thin-layer chromatography separation of enantiomers of verapamil using macrocyclic antibiotic as a chiral selector. Biomedical Chromatography, 19, 474-478. doi:10.1002/bmc.520
- Scharpf, F., Riedel, K.D., Laufen, H. and Leitold, M. (1994) Enantioselective gas chromatographic assay with electron-capture detection for amlodipine in biological samples. Journal of Chromatography B: Biomedical Sciences and Applications, 655, 225-233. doi:10.1016/0378-4347(94)00068-9
- Shin, H.S., Oh-Shin, Y.S., Kim, H.J. and Kang, Y.K. (1996) Journal of Chromatography B: Biomedical Sciences and Applications, 677, 369-373.
- Kalin, J.R., Wood, K.M. and Lee, A.J. (1994) Journal of Analytical Toxicology, 18, 180-182.
- Alebic Kolbah, T. and Plavsic, F. (1990) Journal of Pharmaceutical and Biomedical Analysis, 8, 915-918.
- López-Alarcón, C., Squella, J.A., Núñez-Vergara, L.J., Baez, H. and Camargo, C. (2002) Rapid Communicatios in Mass Spectrometry, 16, 2229-2238.
- Martinez, V., Lopez, J.A., Alonso, R.M. and Jimenez, R.M. (1999) Micellar electrokinetic chromatography as a fast screening method for the determination of 1,4-dihydropyridine calcium antagonists. Journal of Chromatography A, 836, 189-199. doi:10.1016/S0021-9673(98)01029-2
- Bretnall, A.E. and Clarke, G.S. (1995) Investigation and optimisation of the use of micellar electrokinetic chromatography for the analysis of six cardiovascular drugs. Journal of Chromatography A, 700, 173-178. doi:10.1016/0021-9673(95)00112-Z
- Wang, J., Chen, H. and Zhao L. (1999) Chinese Journal of Analytical Chemistry, 1.
- Nishi, H., Fukuyama, T., Matsuo, M. and Terabe S. (1990) Chiral separation of diltiazem, trimetoquinol and related compounds by micellar electrokinetic chromatography with bile salts. Chromatographia, 515, 233-243.
- Mohamed Sikkander, A., Vedhi, C. and Manisankar, P. (2011) Electrochemical stripping studies of amlodipine using Mwcnt modified glassy carbon electrode. Chemistry and Materials Research, 1, 1-7.
- Stoiljković, Z.Ž., Avramov Ivić, M.L., Petrović, S.D., Mijin, D.Ž., Stevanović, S.I., Lačnjevac, U.Č. and Marinković, A.D. (2012) Voltammetric and square-wave anodic stripping determination of amlodipine besylate on gold electrode. International Journal of Electrochemical Science, 7, 2288-2303.
- Felipe, S.S., Eder, T.G.C. and Christopher, M.A.B. (2009) Electrochemical behavior of verapamil at graphite-polyurethane composite electrodes: Determination of release profiles in pharmaceutical samples. Analytical Letters, 42, 1119-1135. doi:10.1080/00032710902890470
- Altiokka, G. and Altiokka, M. (2002) Flow injection analysis of amlodipine using UV-detection. Pharmazie, 57, 500.
- El-Didamony, A.M. and Erfan, E.A.H. (2011) Cerimetric determination of four antihypertensive drugs in pharmaceutical preparations. Journal of the Chilean Chemical Society, 56, 875-880. doi:10.4067/S0717-97072011000400011
- Vichare, V., Tambe, V., Kashikar, V. and Dhole, S.N. (2011) Simultaneous determination of amlodipine besylate and hydrochlorothiazide in combined tablet dosage form by simultaneous equation, absorption ratio and first order derivative spectroscopy methods. International Journal of Chemistry Research, 1, 7-10.
- Gadallah Mohamed, N. (2011) Simultaneous determination of amlodipine and valsartan. Analytical chemistery insights. Analytical Chemistery Insights, 6, 53-59.
- Sahu, R. and Patel, V.B. (2007) Simultaneous spectrophotometric determination of amlodipine besylate and atorvastatin calcium in binary mixture Indian Journal of Pharmaceutical Sciences, 69, 110-111. doi:10.4103/0250-474X.32119
- Rahman, N. and Azmi, S.N.H. (2000) Spectrophotometric determination of diltiazem hydrochloride with sodium metavanadate. Microchemical Journal, 65, 39-43. doi:10.1016/S0026-265X(00)00025-4
- Sawyer, D.T., Heinman, W.R. and Beebe, J.M. (1984) Chemistry experiments for instrumental methods. John Wiley and Sons Inc., New York.
- Inczedy, J. (1976) Analytical application of complex equilibria. 2nd Edition, John Wiley & Sons Inc., Budapest.
- American Pharmaceutical Association (2007) The United States pharmacopeia 29 and NF 25. Washington DC.
- David, J.M., Cynthia, L.O. and Shuster, I. (1977) Analytical profiles of drug substances and excipients. Academic Press, Inc., Waltham.
- Smith, G.P. and Zui, L.C. (1977) Analytical profiles of drug substances and excipients. Academic Press, Inc., Waltham.
- Basavaiah, K., Chandrashekar, U. and Prameela, H.C. (2003) Sensitive spectrophotometric determination of amlodipine and felodipine using iron(III) and ferricyanide. II Farmaco, 58, 141-148. doi:10.1016/S0014-827X(02)00018-6
- Vogel, E. (1989) Vogel’s text book of quantitative chemical analysis, 5th Edition. In: Jefferry, G.H., Bassett, J., Mendham, J. and Denney, R.C., Eds, Bath Press, Bath.
- Topic Q2A (1994) Text on validation of analytical procedures. International Conference on Harmonisation.
- Topic Q2B (1996) Validation of analytical procedures: Methodology. International Conference on Harmonisation.