Natural Science
Vol.4 No.8(2012), Article ID:22003,7 pages DOI:10.4236/ns.2012.48078
Assessment of heavy metal contamination in vegetables consumed in Zanzibars
![]()
Department of Physics, University of Dar es Salaam, Dar es Salaam, Tanzania; *Corresponding Author: najat@udsm.ac.tz
Received 20 June 2012; revised 28 July 2012; accepted 8 August 2012
Keywords: Heavy metals; Contamination; Amaranth; Cabbage; Zanzibar; EDXRF
ABSTRACT
Samples of amaranth and cabbage from Zanzibar were analyzed for heavy metal concentrations using Energy Dispersive X-ray Fluorescence spectrometry (EDXRF) of Tanzania Atomic Energy Commission (TAEC) in Arusha. Thirty samples of amaranth and twenty five samples of cabbage were collected from four farms and two markets at Urban West Region in Zanzibar. The concentrations of Al, Cl, Cr, Mn, Fe, Ni, Zn, Cu, Ag, I, Br, Cd and Pb are presented and discussed. Amaranth had significant (P < 0.05) higher concentrations of Zn, Fe, Cr and Mn than cabbage, whilst Cd, Ni and Pb were significantly (P < 0.05) higher in cabbage than amaranth. Although the mean concentrations of the essential elements were in the range reported in literature, Pb and Cd were in concentrations above FAO/ WHO maximum tolerable limits.
1. INTRODUCTION
Vegetables are common diet taken by various populations throughout the world due to their richness in vitamins, minerals, fibers and anti-oxidative effects. However, leafy vegetables such as amaranth and cabbage are said to be good absorber of heavy metals from the soil [1-3]. Reports have shown that, vegetables grown in rich heavy metal soils are also contaminated [4,5]. Vegetables take up metals from contaminated soil through the crop roots and incorporated them into the edible part of plant tissues or as a deposit on the surface of vegetables [6,7].
Amaranth and cabbage are the most consumed vegetables in Zanzibar, which are either grown within the islands or imported from the Tanzania mainland. This study is the first to analyze heavy metals in vegetables consumed in Zanzibar. However, several researches have shown that vegetables grown in some parts of Tanzania mainland are contaminated with heavy metals [8,9]. Othman (2001) analyzed vegetables, from Ukonga, Kiwalani, Tabata, Buguruni and Sinza in Dar es Salaam, which were cultivated along high ways [9]. Bahemuka and Mubofu (1999) reported data from samples collected in regions within the proximity of River Msimbazi [8]. In both studies high concentrations of Cd, Pb, Zn, Cr and Ni which were above the permissible limit set by FAO/ WHO were reported. Vegetables from these and other areas in Tanzania mainland might be among the stock imported to markets in Zanzibar. The concentrations of heavy metals might as well be high in vegetables grown in Zanzibar. This is because vegetable farming in Zanzibar includes application of manure and chemical fertilizers, which are reported to be a source of metals in food [10,11]. At the same time, most of the vegetable farms are situated along highways which might be receiving deposits of metals from vehicle emissions.
Heavy metals such as Cr, Mn, Zn, Cu, and Fe are considered essential components of biological activities in the body, however, in excess are reported to cause problem to human [1]. On the other hand, Pb, Cd, and As have no important functions in human body rather play toxic role to living organism, hence are considered as toxic elements [1]. Heavy metals are toxic because they react with body’s biomolecules, clog up receptor sites, break and bend sulfur bonds in important enzymes such as insulin, and damage the DNA [3,5]. For instance, most of the accumulated Pb in a body is sequestered in skeleton, where will have a half-life 20 - 30 years [12]. The high gastrointestinal uptake and the permeable bloodbarrier make children more susceptible to Pb exposure than adults. Children exposed to high concentrations of Pb may develop behavioral disturbances as well as learning and concentration difficulties [13]. Cd is carcinogenic even in low concentrations and renal effects may also result due to sub chronic consumption of Cd [14].
2. METHODOLOGY
The samples analyzed in this study were collected at Urban West (UW) Unguja, which is the major town of Zanzibar with a population of about 400,000 people [15]. There are several small scale farms of vegetables mainly amaranth and cabbage scattered all over the outcast areas of Zanzibar town. The majority of the farms are located along the main roads for easier transportation to the markets. There are also very few small scale industries in Zanzibar which are all located in Zanzibar town. The vegetables are grown in all seasons of the year, having to be irrigated during dry season. The irrigation is normally conducted using tap water and water from tube wells. The use of pesticides and herbicides are common practice especially for cabbage, because cabbages take a longer time before being harvested than amaranth, hence they need more protection from vermin. The cultivation of amaranth uses mostly manure as type of fertilizer compared to cabbage where chemical fertilizer is preferred.
30 samples of amaranth and 25 samples of cabbage were collected randomly from two markets and 4 farms (production sites) in the Urban West Region of Unguja, Zanzibar. The farm sites were Dimani, Mwera, Chukwani and Migombani while markets were Mwanakwerekwe and Darajani (Figure 1). The samples of amaranth and cabbage were each grouped into two, FL for sample collected from farms and MK for samples purchased in the two markets.
The leafy part of each type of vegetables was well washed with distilled water and chopped into small pieces in order to facilitate drying at the same rate. The dried samples of cabbage and amaranth were ground using electric grinder and then sieved to obtain fine powder (size < 0.074 mm), which were then stored in well labeled polythene bags and transferred to the Tanzania Atomic Energy Commission (TAEC) laboratory for analysis. 14.7 g of the sieved powder of samples were thoroughly mixed and homogenized and be compressed into pellets of diameter of 32 mm to give reproducible irradiation and counting geometry. The elemental analyses of samples were conducted using a bench top energy dispersive X-ray spectrometer of TAEC in Arusha. The machine which is operated by automated turbo-quant X-lab ProTM software was operated at a rate of 50 W and 50 kV voltage and the florescent X-rays were collected
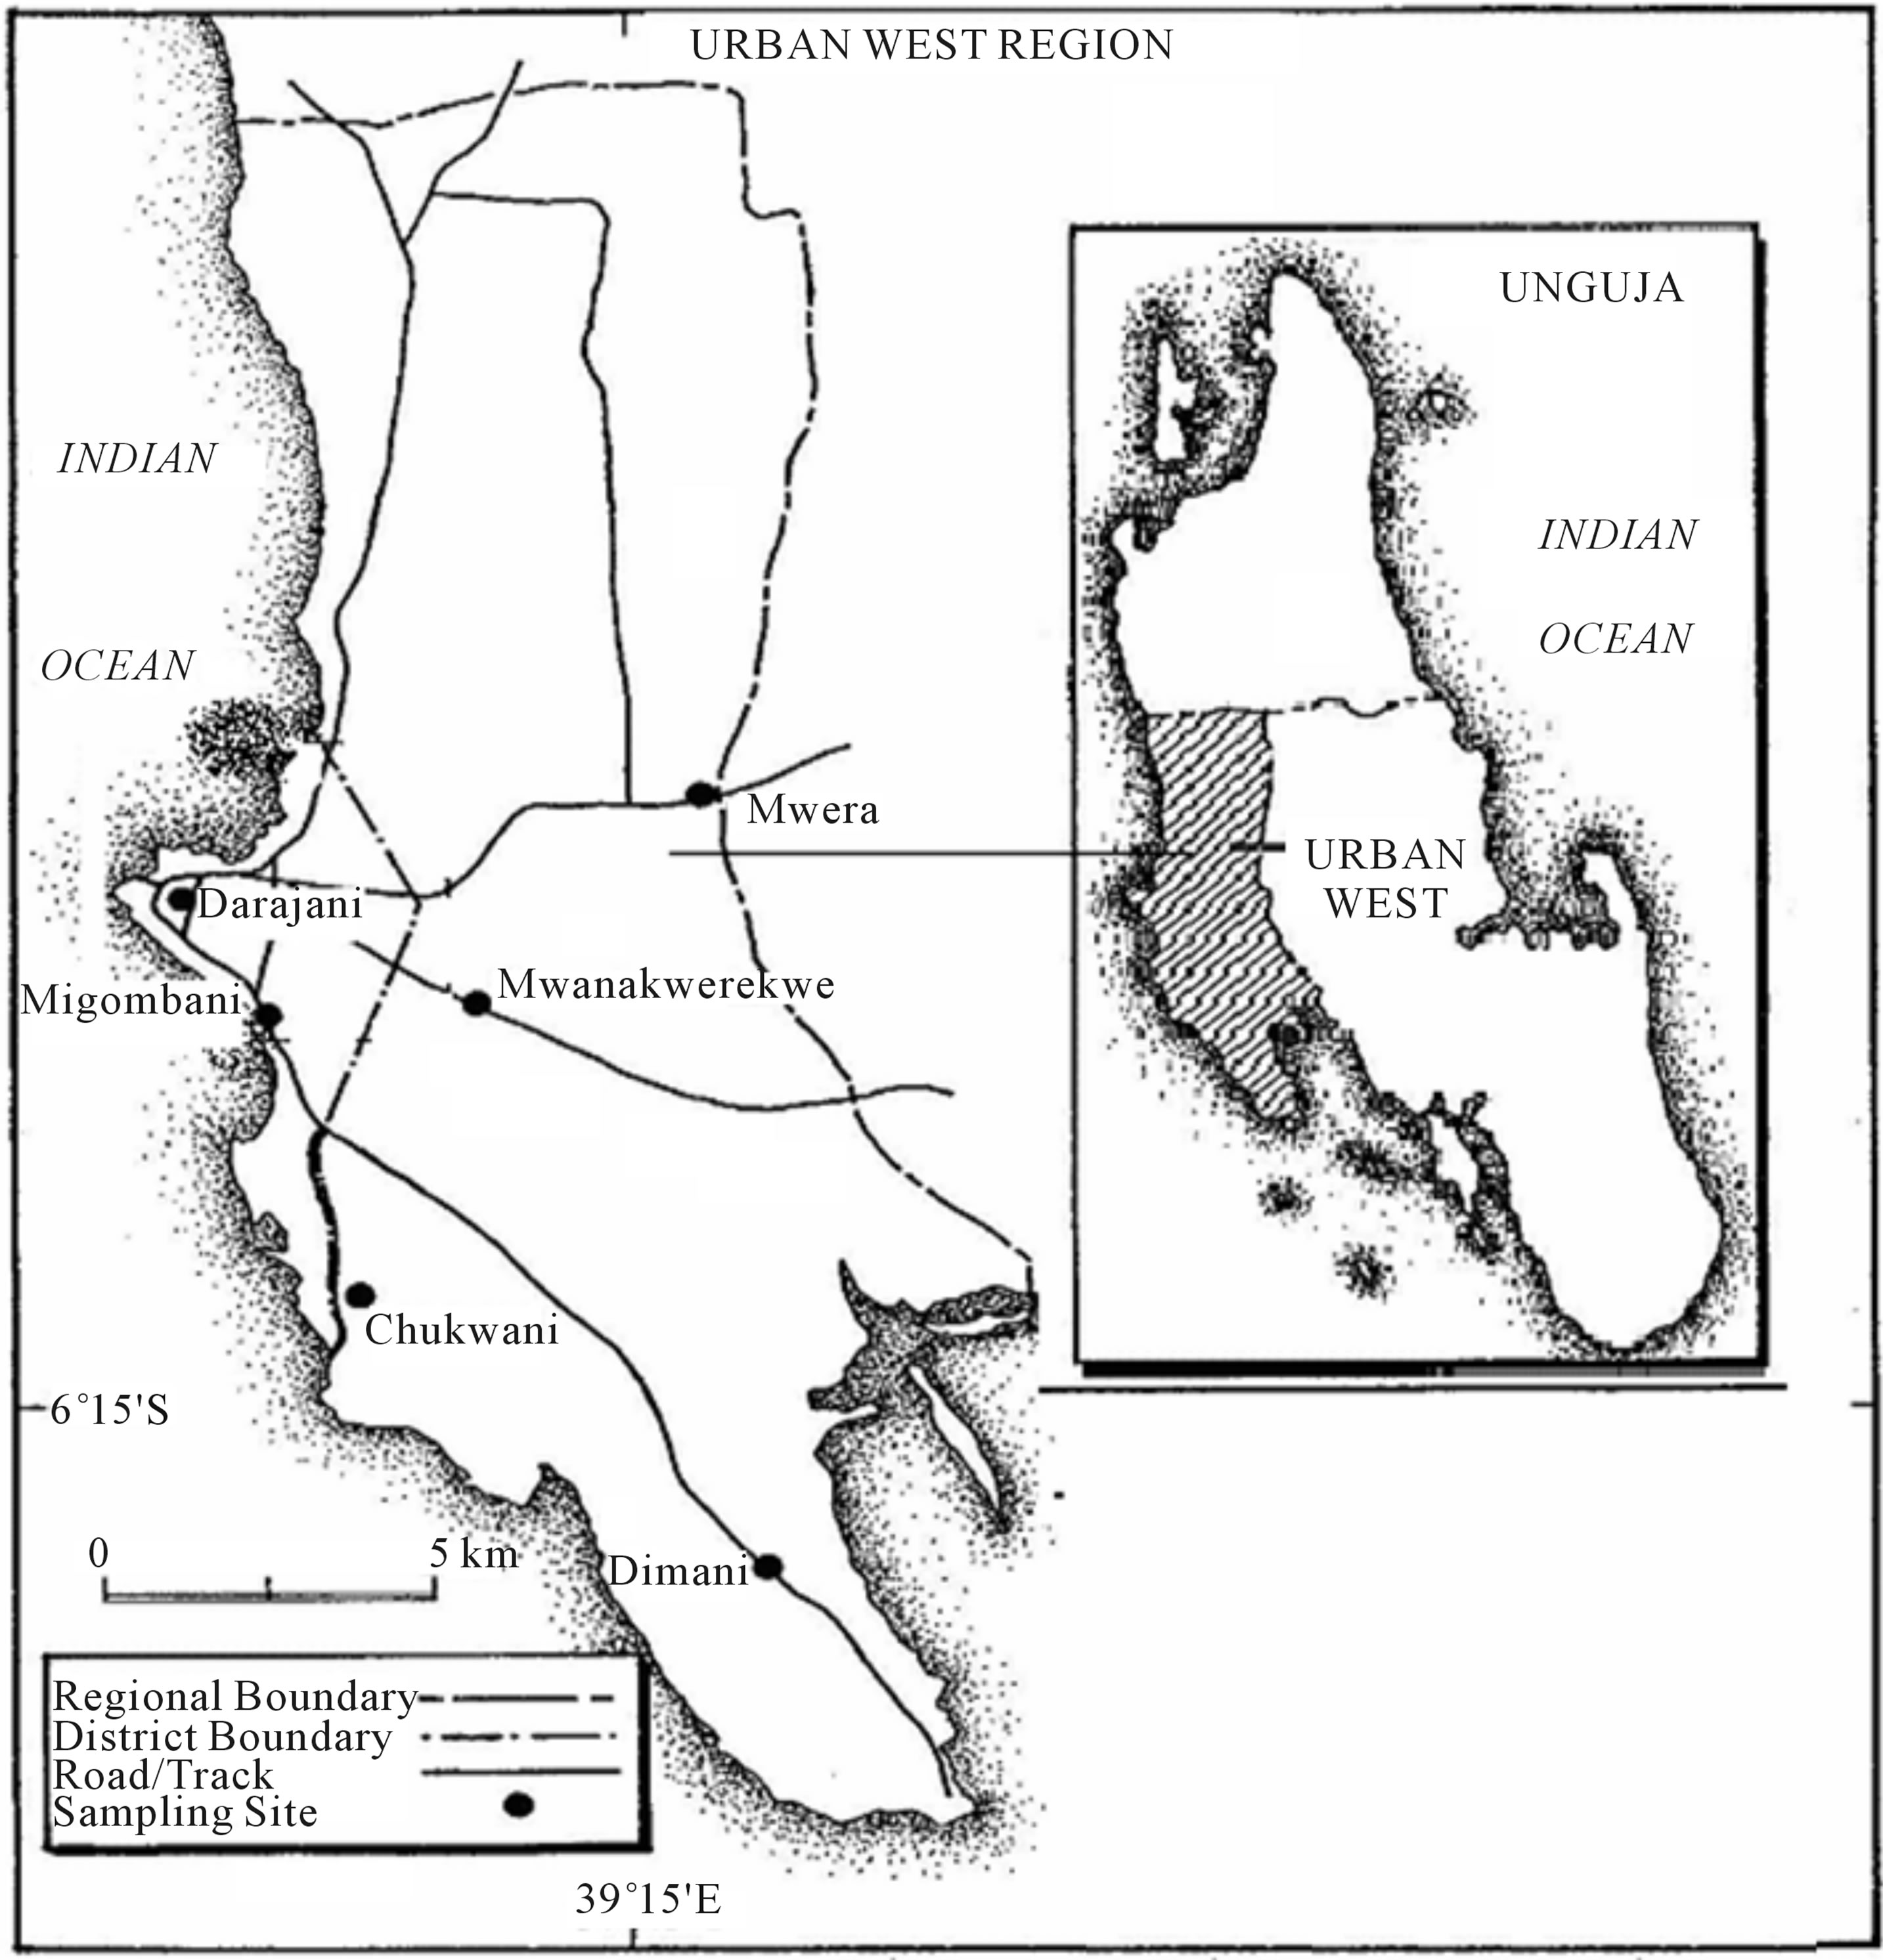
Figure 1. Map of Unguja, Zanzibar indicating the sampling points at urban west region.
by a Si(Li) detector having a resolution (FWHM) at MnKα ≤ 160 eV. A spectrum run for 15 minutes gave a good continuity statistics and resolution of the peaks. The concentrations of individual elements were determined by using fundamental parameter method inbuilt in X-lab Pro computer software in which matrix effects was counted for.
Quality control was carried out using IAEA reference material Trace and Minor Elements in Cabbage (IAEA 359) analyzed with the samples. As Table 1 shows, the experimental values were all in good agreement with the recommended values within 8% accuracy.
3. RESULTS AND DISCUSSION
In this study the calculation of the MDL of each element was carried out using the turbo-quant method incorporated in the X-lab Pro software package. The minimum detection limits of elemental concentrations in amaranth and cabbage for EDXRF system used in this study are presented in Table 2.
3.1. Amaranth
Table 3 shows statistical summary of data in (µg/g) obtained from samples of amaranth. In the table elements that are normally distributed are reported using arithmetic means (A.M ± SEM) whilst elements that follow non normal distribution are reported using geometric means (G.M ×/÷). The t-test from SPSS version 16 was used to statistically compare the mean concentrations of elements obtained in the two groups, (FL and MK). In this test, significant value was taken as p ≤ 0.05.
As Table 3 shows the differences of concentration levels of elements between the two groups of amaranth were minor. Samples from farms had significant (p ≤ 0.05)
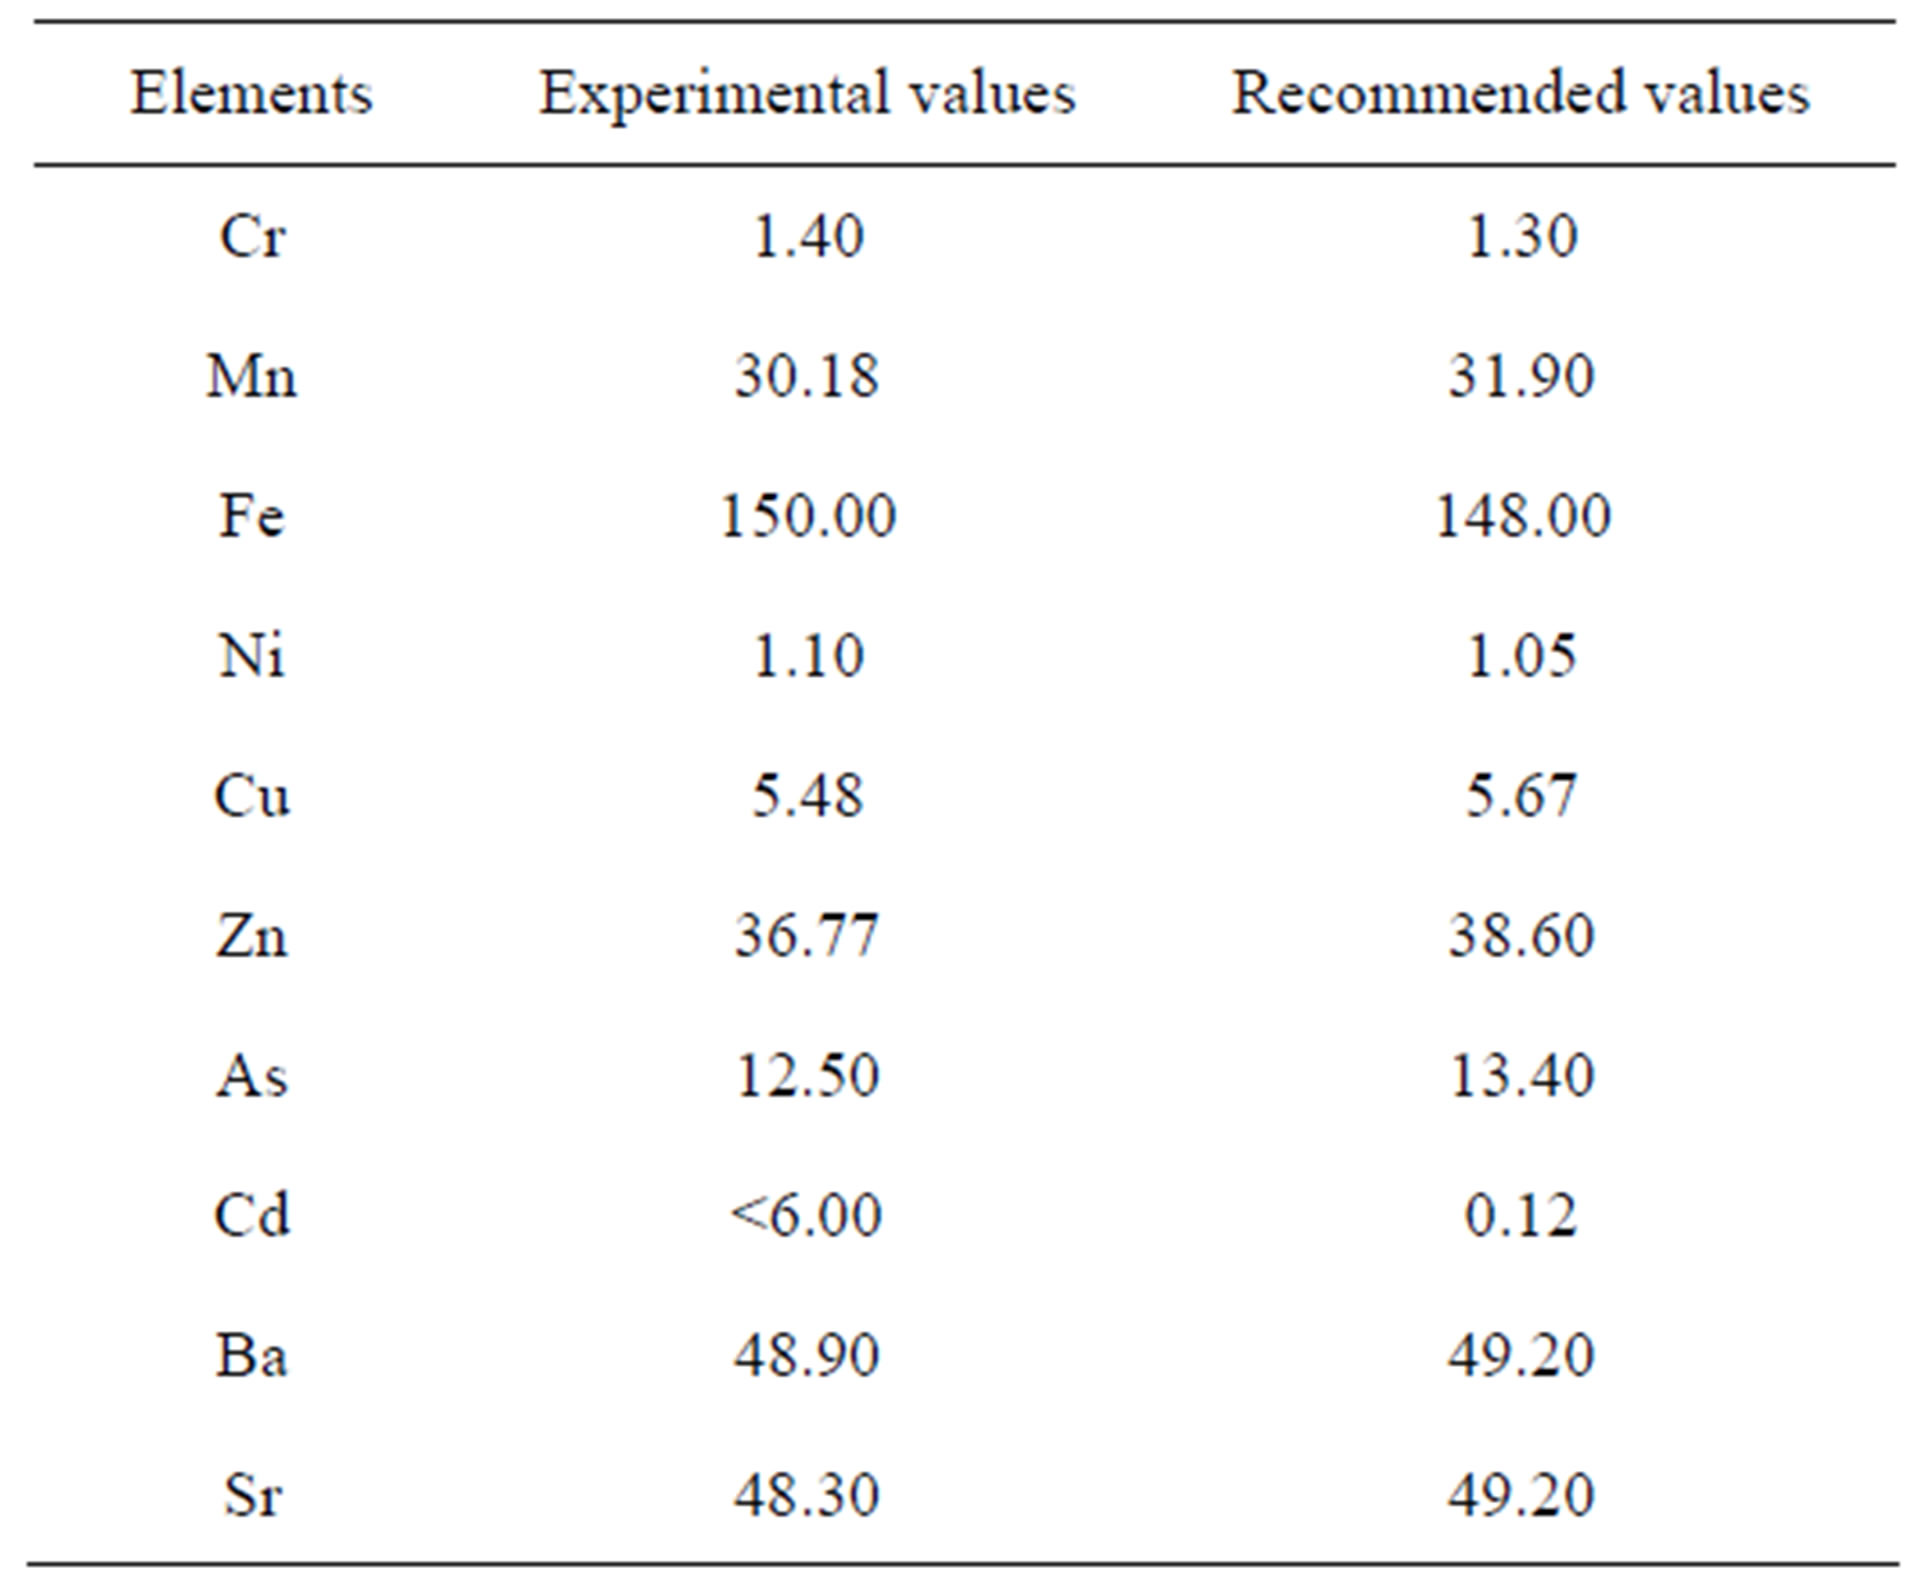
Table 1. Experimental and recommended values of reference material trace and minor elements in Cabbage (IAEA 359).
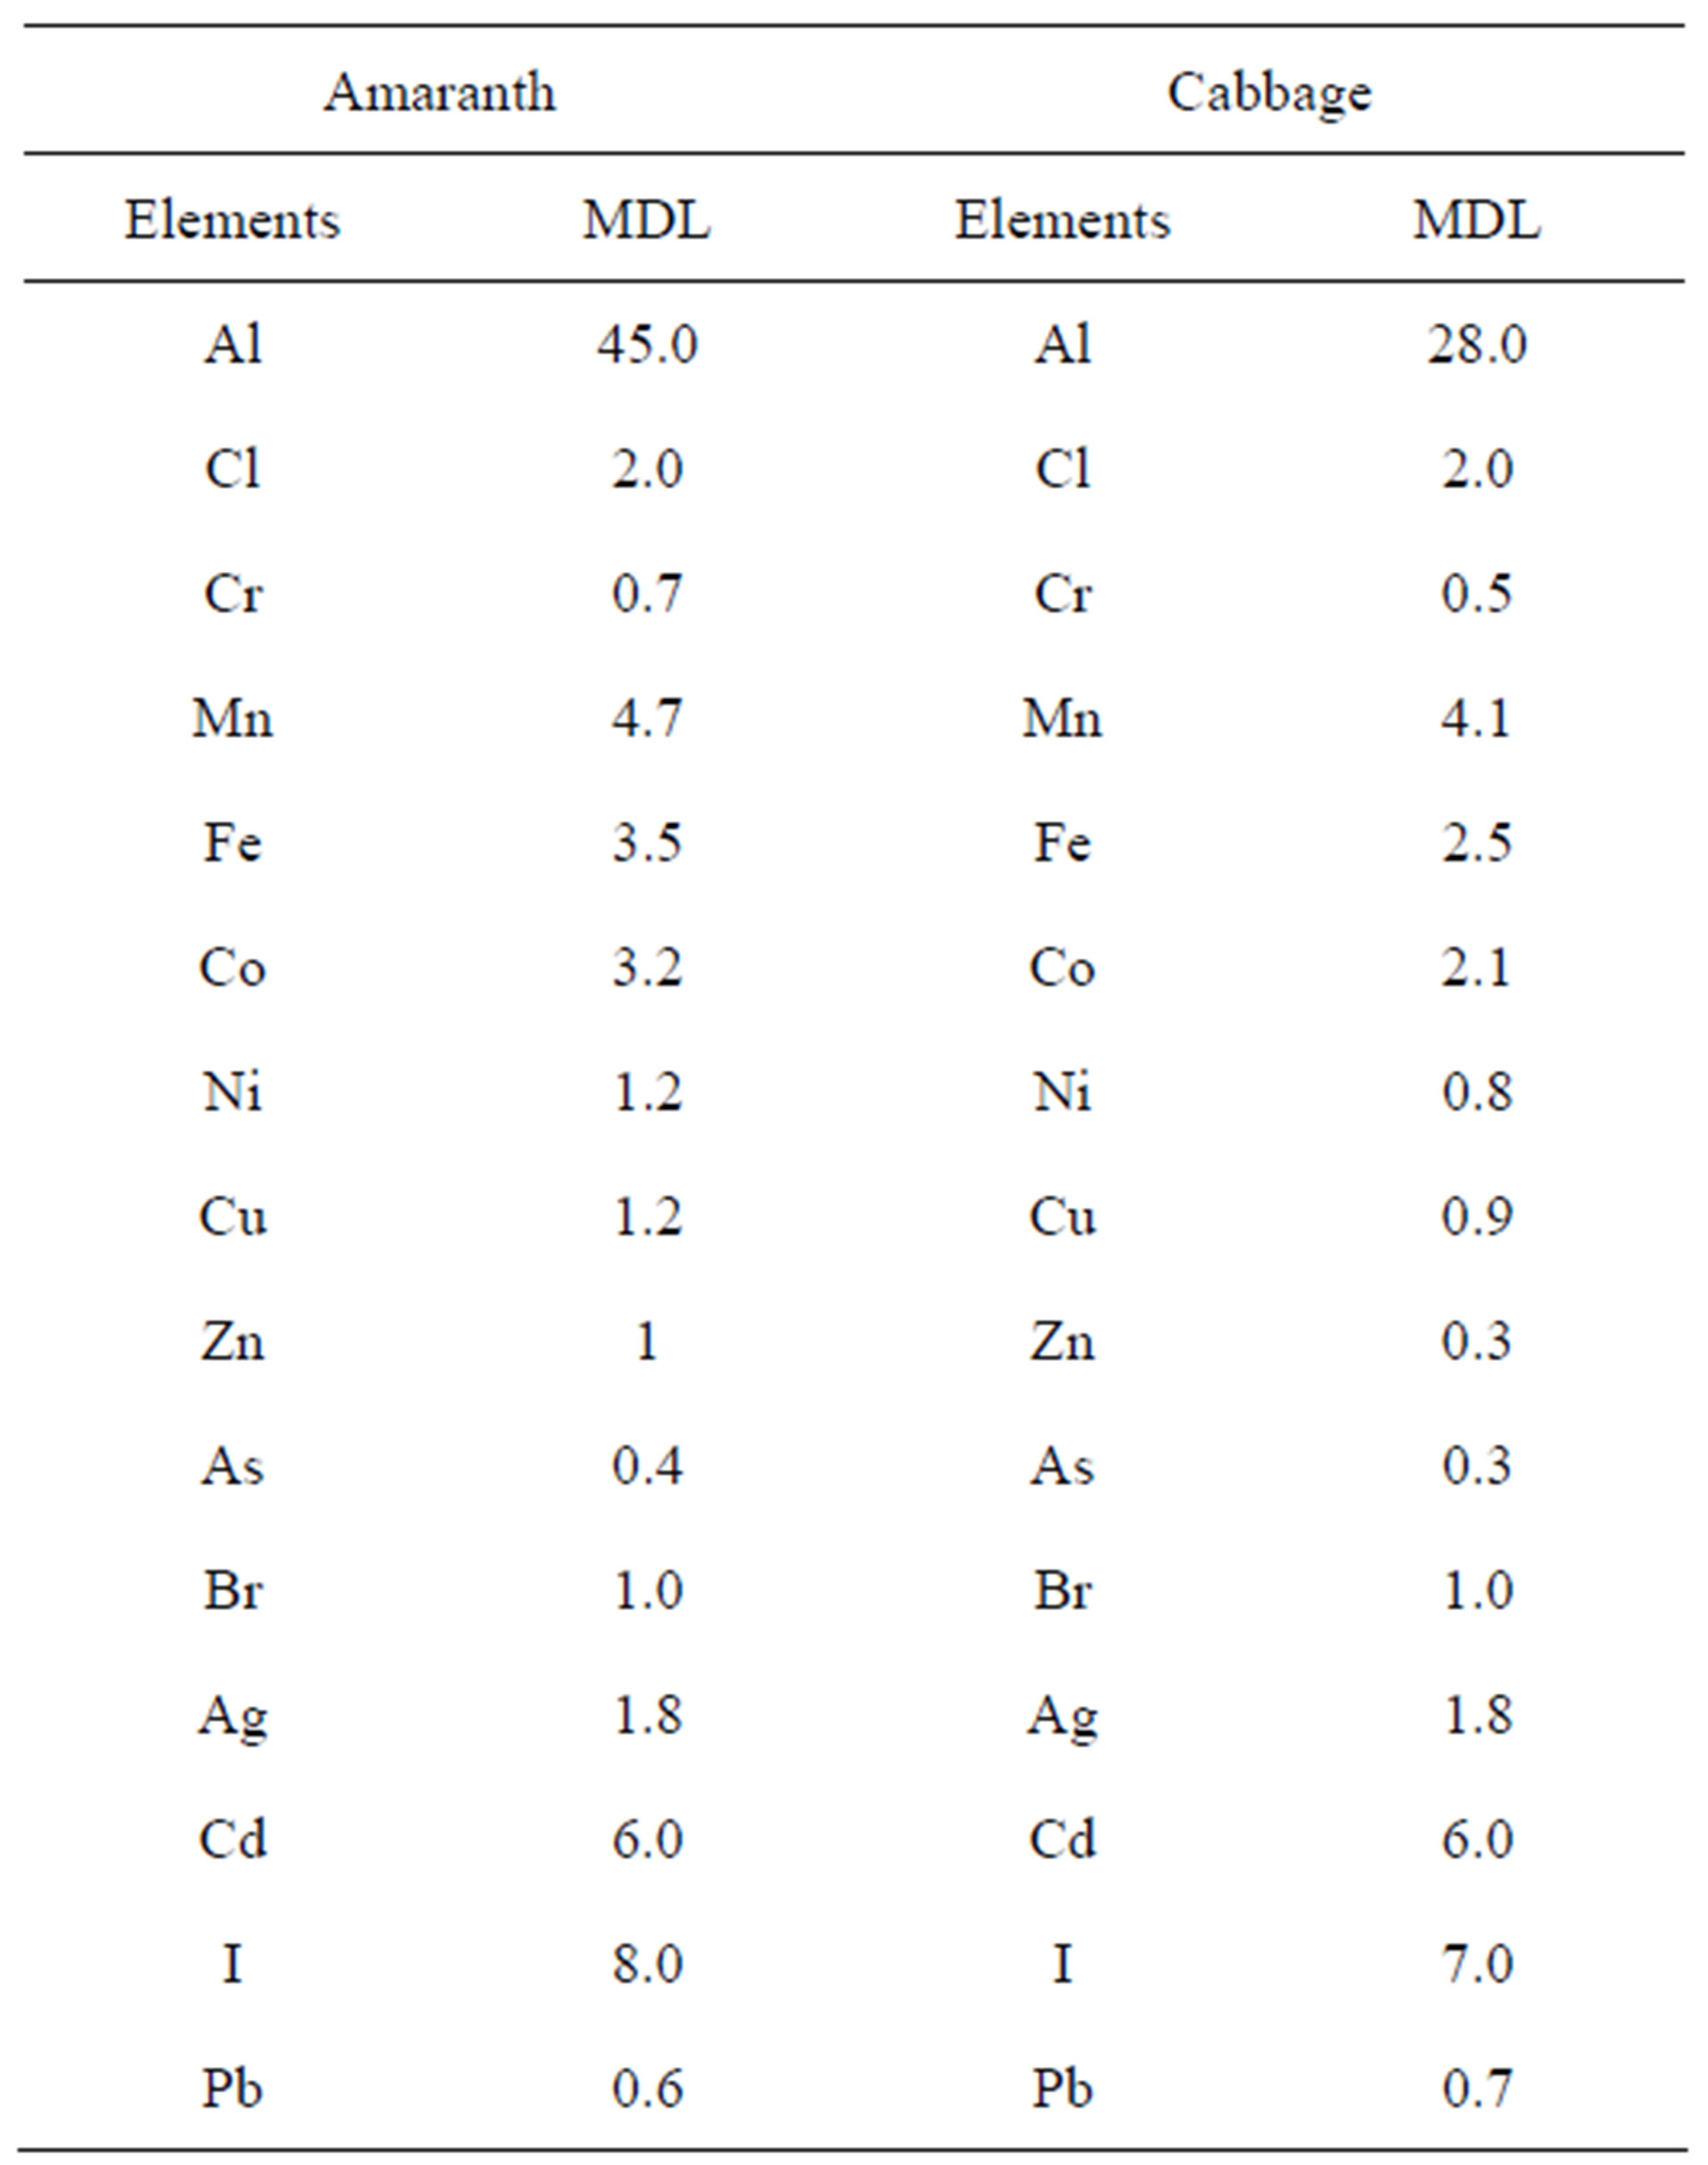
Table 2. The minimum detection limit (MDL) (µg/g) of the EDXRF system used in this study for elements in amaranth and cabbage.
higher concentration of only Zn, while Br was significant (p ≤ 0.05) higher in MK than FL. The difference for the rest of the elements were not statistical significant.
The Cd values in both groups were below MDL value of 6 µg/g of the EDXRF system used in this study. However, the 6 µg/g (MDL) is 30 times higher than 0.2 µg/g set as minimum tolerable limit (MTL) by FAO/WHO [16]. The MDL value was also higher than 0.4 µg/g, and 5.27 µg/g reported in 2 different studies of amaranth from Dar es Salaam [9,17]. On the other hand, the MDL value in this study was lower than the mean concentration values of Cd in amaranth grown in a heavy contaminated area in India [18]. As Cd is toxic and carcinogenic further analysis using instrument with lower MDL is recommended.
The mean concentrations of Pb in both groups of sample were approximately 3 times higher than 0.3 µg/g, set as MTL by FAO/WHO [16]. Pb is in high concentrations in amaranth analyzed in this study probably because majority of the farms are located near the main roads where they receive high amount of Pb from the road traffic. The mean concentration of Pb in this study were comparable to the values reported by Othman, 2001 in samples from farms which are located along the high ways in Dar es Salaam [9]. However, this value was much lower than the mean concentrations in amaranth
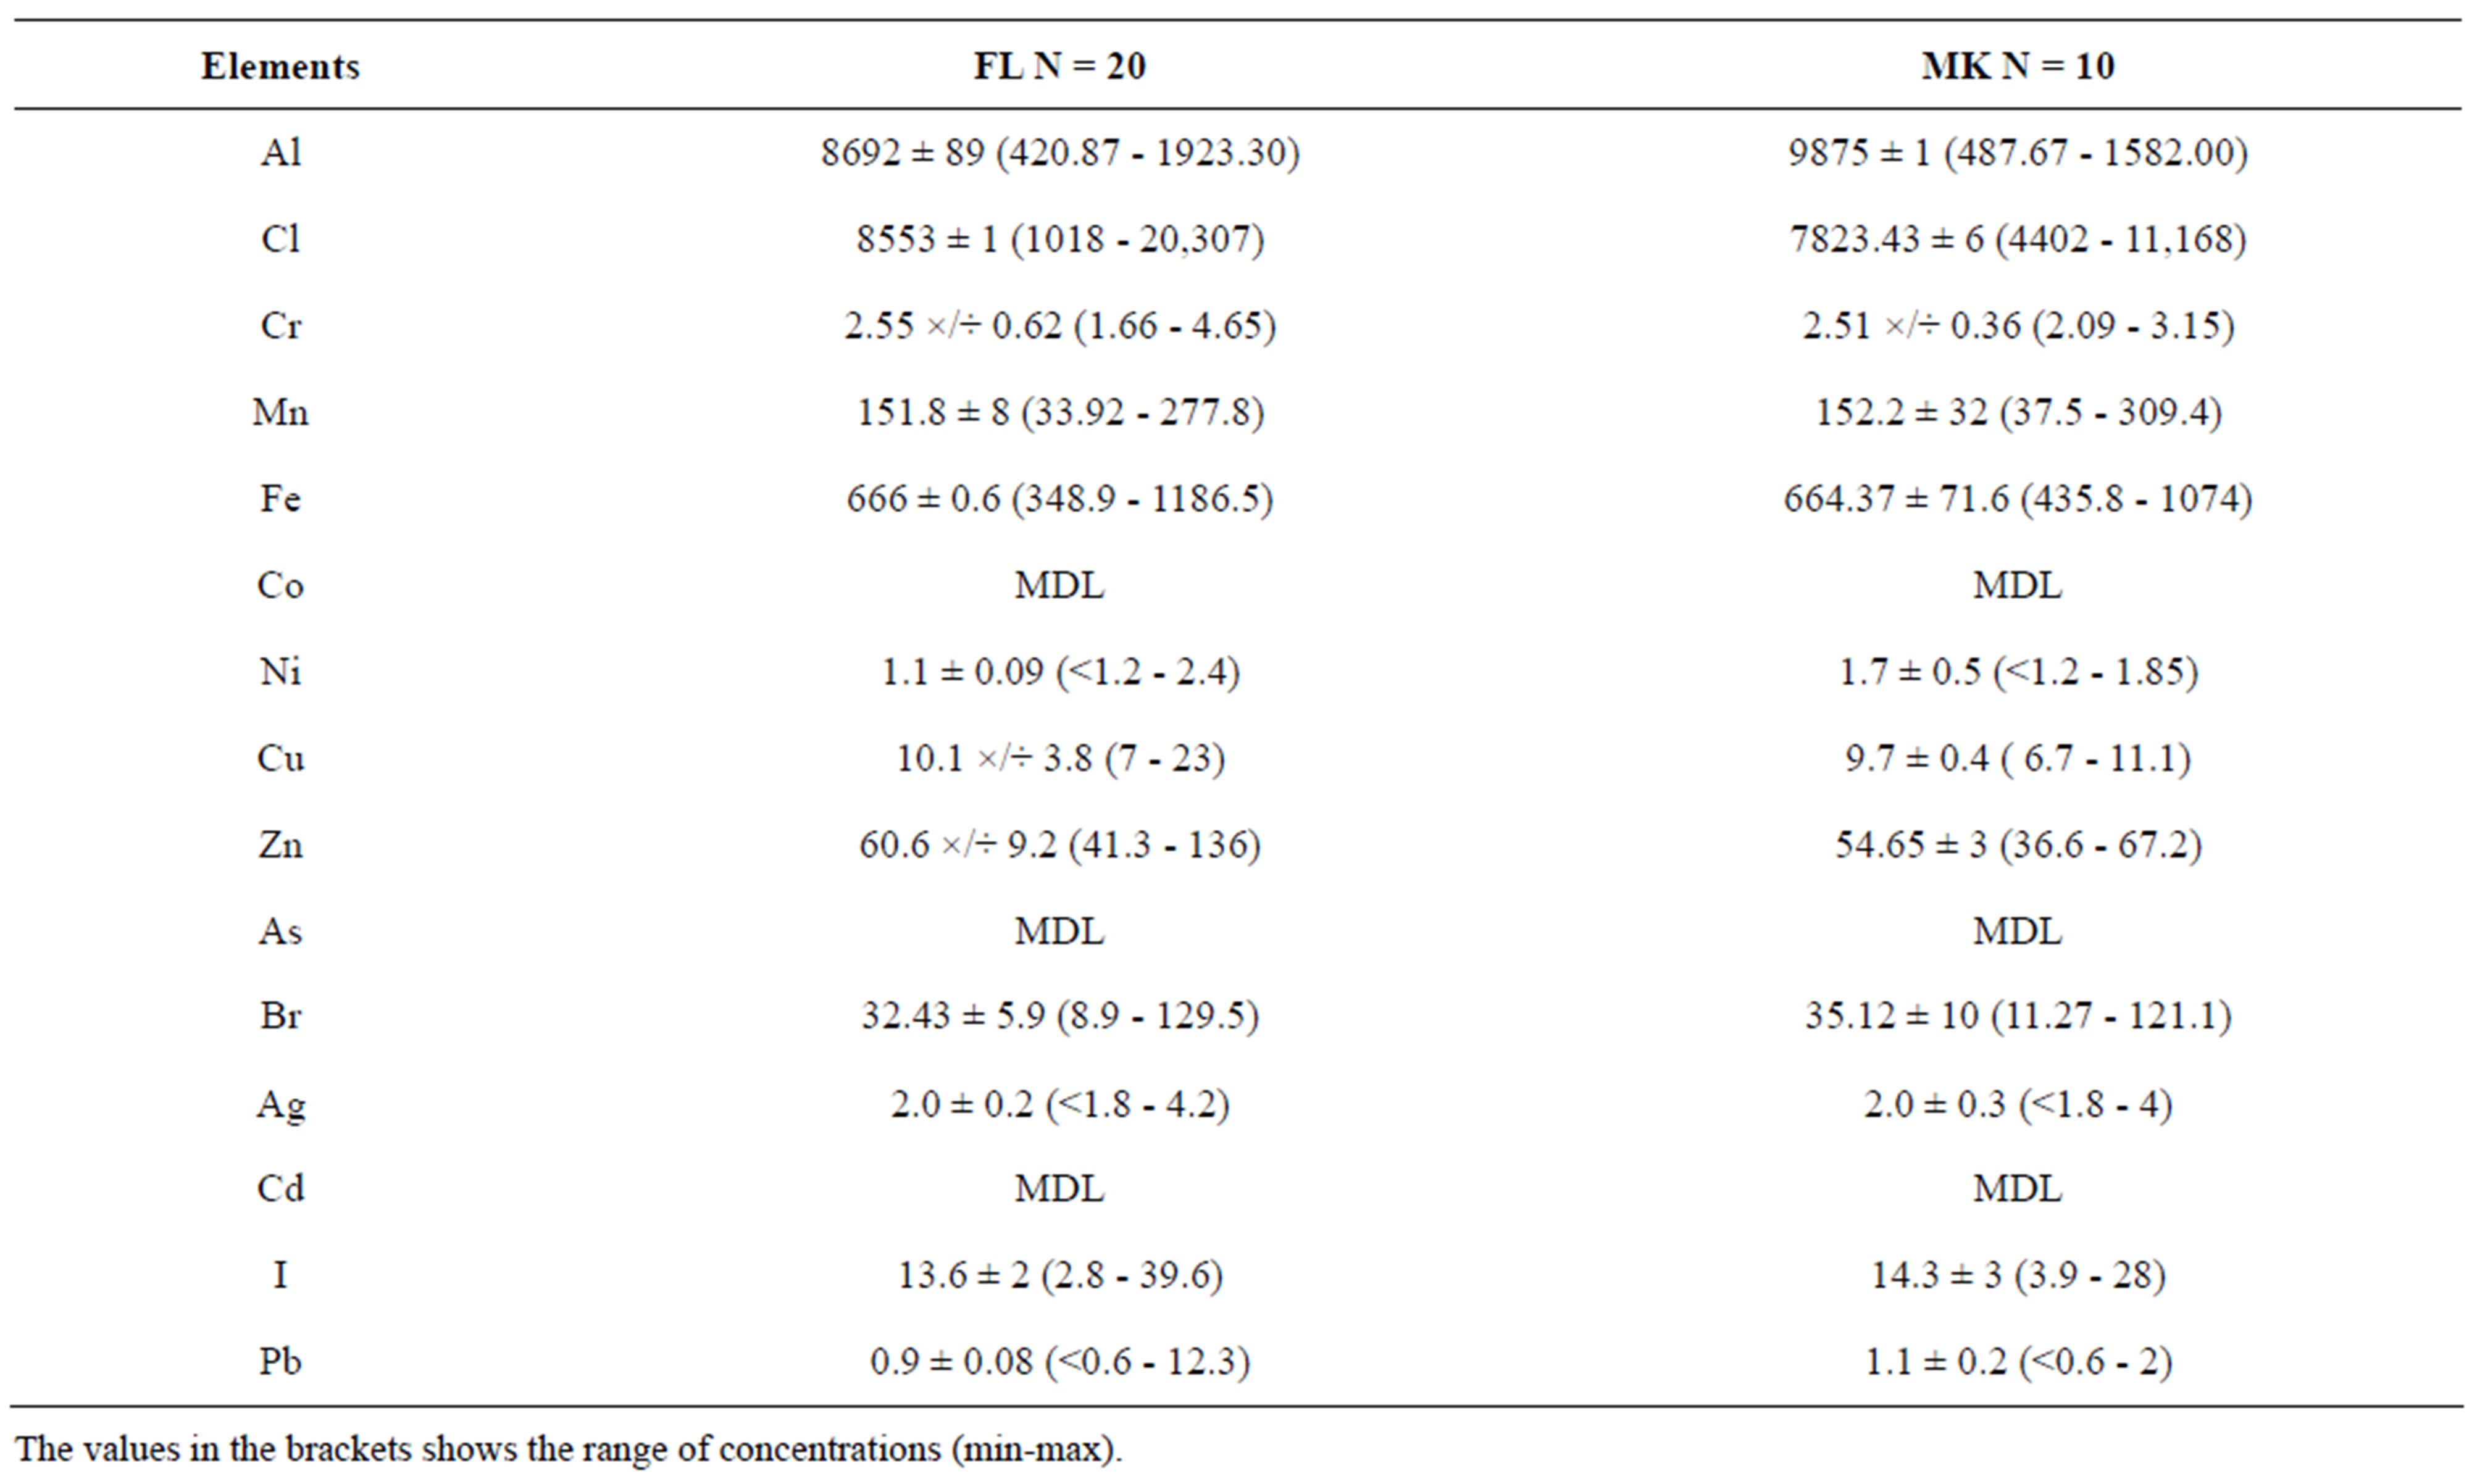
Table 3. The average concentrations (µg/g) A.M ± SEM and G.M ×/÷ of selected elements obtained in amaranth collected from Farms (FL) and Markets (MK).
reported in Nigeria and India [18-20].
The concentrations of Cr in samples from amaranth in this study lie between 1.66 - 4.65 µg/g. This value is lower than the range reported in contaminated amaranth from Varanasi, India [21]. The range of Cr in this study was also found to be in the range of that reported in samples collected in different areas of Dar es Salaam (1.15 - 6.13) µg/g [17].
3.2. Cabbage
Table 4 shows the concentration of elements determined in samples of cabbage. The elements that are normally distributed are reported using arithmetic means while elements that were not normal distributed are reported using geometric means.
As Table 4 shows there are big differences of mean elemental concentration between samples from farms (FL) and those from markets (MK). The t-test indicated that samples from FL had significantly (p ≤ 0.05) higher values of Al, Cl, Fe, Cu, and Zn, while MK had significant higher concentration of Br and I. The mean concentration of Pb was found to be comparable to the mean concentrations reported in different locations in Dar es Salaam [9]. However, the value was above the MTL of 0.3 µg/g set by FAO/WHO [16].
The concentrations of Cd and Ni from samples of cabbage collected at Mwera are presented in a separate table (Table 5). This is because the Cd and Ni concentrations in samples from this farm are extremely higher than the concentration values obtained in samples of cabbage collected from other areas in Zanzibar.
The mean concentration of Ni in samples from Mwera was lower than those reported in literature reviewed in this work [5,18,20]. However the value was above MTL of 0.2 µg/g set by FAO/WHO [16]. On the other hand, Cd was found in mean concentration which was approximately 208 times higher than 0.2 µg/g value set as MTL by FAO/WHO [16]. The farm in which the samples were collected was reported to use phosphate fertilizer commonly known as booster. Phosphate fertilizers have been shown to contain high amount of heavy metals including Cd and Ni [11]. Thus long term accumulation of these elements in soil might have been passed to the vegetables through a root uptake. The concentrations of Cd found in sample from this farm are alarming hence; further analysis which will include more samples is needed to have a definite statistical conclusion.
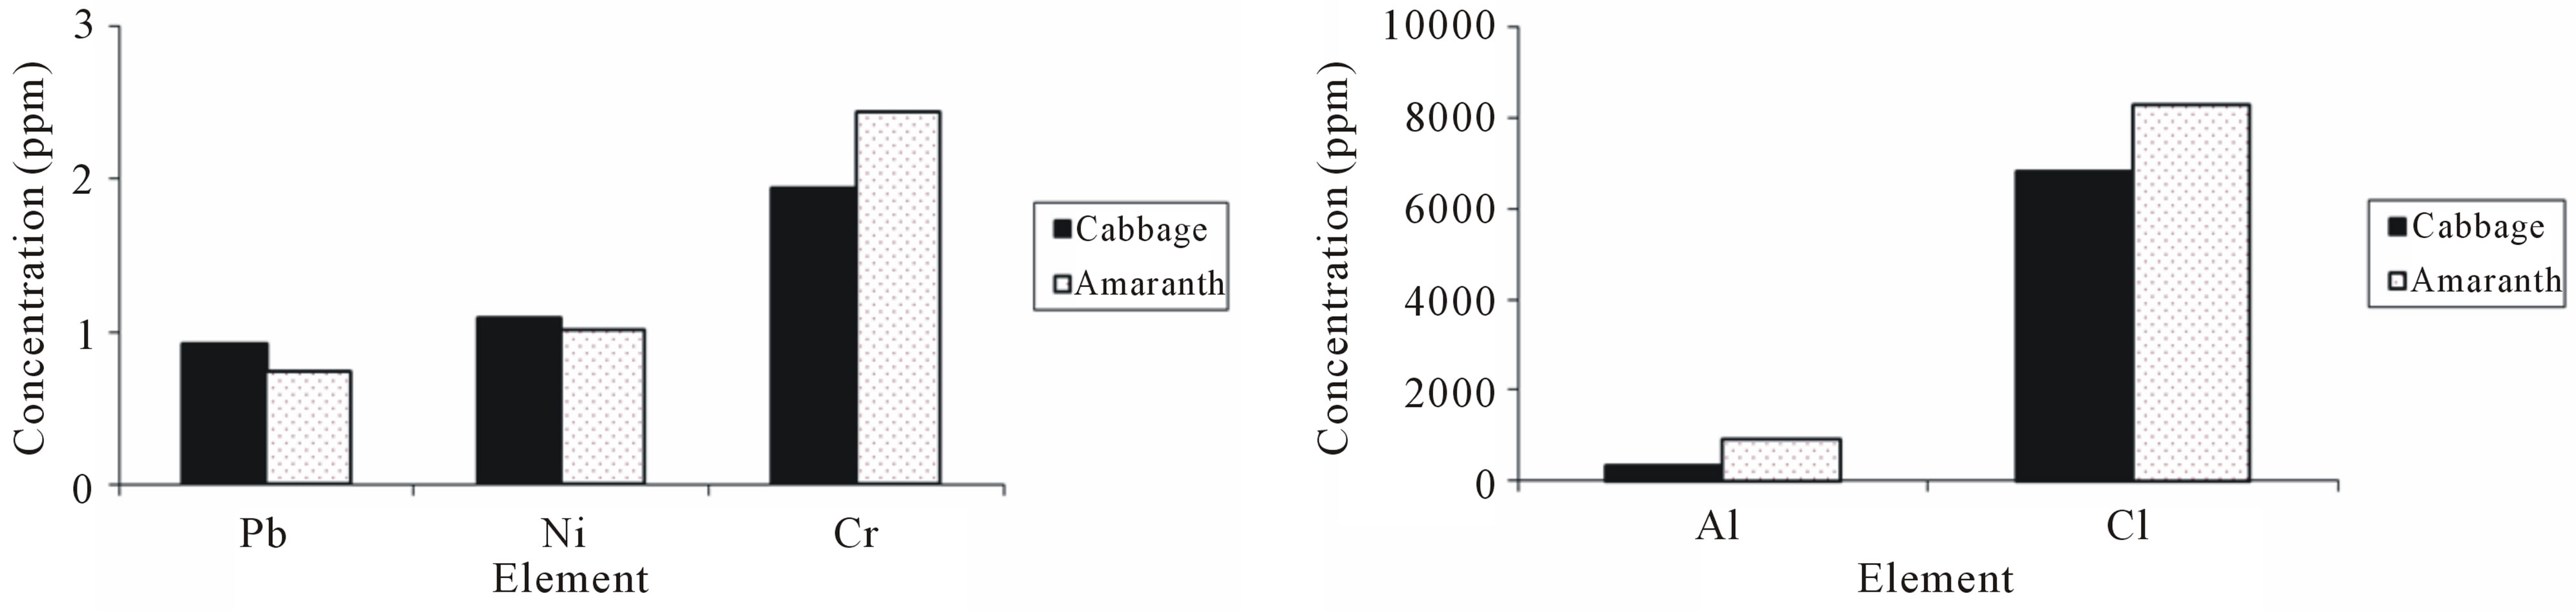
Figures 2(a)-(d) compare the mean concentration values of elements in amaranth with those found in cabbage. The t-test indicated that, samples of amaranth had significantly (p ≤ 0.05) higher concentration of Al, Cl, Cr, Mn, Fe and Zn than samples of cabbage. The mean concentrations of Zn and Fe in amaranth were 58 ± 5 µg/g
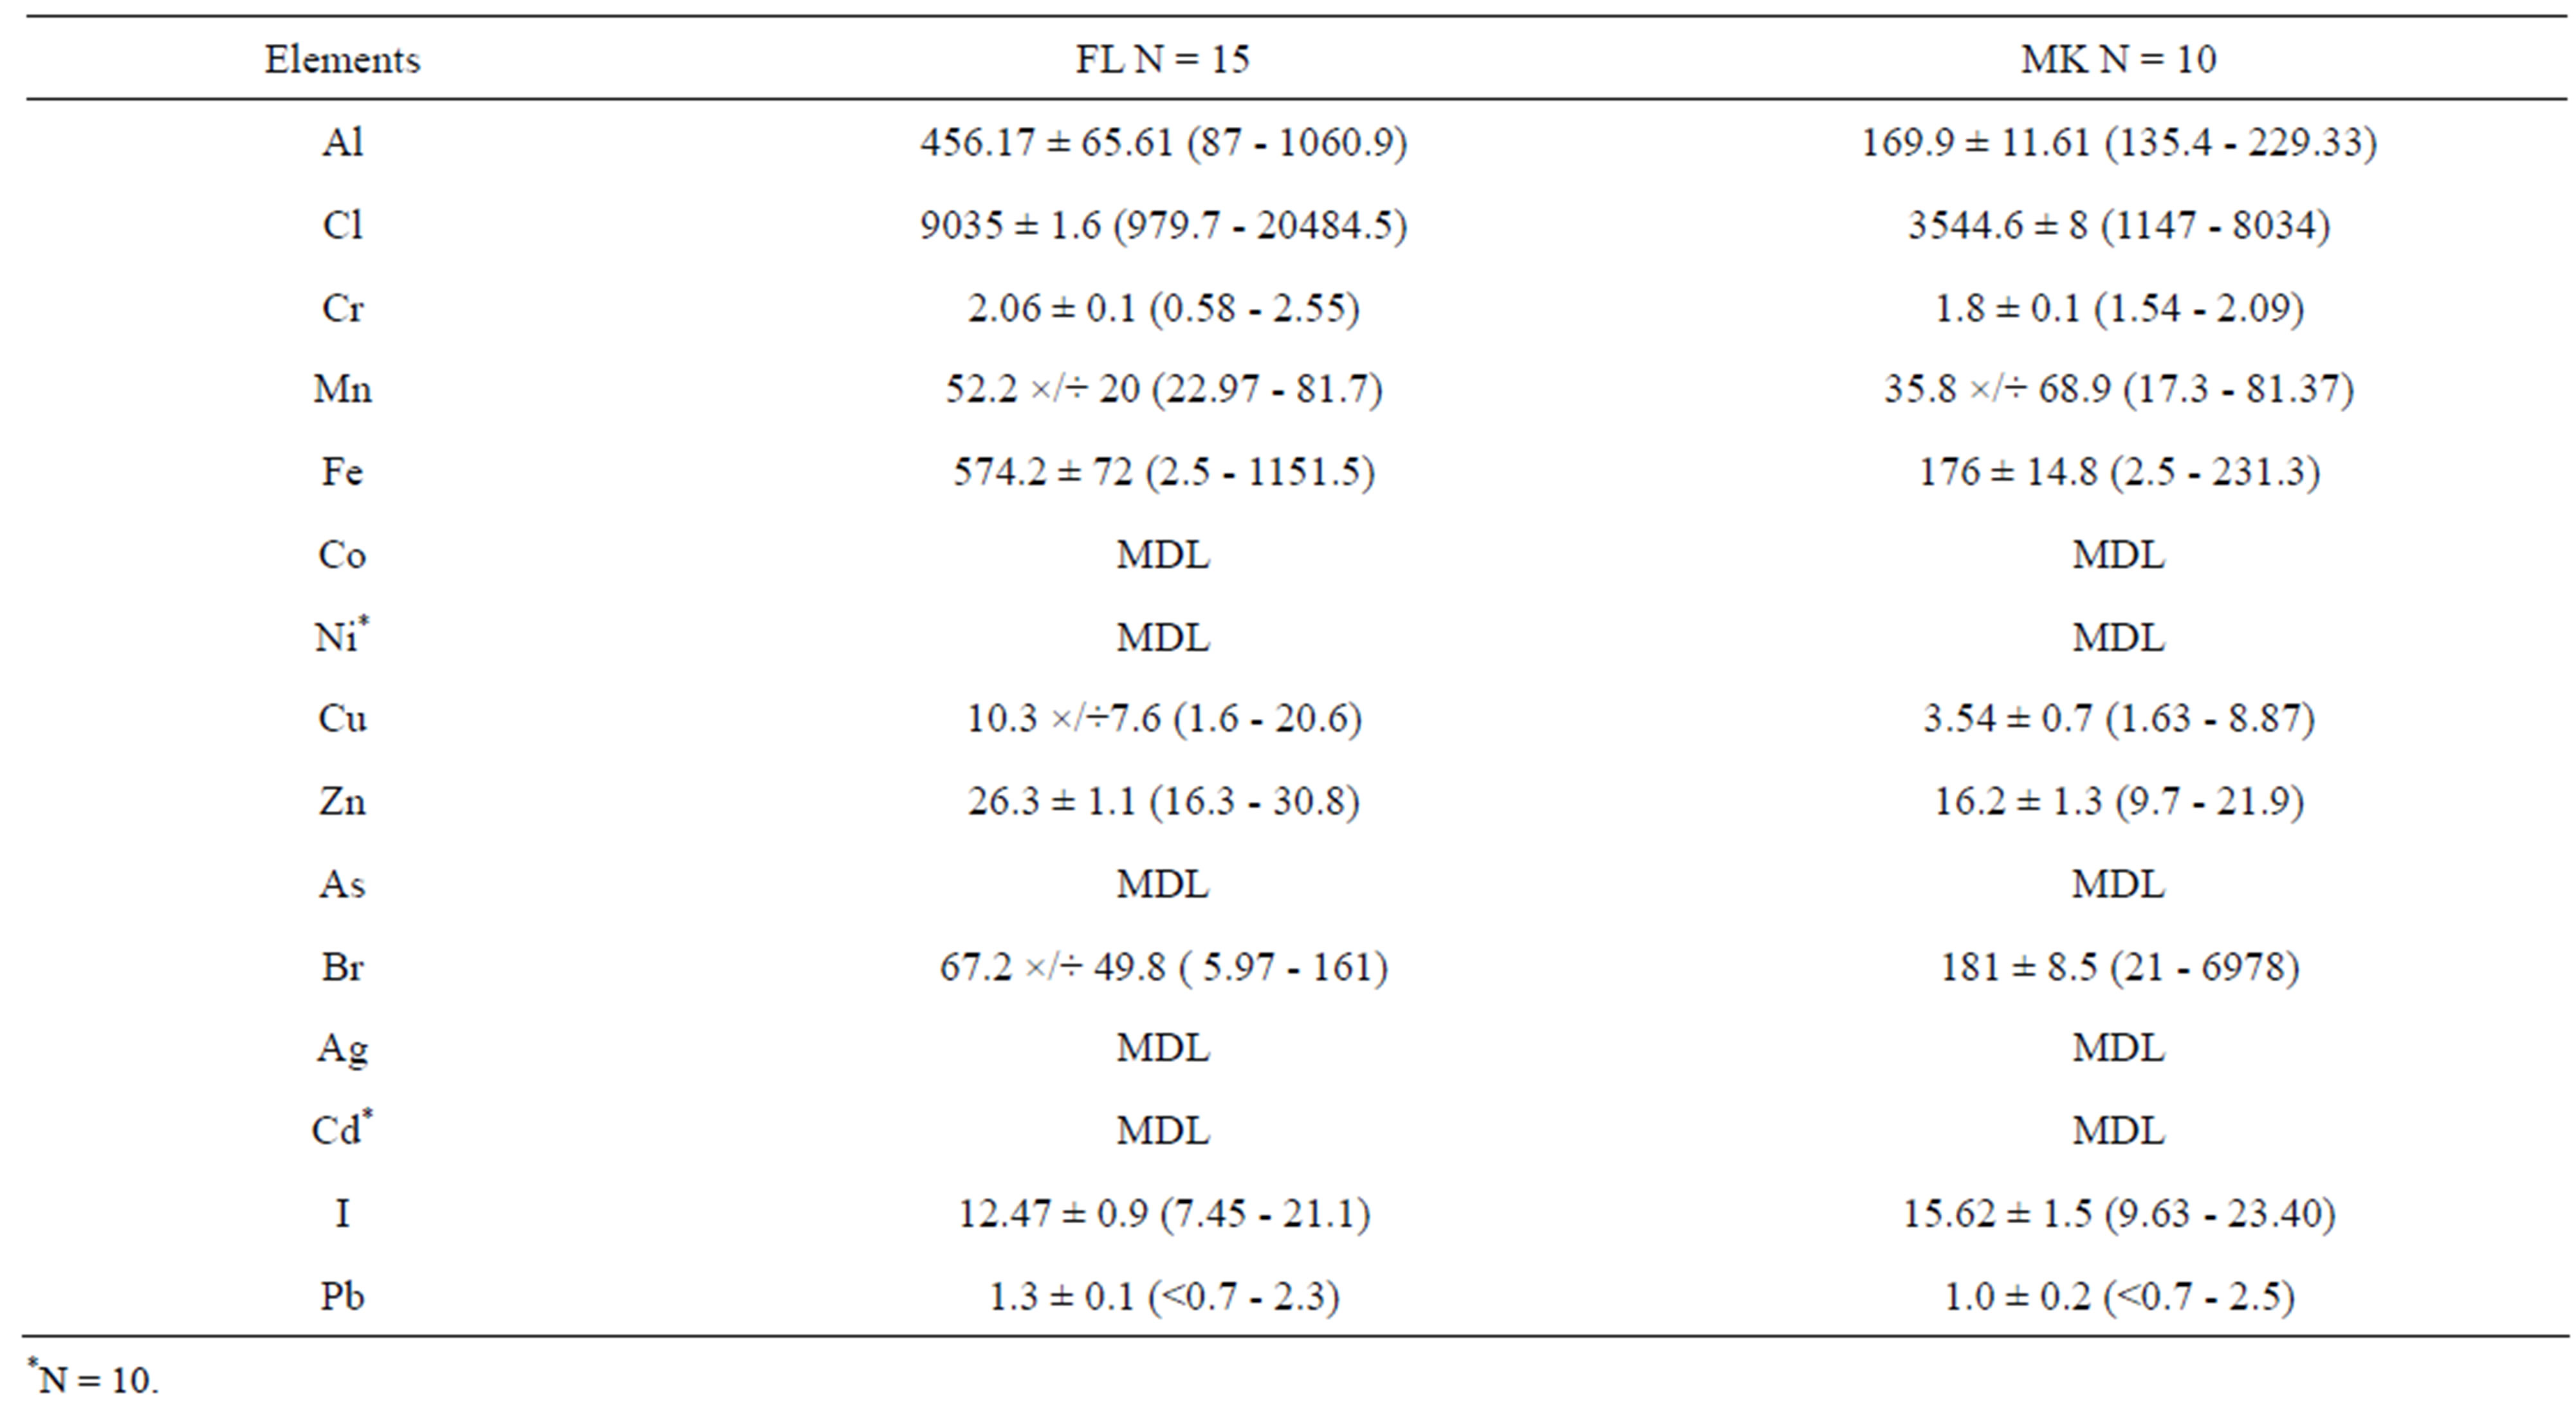
Table 4. The average concentrations (µg/g) of selected elements determined in cabbage Arithmetic mean (A: Mean ± SEM) and Geometric Mean (G. Mean ×/÷ SD) are presented.
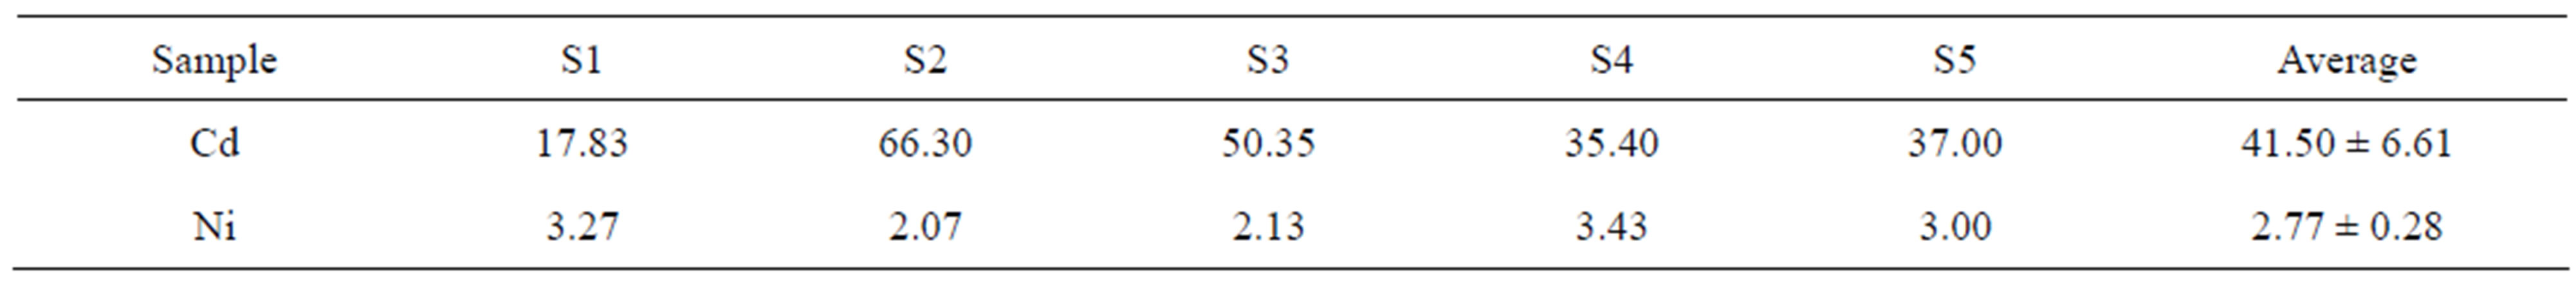
Table 5. The elemental concentration of Cd and Ni (µg/g) in samples of cabbage from Mwera.
 (a)
(a)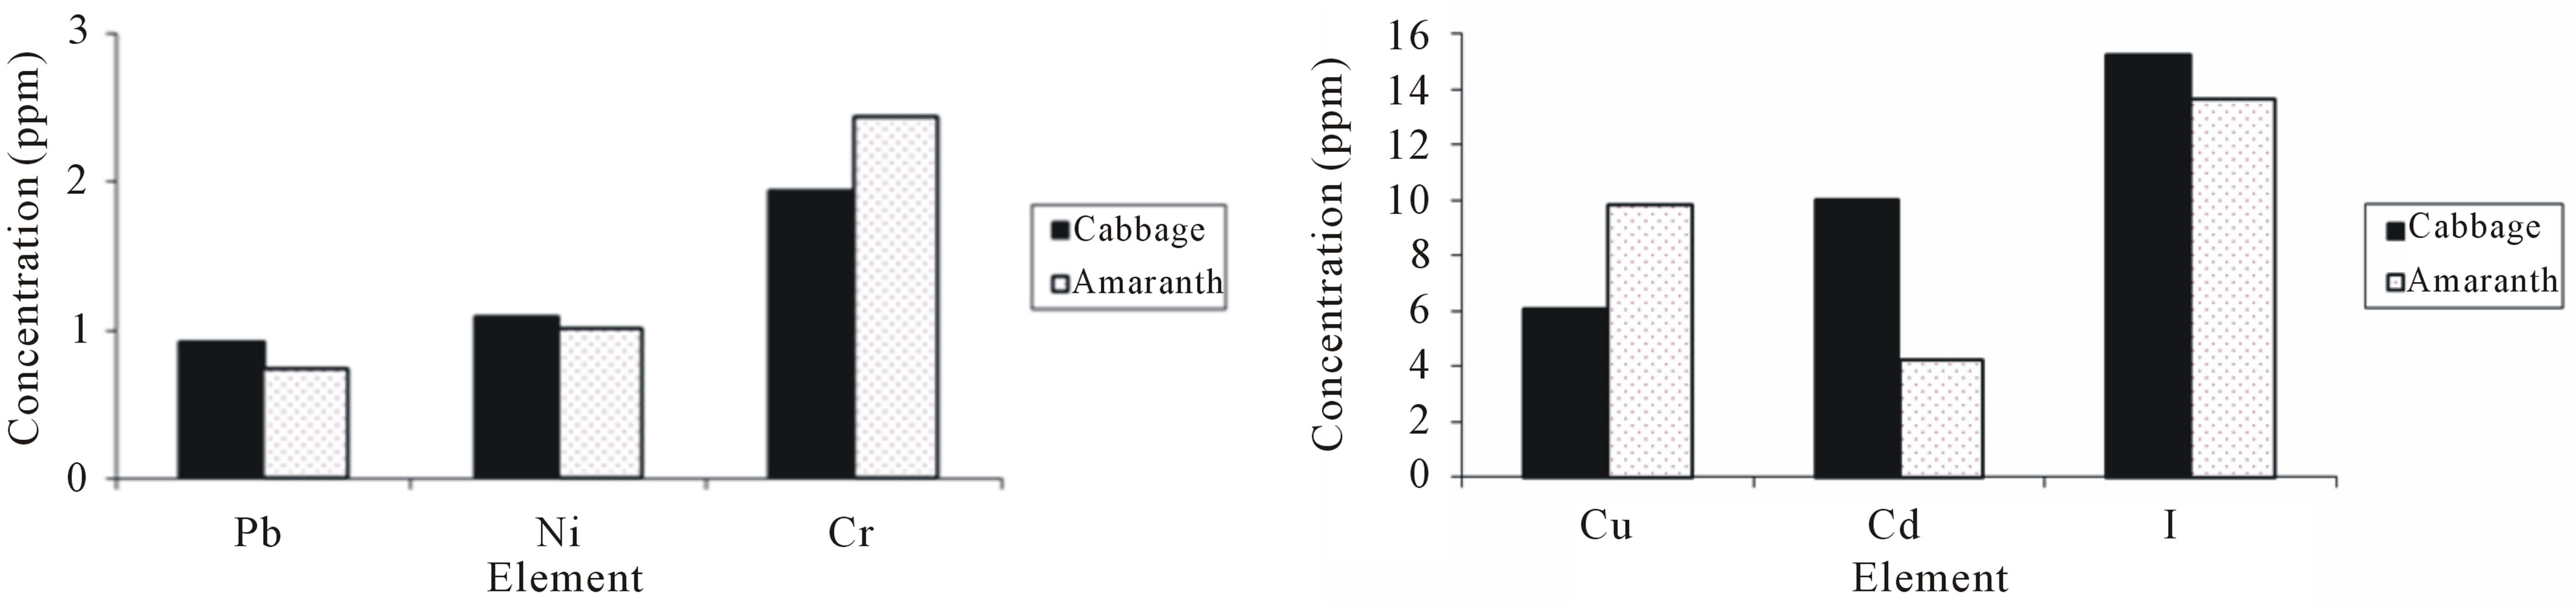 (b)
(b)
Figure 2. The histograms showing the concentrations of selected elements in samples from amaranth and cabbage.
and 666 ± 60 µg/g which were 3 times and 1.3 times, respectively higher than the mean concentrations in samples of cabbage, making amaranth more nutritious than cabbage. The concentration of Pb and I were similar in both vegetables. The difference in concentration of Cu was not statistically significance between cabbage and amaranth, however the highest mean concentration of Cu was found in samples from amaranth. On the other hand, the samples of cabbage had significant (p ≤ 0.05) higher mean concentrations of Ni, Cd and Br. The concentration of toxic elements Ni and Cd were 1.5 and 14 times, respectively higher in cabbage than in amaranth. Therefore cabbage consumed in Zanzibar exposes the population to toxic elements more than amaranth.
In this study toxic elements Co and As were found to be below MDL. However, the MDL for Co and As in this study were higher than their values reported in literature [20,22]. Al, Cl and Br, were not reported in any of the literature reviewed in this study, however, they were found in high concentrations in all samples of amaranth and cabbage from UW Zanzibar.
4. CONCLUSION
Thirteen elements which are Al, Cl, Cr, Mn, Fe, Ni, Cu, Zn, Br, Ag, Cd, I and Pb were determined in concentration above the MDL of the EDXRF system used in this study. The MDL for Co and As were higher than the range of these elements reported in vegetables in literature. The MDL for Cd in this study was also high (6 µg/g), hence Cd was not reported in any sample of reported in any sample of amaranth and was found in only 33% of the total samples of cabbage analyzed in this study. The mean concentration of Cd in samples of cabbage collected at Mwera was extremely high. This value (41.55 µg/g) is 208 times higher than MTL (0.2 µg/g) for Cd set by FAO/WHO. The value is also higher than the mean values reported from contaminated areas in Dar es Salaam. The high concentrations of Cd in cabbage from Mwera are associated with the applications of fertilizer commonly known as booster. The concentrations of Cr in both vegetables were within the MTL set by FAO/WHO. The concentrations of Pb were found to be similar to the values reported in samples from different places in Dar es Salaam. However, these values were above the MTL set by FAO/WHO. The concentrations of the essential elements were significantly higher (p < 0.05) in samples of amaranth than cabbage. However, samples of cabbage had higher concentrations of toxic elements Cd and Ni. Therefore, consumption of amaranth and cabbage from UW Zanzibar may expose consumers to elements which are hazardous to their health. The toxicity is more in cabbage than amaranth.
5. ACKNOWLEDGEMENTS
This research has been financially supported by the University of Dodoma. The Author will also like to acknowledge the staff of Institute of Marine science Zanzibar and Tanzania Atomic Energy Commission in Arusha for their technical advice and support.
REFERENCES
- Lokeshwari, H. and Chandrappa, G.T. (2006) Impact of heavy metal contamination of Bellandur Lake on soil and cultivated vegetation. Current Science, 91, 622-627.
- Eslami, A., Khaniki, Gh.R.J., Nurani, M., Meharasbi, M., Peyda, M. and Azimi, R. (2007) Heavy metals in edible green vegetables grown along the sites of the Zanjan roads Iran. Journal of Biological Sciences, 7, 943-948. doi:10.3923/jbs.2007.943.948
- Arora, M., Kiran, B., Rani, S., Rani, A., Kaur, B. and Mittal, N. (2008) Heavy metal accumulation in vegetables irrigated with water from different sources. Food Chemistry, 111, 811-815. doi:10.1016/j.foodchem.2008.04.049
- Kawatra, B.L. and Bakhetia, P. (2008) Consumption of heavy metal and minerals by adult women through food in sewage and tube-well irrigated area around Ludhiana city (Punjab, India). Journal of Human Ecology, 23, 351- 354.
- Sharma, R.K, Agrawal, M. and Marshall, F.M. (2007) Heavy metals contamination of soil and vegetables in suburban areas of Varanasi, India. Ecotoxicology and Environmental Safety, 66, 258-266. doi:10.1016/j.ecoenv.2005.11.007
- Haiyan, W. and Stuanes, A. (2003) Heavy metal pollution in air-water-soil-plant system of Zhuzhou city, Hunan province, China. Water, Air and Soil Pollution, 147, 79- 107. doi:10.1023/A:1024522111341
- Nwajei, G.E. (2009) Trace elements in soils and vegetations in the vicinity of shell Petroleum Development Company operating area in Ughelli, delta state of Nigeria. American Eurasian. Journal of Sustainable Agriculture, 3, 574-578.
- Bahemuka, T.E. and Mubofu, E.B. (1999) Heavy metals in edible green vegetables grown along the sites of the Sinza and Msimbazi rivers in Dar es Salaam, Tanzania. Food Chemistry, 66, 63-66. doi:10.1016/S0308-8146(98)00213-1
- Othman, O.C. (2001) Heavy metals in green vegetables and soils from vegetable gardens in Dar es Salaam, Tanzania. Tanzania Journal of Science, 27, 37-48. doi:10.4314/tjs.v27i1.18334
- Petersen, S.O., Sommer, S.G., Béline, F., Burton, C., Dach, J., Dourmad, J.Y., Leip, A. Misselbrook, T., Nicholson, F., Poulsen, H.D., Provolo G., Sørensen, P., Vinnerås, B., Weiske, A., Bernal, M.P., Böhm, R., Juhász, C. and Mihelic, R. (2007) Recycling of livestock manure in a whole-farm perspective. Journal of Livestock Science, 112, 180-191. doi:10.1016/j.livsci.2007.09.001
- Modaihsh A.S., Al Swailem, M.S. and Mahjoub, M.D. (2004) Heavy metal content of commercial inorganic fertilizers used in the Kingdom of Saudi Arabia. Agricultural and Marine Sciences, 9, 21-25.
- WHO (1995) Lead. Environmental Health Criteria. World Health Organization, Geneva, 165.
- Jarup, L. (2003) Hazards of heavy metal contamination. Impact of environmental pollution on health: Balancing risk. British Medical Bulletin, 68, 167-182. doi:10.1093/bmb/ldg032
- WHO (1992) Cadmium. Environmental Health Criteria. World Health Organization, Geneva, 280.
- Census (2000) Tanzania population and housing census.
- FAO/WHO (2001) Food additives and contaminants, Joint Codex Alimentarius Commission, FAO/WHO. Food standards Programme, ALINORM 01/12A.
- Kihampa, C. and Mwegoha, W.J.S. (2010) Heavy metals concentrations in vegetables grown along the Msimbazi River in Dar es Salaam, Tanzania. International Journal of Biological and Chemical Sciences, 4, 1932-1938.
- Singh, S., Zacharias, M., Kalpana, S. and Mishra, S. (2012) Heavy metals accumulation and distribution pattern in different vegetable crops. Journal of Environmental Chemistry and Ecotoxicology, 4, 75-81.
- Adewuyi, G.O., Dawodu, F.A. and Jibiri, N.N. (2010) Studies of the concentration levels of heavy metals in vegetable (Amaranth caudatus) grown in dumpsites within Lagos metropolis, Nigeria. The Pacific Journal of Science and Technology (PJST), 11, 616-621.
- Haloi, A., Clarice, R., Thabah, D., Limbul, K., Paul, S., Dkhar and Chakraborty, R. (2010) Assessment of certain essential elements in some common edibles from Dadara and Agyathuri villages of Kamrup District of Assam. Journal of Human Ecology, 31, 79-85.
- Singh, A., Sharma, R.K., Agrawal, M. and Marshall, F.M. (2010) Risk assessment of heavy metal toxicity through contaminated vegetables from waste water irrigated area of Varanasi, India. Tropical Ecology, 51, 375-387.
- Itana, F. (2002) Metals in leafy vegetables grown in Adidas Ababa. Ethiopia. Journal of Health and Development, 16, 295-302.