Health
Vol.5 No.8B(2013), Article ID:35895,10 pages DOI:10.4236/health.2013.58A2010
Feasibility and acceptability of wrist actigraph in assessing sleep quality and sleep quantity: A home-based pilot study in healthy volunteers*
![]()
1School of Pharmacy, Pharmacy Australia Centre of Excellence, University of Queensland, Brisbane, Australia; #Corresponding Author: zaswiza.bintimohamadnoor@uqconnect.edu.au
2Kulliyyah of Pharmacy, International Islamic University Malaysia, Pahang, Malaysia
3School of Pharmacy, University of Otago, Dunedin, New Zealand
4Institute for Health and Biomedical Innovation and Centre of Accident Research and Road Safety, Queensland University of Technology, Brisbane, Australia
5School of Clinical Sciences, Queensland University of Technology, Brisbane, Australia
Copyright © 2013 Zaswiza Mohamad Noor et al. This is an open access article distributed under the Creative Commons Attribution License, which permits unrestricted use, distribution, and reproduction in any medium, provided the original work is properly cited.
Received 12 June 2013; revised 12 July 2013; accepted 1 August 2013
Keywords: Actigraphy; Sleep Quality; Sleep Quantity; Home-Based; Good Sleepers
ABSTRACT
Purpose: This study aimed to determine the feasibility and acceptability of actigraphy to monitor sleep quality and quantity in healthy self-rated good sleeper adults at home-based settings. Method: Sixteen healthy volunteers (age > 18) were invited to participate. Each participant was provided with a wrist actigraph device to be worn for 24-hour/day for seven consecutive days to monitor their sleep-wake patterns. Actigraphy data were downloaded using proprietary software to generate an individual sleep report. Participants also completed a set of self-reported Health Related Quality of Life (HRQOL) using WHO (five) Well Being Index (WBI) questionnaires. Results: Actigraphy was well accepted by all participants. Only 43.8% of the participants achieved normal total sleep time (TST) and 62.5% had a mean sleep efficiency value below the normal range. Despite a reduced quality of sleep among the participants, the self-reported HRQOL scores produced by the WHO-5 WBI showed a “fair” to “good” among the participants. Conclusions: To maintain healthy wellbeing, it is vital to have efficient and quality sleep. Insufficient and poor sleep may contribute to various health problems and hazardous outcomes. People often believe they have normal and efficient sleep, not realising they may be developing poor sleep habits. This study found that actigraphy can be easily utilized to monitor sleep-wake patterns at home-based settings. We proposed that actigraphy could be adapted for use in the primary care settings (e.g. community pharmacy) to improve the sleep health management in the community.
1. INTRODUCTION
Sleep is essential for an individual’s health and wellbeing, thus having a quality sleep is as important as having a good diet and getting regular exercise [1]. Epidemiological data indicate that poor and insufficient sleep may be linked to some chronic diseases such as hypertension, diabetes, depression and obesity. Poor sleep contributes to hazardous outcomes, for instance industrial disasters, medical and occupational errors, difficulty performing daily tasks due to daytime sleepiness, as well as unintentionally falling asleep while driving leading to motor vehicle crashes [2,3]. Irritability, moodiness, impaired memory, and inability to multitask are some of the signs associated with lack of sleep.
In fact, a variety of adverse health behaviours and impairment in health-related quality of life (HRQOL) domains such as general health, frequent physical and mental distress, depression symptoms and anxiety are significantly more likely to be reported as fair/poor in those with poor sleep [4]. It is also important to bear in mind that sleeping too much can possibly indicate the presence of health concerns as well. Thus, the right balance of sleep and wake time including proper sleep hygiene are essential to a healthy lifestyle. Generally, healthy adults need 16 hours of wakefulness and an average of eight hours of sleep at night [5,6]. However, sleep duration and sleep-wake patterns are vastly variable between individuals, cultures and lifestyles [7]. For example, alcohol and caffeine can produce a stimulating effect that increases sleep latency, hence chronic use of alcohol and drinking regular caffeinated drinks such as coffee and soft drinks before going to sleep may cause an individual to have longer sleep onset latency [8,9].
Many people believe that they have a normal sleep quality, thus may not be concerned about their sleep even though they may display poor sleep quality. A Swiss study which screened pharmacy customers to detect the likelihood of any sleep problem or daytime sleepiness based on the answers from online questionnaires found that 32% customers were suspected of having a disorder in at least one category of sleep disorders and 20.7% were suspected of having excessive daytime sleepiness [10]. Kashyap et al. (2012) screened 241 community pharmacy customers in a survey over a 4-week period and found that among the participants, 50.2% were regular snorers and 30.7%, 10.7% and 7.9% were at risk of insomnia, daytime sleepiness and obstructive sleep apnoea respectively [11]. Even though sleep disorders are highly prevalent in the community, they still remain under-diagnosed and inadequately treated [10]. Assessing and monitoring sleep [10,11] is the first step in preventing and treating the condition therefore appropriate validated measuring tools are essential. Assessment is also required to assess the quality and quantity of sleep following any treatment, particularly at home.
Polysomnography (PSG) is accepted as the gold standard assessment methodology for sleep in research and hospital settings [12,13]. However, in non-laboratory and community settings, such as home, where sleep assessment entails monitoring over many consecutive nights, PSG is impractical as it requires professional handling and expensive equipment [14-16]. At present, many different objective methods to assess sleep in home-based settings, such as sensitive bed sensors, non-contact biomotion sensors and wrist-worn Peripheral Arterial Tonometry (PAT), have been developed and used [17,18]. However, the literature suggests that methods which are less invasive, less expensive and more convenient in providing a 24-hour/day record of sleep should be considered as more appropriate for the home environment [18]. Still, there are limited studies on the acceptability of 24-hour home-based monitoring.
Actigraphy is a reliable alternative to PSG for measurement of habitual sleep-wake behaviour [19,20]. It can provide an accurate estimation of sleep-wake patterns in normal and healthy adult populations, and also in patients suspected of certain sleep disorders [21,22] which are related to disturbances of the circadian rhythm [23]. Actigraphy can conveniently record sleep-wake activities 24-hour/day over a period of one week or longer, and can generate automated sleep-wake scores based on validated scoring algorithms [24]. An actigraph is usually worn on the non-dominant wrist. An accelerometer in the actigraph has the ability to detect movement; therefore, it can be used as a proxy measure of activity levels [21,25]. Hence, certain sleep parameters such as percentage of sleep efficiency (SE%), total sleep time (TST), number of nocturnal awakenings (NWAK), wake after sleep onset (WASO), and sleep onset latency (SOL) [26,27] can be calculated from the actigraphy data to generate indices of sleep quality, sleep quantity and sleep-wake timing.
This paper describes a study intended to identify the feasibility and acceptability of utilizing actigraphy to assess sleep-wake patterns in healthy adults in a homebased setting. The outcomes of this study will support the development of an intervention for community pharmacies which utilizes actigraphy and the knowledge of pharmacists to improve sleep health management in primary care settings.
2. METHODS
2.1. Study Participants
Participants were a convenient sample of 16 healthy volunteers (five females and 11 males; mean age 28.25 ± 6.68 years) who were selected among university students and individuals working standard hours (Table 1). Recruitment was conducted from April to May, 2012. Exclusion criteria were diagnosed sleep disorders and/or associated symptoms, serious or acute illness and the use of sleep and psychotropic medicines. This study received ethical approval from the University of Queensland, School of Pharmacy Human Research Ethics Committee (ref: number 2012/04). Each participant involved in the study provided informed consent. Participation in this study was entirely voluntary and no monetary incentive was provided.
2.2. Instrumentation
2.2.1. Actigraph
We used the SBV2 Readiband™ (Fatigue Science, Honolulu, USA) wrist-worn actigraph to record participant’s sleep-wake patterns over seven days [28]. The hardware consisted of an accelerometer with the sensitivity to continuously track wrist movement and stores these data for later analysis. Devices were initialized to collect data in 1-minute epochs. The collected data was then wirelessly downloaded to a study computer for analysis using a Nordic 2.4 GHz ANT transceiver. Data
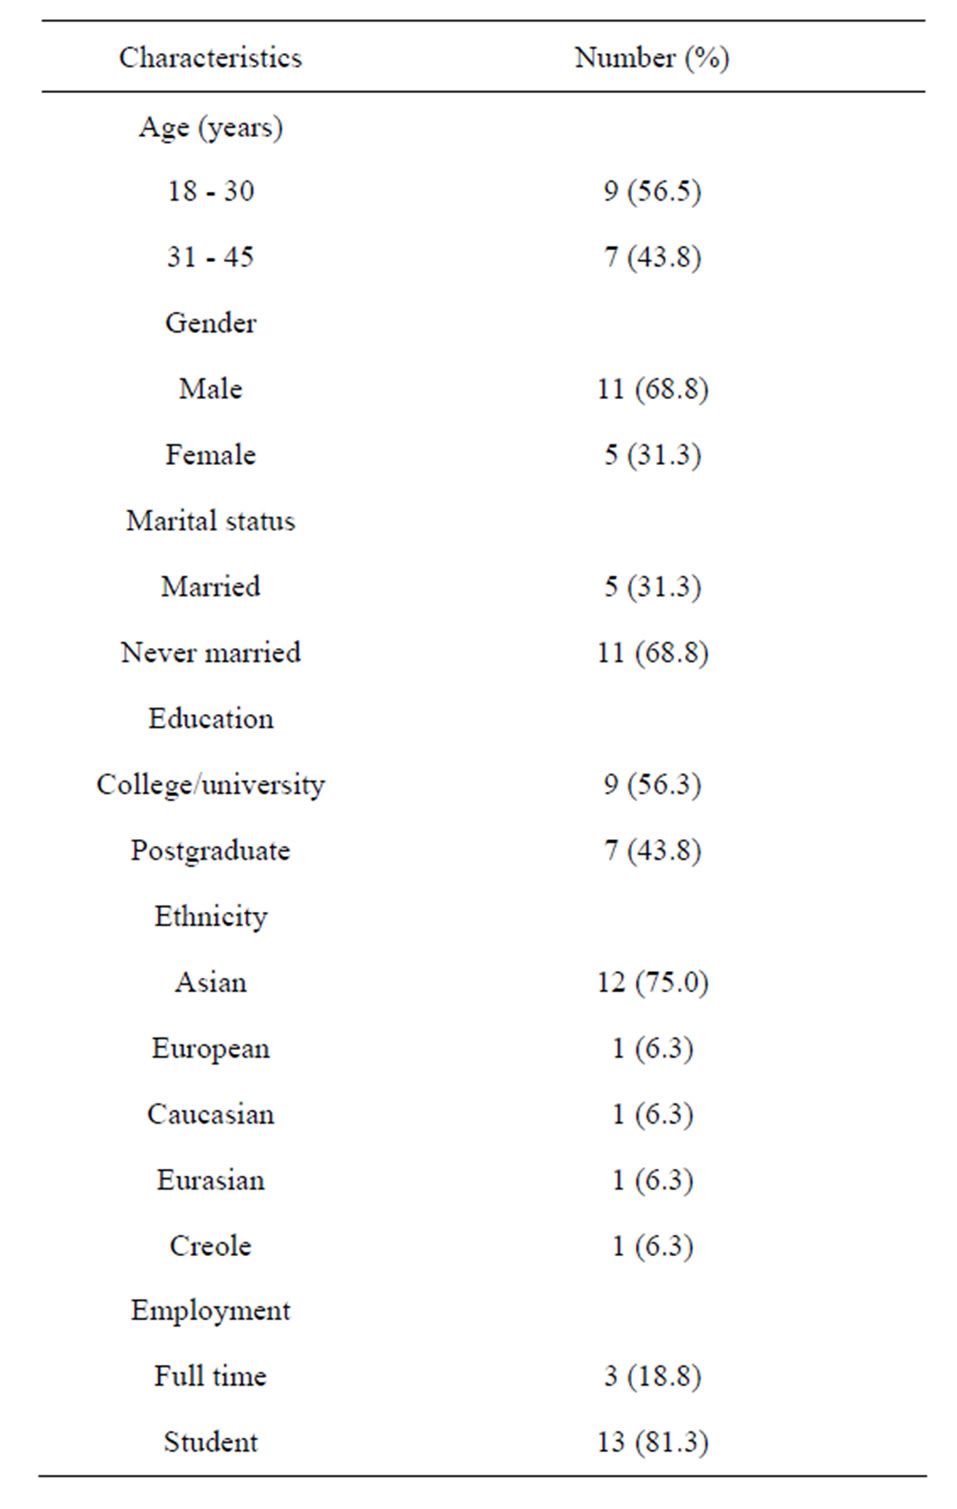
Table 1. Baseline demographic characteristics of the participants.
were analysed using software [28] and individualised reports were generated for each participant.
2.2.2. Questionnaires
A self-report questionnaire was used to collect baseline demographic information. At the end of the study, participants were asked to complete the validated World Health Organization (five) (WHO-5) Well-being Index 1998 version [29] to assess Health-Related Quality of Life (HRQOL) and a questionnaire consisting of questions on the utilization of actigraphy (e.g. appropriateness of the duration, difficulties and acceptability), plus questions on lifestyle modification from a validated survey [30]; smoking status (yes or no), number of cigarettes smoked (if any) and, alcoholic and caffeinated drinks consumption per day.
2.3. Study Protocol
At baseline, individuals who identified themselves as healthy self-rated “good sleepers” were invited to participate in the study, giving informed consent and completing the demographic questionnaire. Each participant was provided with an actigraph to be worn for 24-hour/day for seven consecutive days to record the sleep-wake patterns.
2.4. Sleep Statistics and Data Analysis
Figures 1 and 2 (from a participant’s sleep report and reproduced with permission from Fatigue Science [28]) show examples of an actigraphy plot and sleep parameters data from an individual sleep report, which also can be used for consultation purposes. Figure 1 shows the actigraphy 24-hour sleep-wake plot for seven consecutive days in a sleep report. In this model, these data were converted into information about sleep through the use of scientifically-validated algorithms [31,32]. The vertical black lines represent motion or activity. In this plot, the more activities (showed as black lines in Figure 1) recorded during sleep, the lower the quantity and quality of sleep [33].
Sleep statistics, i.e. data on sleep parameters such as mean (average) values for total sleep time (TST) per 24- hour period, number of nocturnal awakenings (NWAK), the percentage of sleep efficiency (SE%), and the median of sleep onset latency (SOL) were summarized in the sleep report to indicate whether or not sleep is within the normal ranges (as in Figure 2) during the study period. The normal ranges for each sleep parameter in the report are determined by the software.
For analysis, data from the sleep report and information from the questionnaire were entered into an SPSS 20.0 [34] data file. Details of the measured sleep parameters (e.g. time spent in bed (minutes), time spent for sleep (minutes) and sleep efficiency (%)) for each day were also automatically downloaded as a Microsoft Office value file and data were entered into SPSS data file for further analysis.
3. RESULTS
All participants agreed that the use of the actigraph was feasible and acceptable by answering “No” to questions “Issue with actigraph: not comfortable?” and “Issue with actigraph: felt awkward?” No disturbance to daily tasks or movement was reported and no one requested to remove the actigraph before the seven-day duration ended. Whilst no specific question was asked regarding the willingness to wear the actigraph for an extended period, all participants agreed that the duration of seven days was acceptable and reasonable. The details of the findings for each participant are summarized in Table 2.
With regards to the mean total sleep time (TST), only seven out of 16 participants (43.8%) achieved a TST
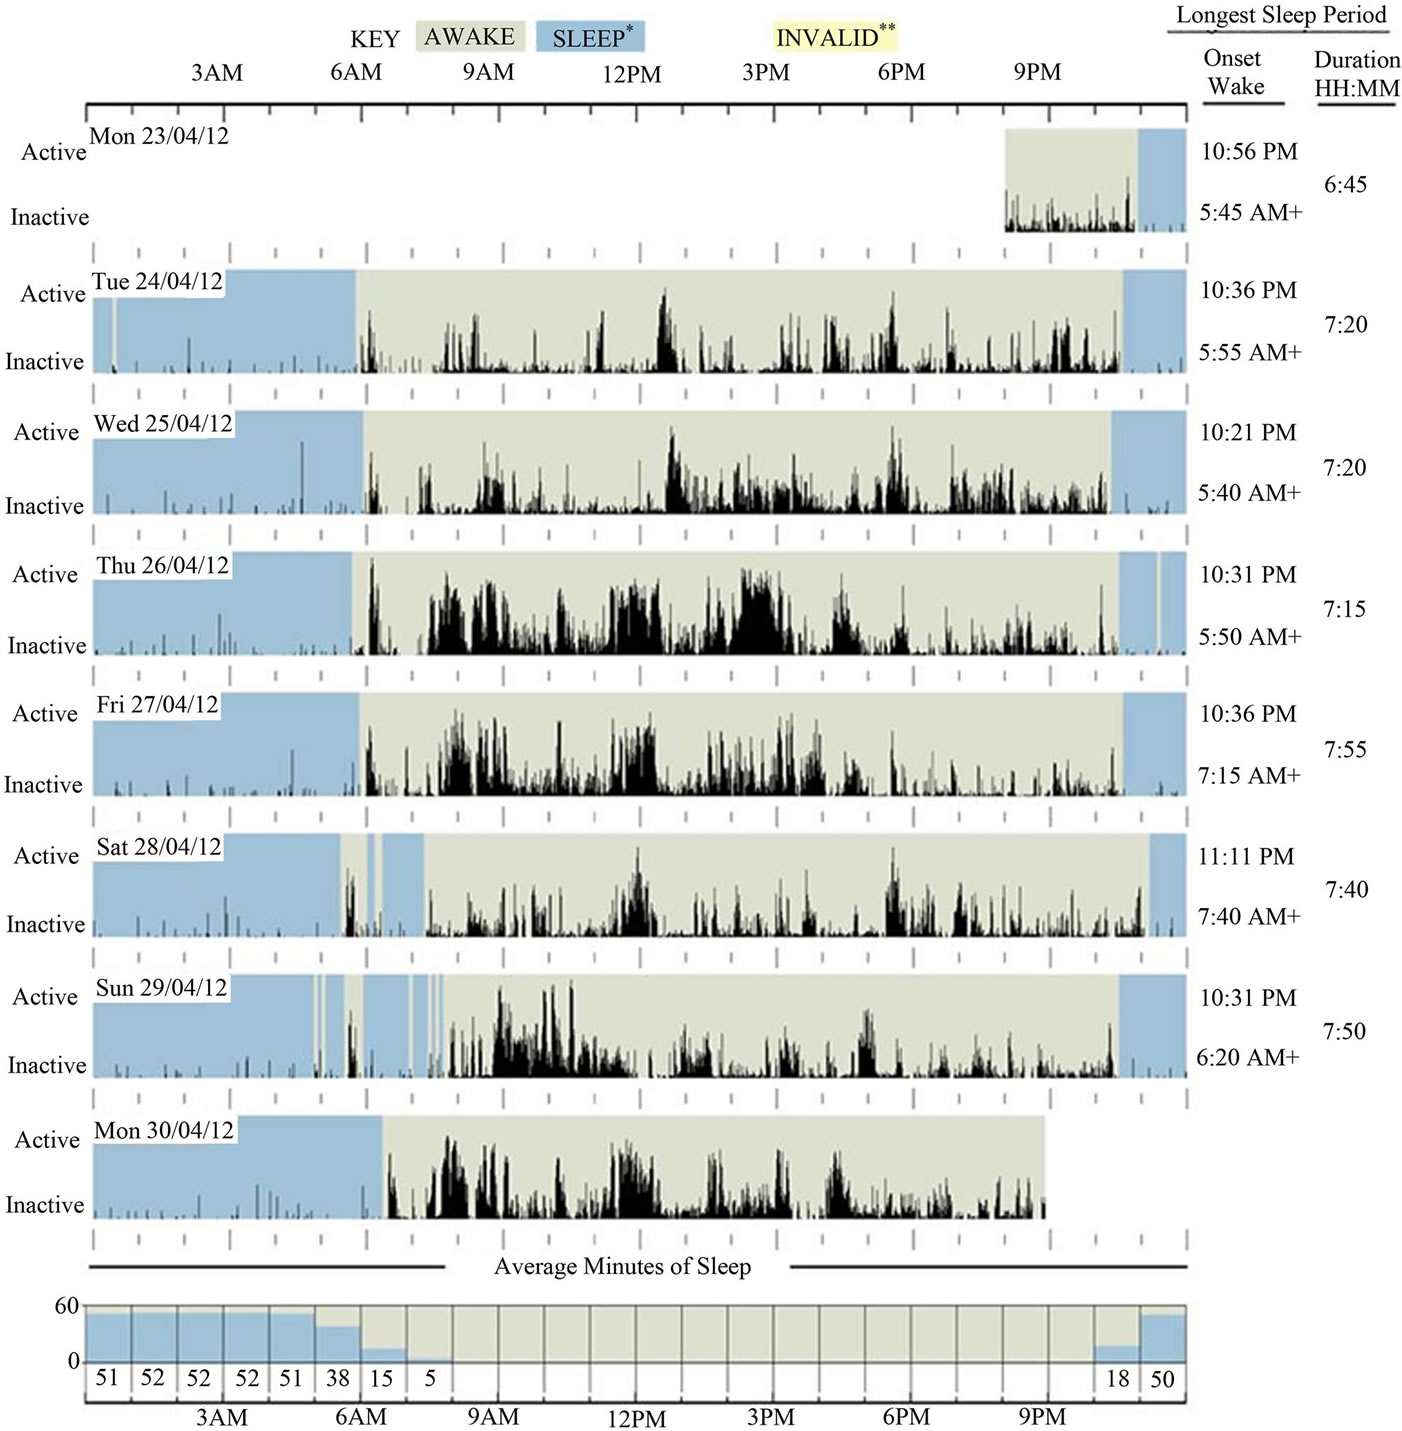
Figure 1. Example of a plot of actigraphy data from an individual sleep report (33). This seven-day recording is a 24-hour sleepwake pattern from a participant and shows a pattern of normal sleep-wake for a healthy adult with no reported sleep disturbance. Sleep onset time, wake after sleep onset (WASO), and duration of sleep (total sleep time per day) can be obtained from this plot.
value within the normal range. By definition, sleep efficiency is the ratio of time actually spent asleep (i.e. TST) to the amount of time spent in bed (time in bed; TIB) including resting [35]. However in this study we could obtain the SE% values directly from the software. Although the software considers SE% values within 80% - 95% to be normal, the literature suggested that SE% values greater than 85% are considered normal [36,37]. In this study, our preference was to adapt normal SE% values based on the literature. Hence, using this definition, 10 participants (62.5%) were found to have mean SE% below the normal range.
Alcohol was consumed only by two participants, however caffeinated drinks, mostly tea and coffee, were consumed by 75% (n = 13) of the participants. Of that, 50% (n = 8) consumed 2 - 3 cups per day of caffeinated drinks.
Table 3 show details of night-by-night TST, SE%,
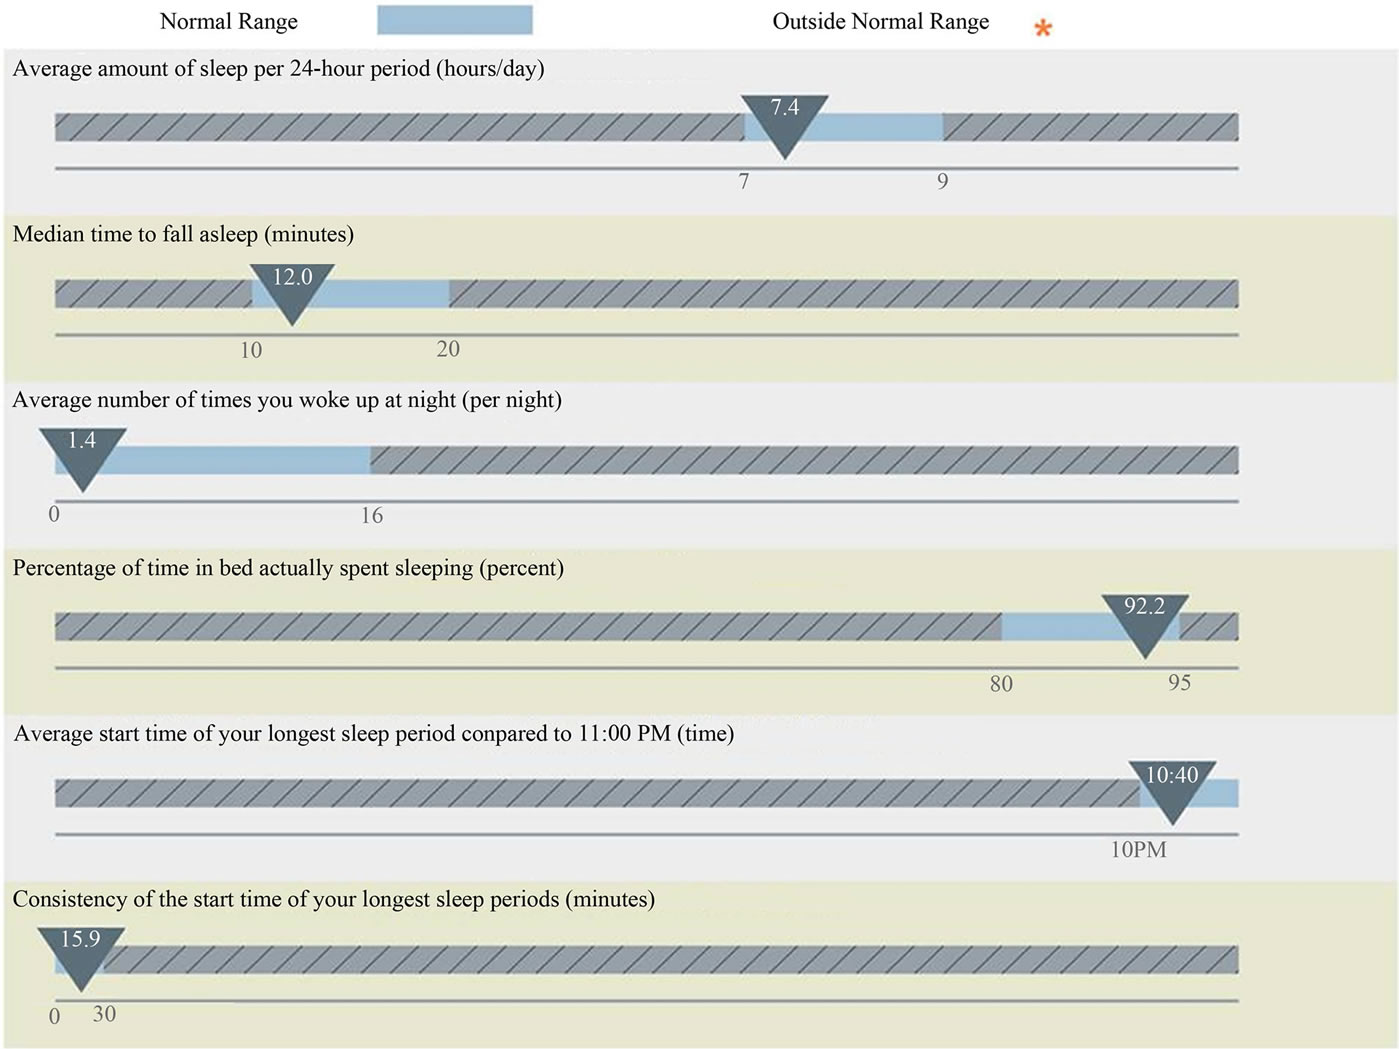
Figure 2. Example of sleep statistics of actigraphy data for a reportedly “good sleeper” from an individual sleep report (33). Results show that each measured sleep parameter is within the normal range. Average amount of sleep per 24-hour period (hours/day) = average of total sleep time (TST) per 24-hour period (hours/day). Median time to fall asleep = median of sleep onset latency (SOL), minutes. Average number of times you woke up at night = number of nocturnal awakenings (NWAK), times. Percentage of time in bed actually spent sleeping = Sleep efficiency in percentage (SE%). Average start time of the longest sleep period = average of sleep onset time.
SOL and TIB (including resting) for two participants (S6 and S7)who displayed results outside the normal ranges for three sleep parameters (TST, SE% and SOL) as in Table 2. There were no patterns in night-by-night SE%, TST and SOL values (Table 3). Both participants demonstrated SE% and SOL values below the normal ranges for the duration of seven days and had the lowest recorded mean value for SE%, i.e. 71.2% and 69.4% respectively in comparison to other participants. In fact, both participants also took the longest time to fall asleep (SOL (mean) = 39 min).
Table 4 shows the Health-Related Quality of Life (HRQOL) outcomes reported by the participants at baseline. Statement four is most related to sleep quality, and findings showed that two participants (S5 and S16) reported “some of the time” and one participant (S13) reported “at no time” for the statement. However, despite the poor quality of sleep among the participants (62.5% of the participants had SE% less than 85%), the selfreported HRQOL scores represented fair and good QOL among the study participants, with only two participants (S13 and S16) having a raw score below 13 (out of 25 scores) which indicates poor wellbeing as in Table 2.
4. DISCUSSIONS
This pilot study used actigraphy to follow the sleepwake patterns for a one week period of healthy adults who had self-rated their sleep as “good”. The purpose was to determine the acceptability and feasibility of the device as a home-based sleep monitoring tool. We found that the actigraphy was well accepted by all participants and was also able to assess the sleep-wake patterns, hence providing insight into the sleep quality in the participants. Sleep quality is an important factor in maintaining good health, and in the long term, poor sleep
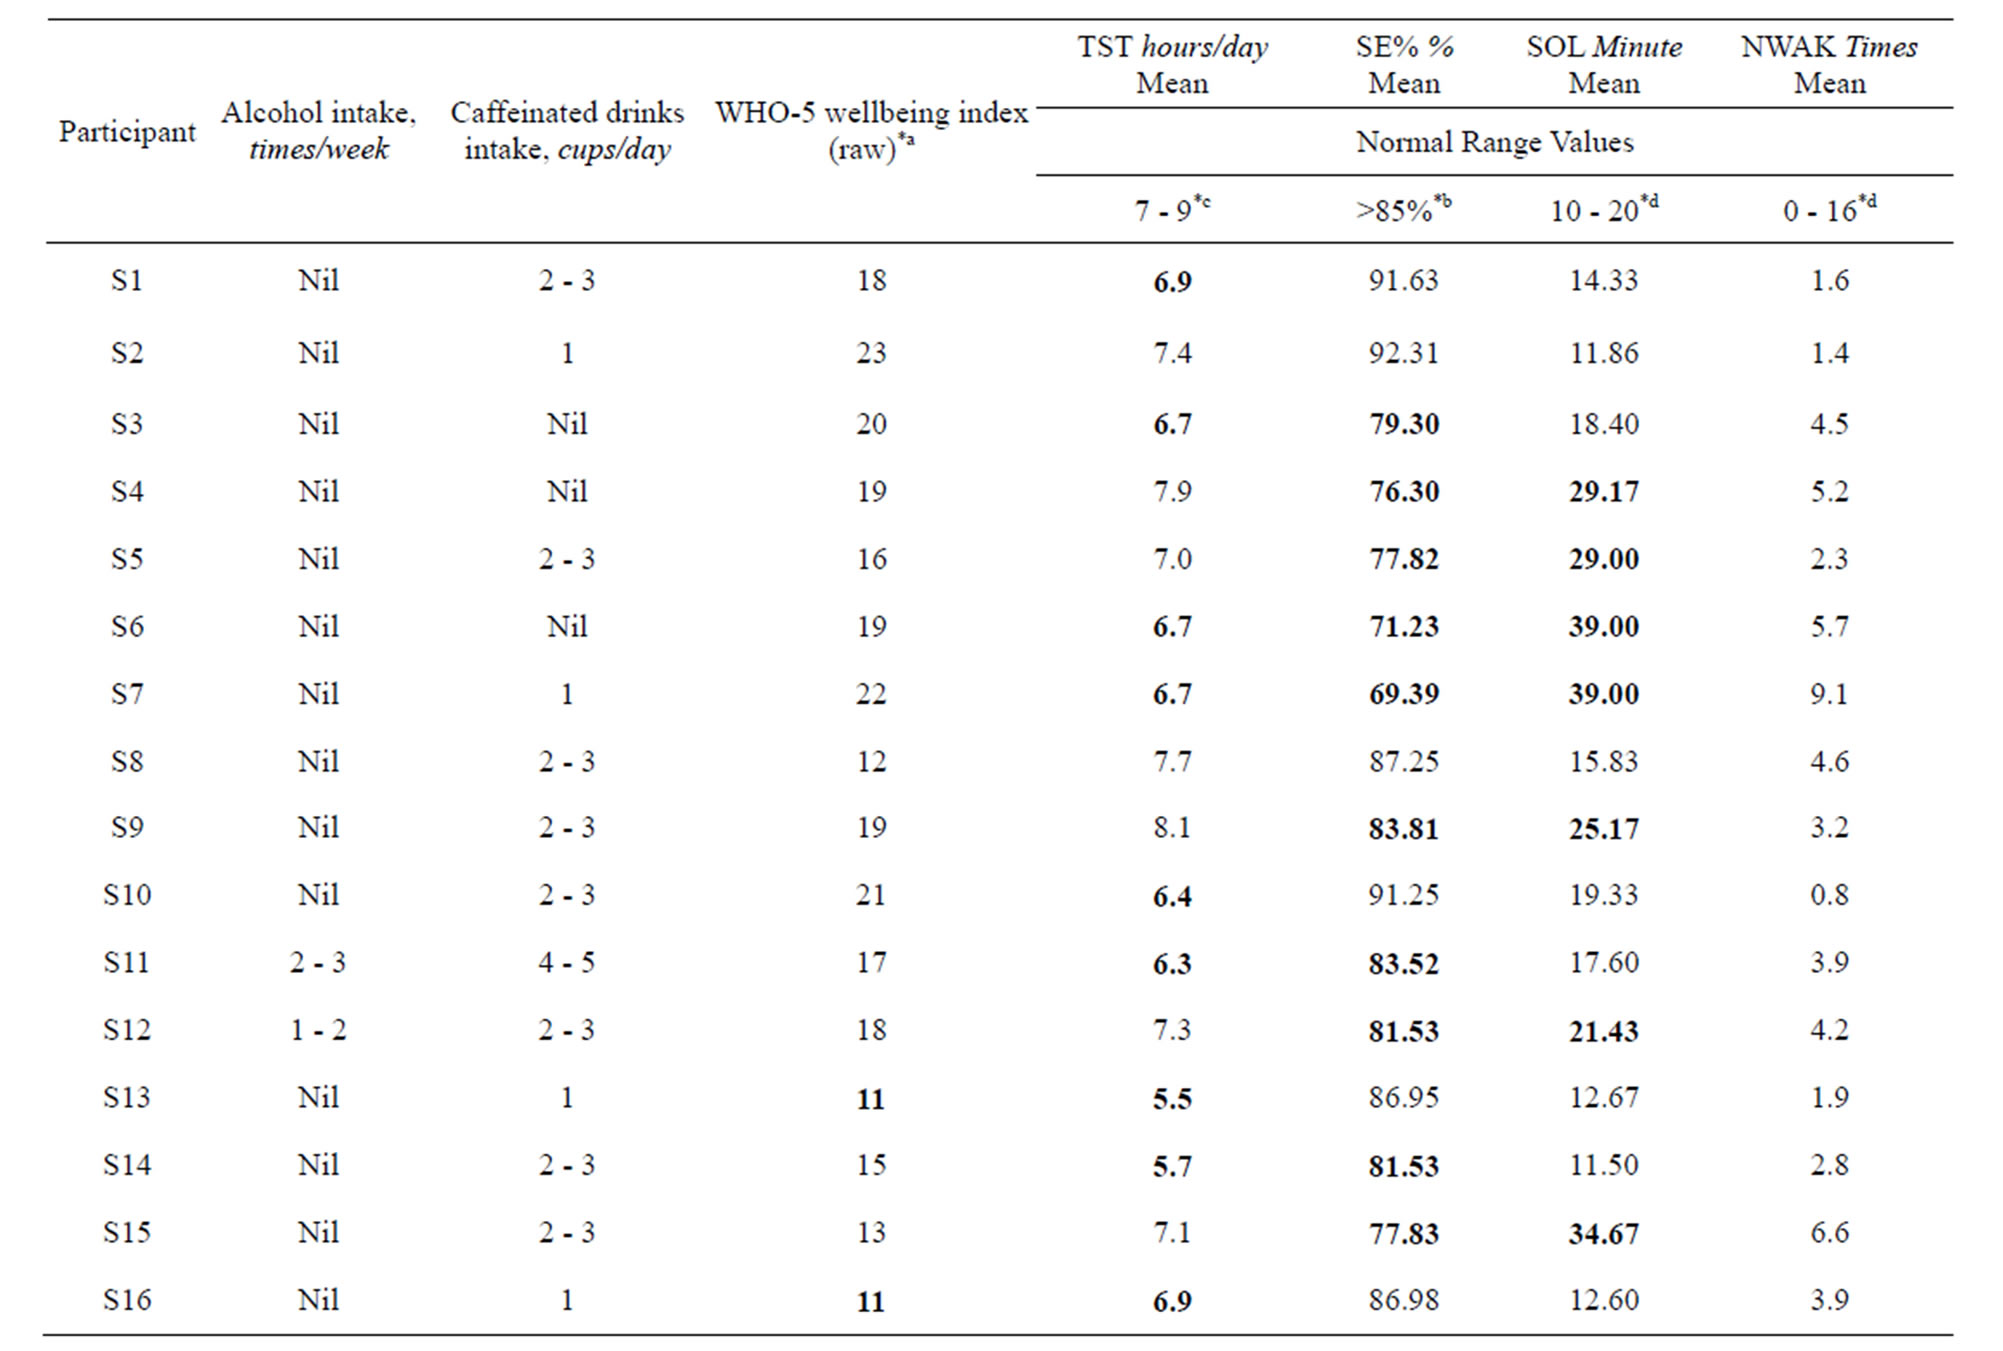
Table 2. A Summary of actigraphy data for the measured sleep parameters, lifestyle and raw score for WHO-5 wellbeing index for each participant.
The bold values indicated the values out of normal ranges. Sleep parameters are based on mean for seven days obtained from the actigraphy sleep report. Smoking status, alcohol intake and caffeinated drinks intake are based on general daily intake. TST, Total Sleep Time per 24-hour period (hours/day) [hours]; SE%, Sleep Efficiency in percentage; SOL, Sleep Onset Latency [minutes]; NWAK, Number of Nocturnal Awakenings [times]. *aRaw score < 13 indicates poor wellbeing, raw score 25 (maximum) representing best possible quality of life [29]. *bNormal range for sleep efficiency is based on literature value [35,36], i.e. >85%. *cNormal range for normal sleep time per day [5,6]. *dNormal ranges for normal SOL and NWAK are based on the software [33].
quality has major impacts on physical and mental well being [38]. Our findings showed, although all participants in the study were self-rated healthy and “good sleepers”, there were cases where low sleep quality were noticed. This indicates that subjective assessment of sleep may not fully capture the underlying issues of poor sleep quality.
We utilized the wrist actigraph to measure objective sleep parameters, particularly total sleep time (TST), sleep onset latency (SOL) and sleep efficiency in percentage (SE%) to assess sleep quality in the participants. SE% is also called the “percentage of time in bed actually sleeping” in the sleep report (Figure 2). It is a way measuring the restorative value of the nightly sleep period and can be relates to SOL. People who fall asleep fast (i.e. shorter SOL) and sleep well throughout the night have highly efficient sleep which tends to be highly restorative sleep. On the contrary, people who take a long time to fall asleep (i.e. longer SOL) and sleep restlessly throughout the night tend to have disrupted, inefficient and non-restorative sleep [33].
Only six participants had mean SE% values greater than 85%, and of all participants, only two participants (S2 and S8) demonstrated results within normal ranges for all measured sleep parameters. The findings also showed that seven participants who took longer time to fall asleep (longer SOL) while in bed also had lower mean SE% (Table 2), suggesting that these two measures may be correlated. This correlation is supported by Augner (2011) who found a high correlation between SOL and subjective sleep quality [36]. However to confirm if this relationship is significant, studies using actigraphy data from larger samples should be conducted.
We chose data from two participants (S6 and S7) for further analysis and discussion as both participants demonstrated results outside normal ranges for three measured parameters (TST, SE% and SOL). Both participants were self-rated good sleepers, nevertheless ac-
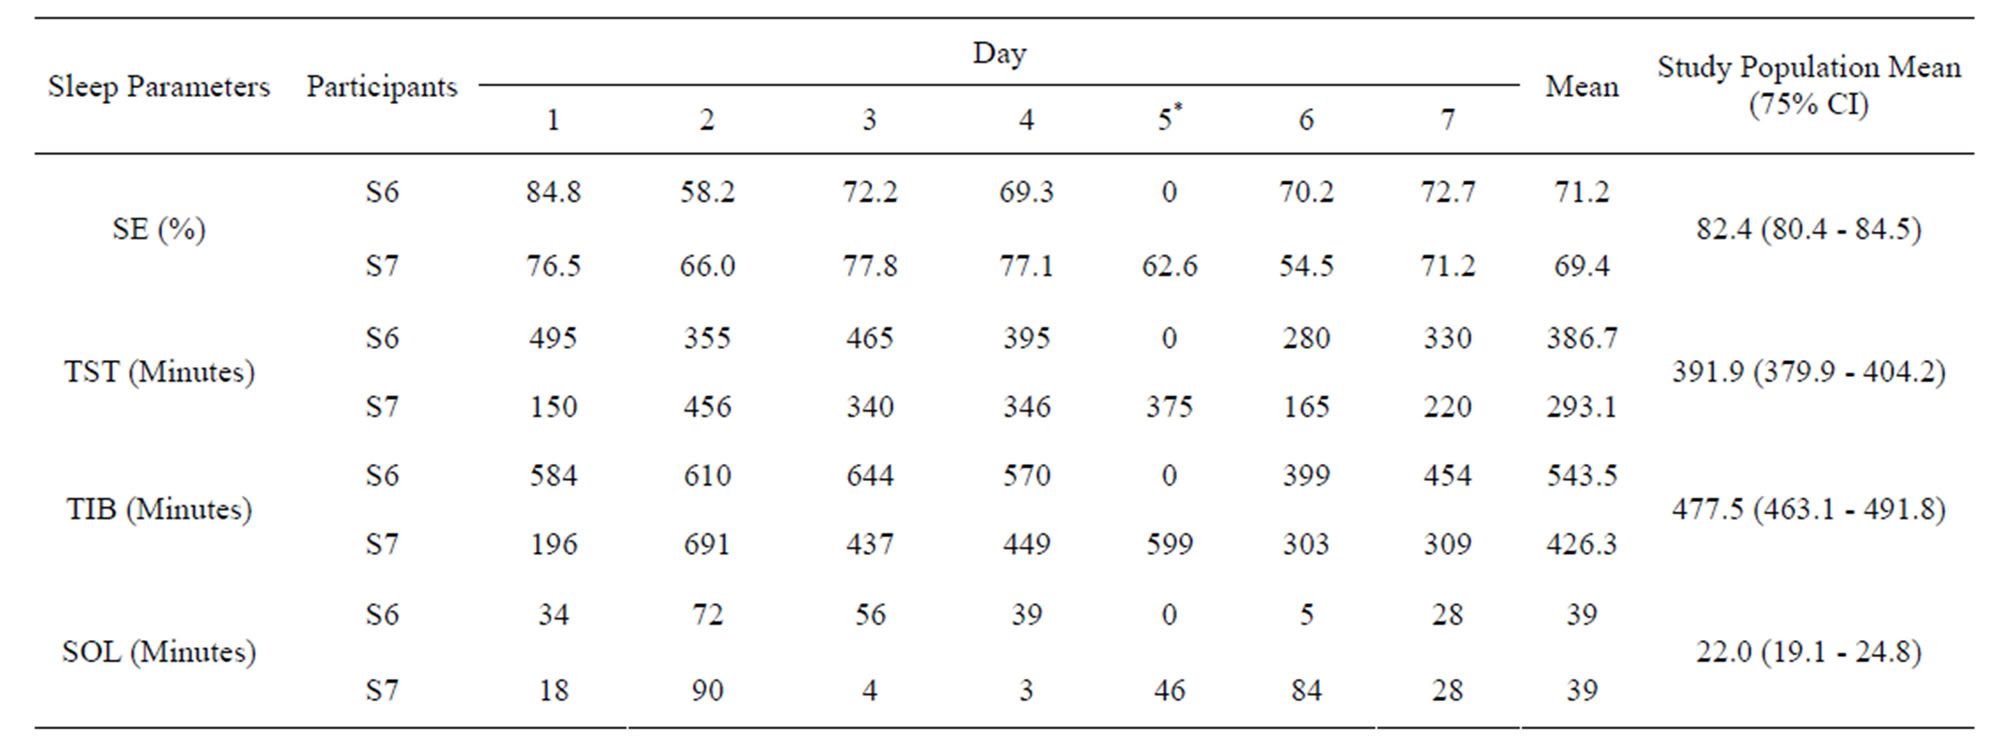
Table 3. Night-by-night total sleep time (TST), sleep efficiency (SE%), sleep onset latency (SOL) and time in bed including resting (TIB) for two participants.
*No TST, SE%, SOL and TIB values were recorded from the actigraph on day 5 for S6. For statistical analysis, data were recorded as missing values.
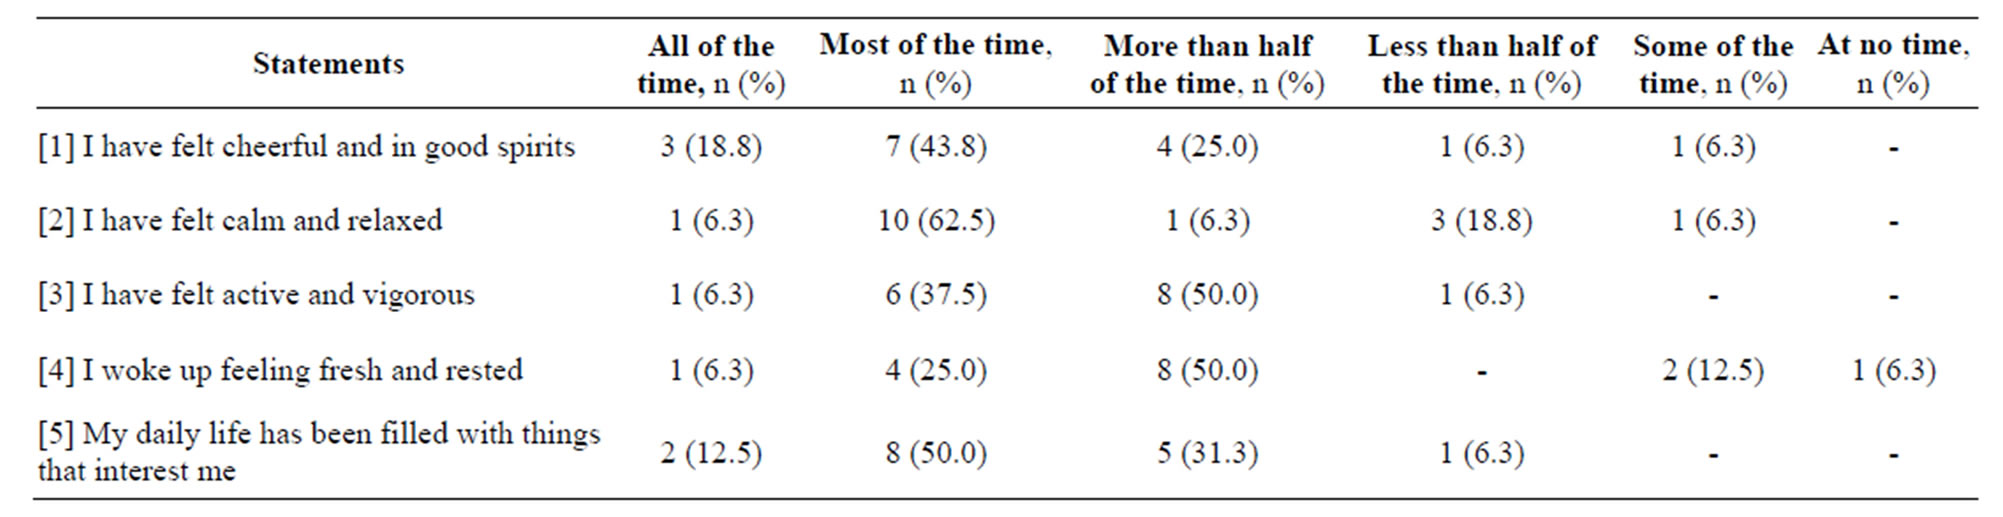
Table 4. Self-reported Health-Related Quality of Life (HRQOL) based on WHO-5 Well Being Index divided by statements.
tigraphy results highlighted potential results to the contrary. Generally, in the community and in primary care, sleep disturbances are very common, however both patients and health professionals often tend to underestimate the importance of sleep and do not discuss sleep problems spontaneously and routinely [39,40]. The use of surveys alone is not always a dependable measure for sleep quality in some patients [41]. Therefore adapting and utilizing actigraphy in a community setting, such as a pharmacy could provide valuable information to improve sleep quality and health outcomes in patients and be a tool for generating discussion around sleep.
For example, if pharmacists were working with participants S6 and S7 data they could provide more reliable recommendations to improve the poor sleep quality before the situation becomes a “chronic” issue, such as in these participants, both have the longest SOL and also showed very low SE% values (Table 2). Pharmacists might in such cases provide a sleep management service and advice in response to requests for sleep medications, including offers of non-pharmacotherapy solutions. This could include monitoring day-by-day sleep-wake patterns for a certain period then provide advices on sleep hygiene, with the aim to improve sleep and decrease the use of sleep medications. Pharmacists can perform a valuable service in community pharmacy with this type of data, simply by being judicious in managing sleep issues. Such a simple accessible service could assist in overcoming many barriers to access to specialist sleep clinics and aid in appropriate referral to medical care.
This study utilized the WHO-5 Well Being Index questionnaire to assess the health-related quality of life (HRQOL) among the study participants. Despite low SE% values among 75% of the participants, the wellbeing index scores did not reflect a corresponding decrease in the quality of life in the participants. Hence measuring HRQOL using this survey tool may not have been specific enough to detect sleep related HRQOL changes in this group of participants.
A small amount of caffeine (<600 mg per day) is often not harmful for an adult, but the quantity often varies, depends on the type of caffeinated drinks consumed [42]. Levy and Zybel-Katz (1983) suggested that the rate of caffeine metabolism is also a determinant factor of individual variation in the effect of drinking coffee on sleep [43]. In fact, previous study suggested that there is an association between the daily intakes of caffeine, sleep problems and daytime sleepiness [43]. Our survey showed 50% of the participants consumed 2 - 3 cups per day and one participant consumed 4 - 5 cups per day of caffeinated beverages. However our findings did not significantly correlate with changes in sleep quality with the consumption of caffeinated drinks among the study participants. Based on literature reports and previous findings [44-46], the consumption of caffeinated drinks may be linked with lower sleep quality, more time awake, shorter sleep duration and delay the onset of sleep.
There are a number of limitations to this study as this was a pilot study. With a small number of participants, there was no comparison with other sleep monitoring tools (e.g. sleep diaries, polysomnography) and without a control group. This limits the broader application of the results; however, the study shows the potential usability and unanimous acceptability of actigraphy for sleep monitoring in the community.
5. CONCLUSIONS
Sleep disturbances are prevalent and yet still under explored [47] in the community. Community pharmacies provide a number of benefits as a setting for primary healthcare activities, including access to a range of individuals in both poor and good health and also those who may not have easy access to other health professionals [48]. The outcomes of this home-based study could be easily translated to the pharmacy setting to expand the role of community pharmacists in managing sleep conditions and the associated symptoms. Through this, pharmacists could make positive contributions in improving the existing sleep health management and subsequent health outcomes for patients in primary care settings.
In conclusion, actigraph is a device which is well accepted and feasible as a home-based monitoring tool to identify undiagnosed poor sleep in healthy self-rated good sleepers. It is a potential device to be used in monitoring patients with sleep disturbances in the community. Future population-based research should be conducted using larger samples to adapt this intervention, potentially into the pharmacy setting and workflow, in order to improve sleep health management in the community. Studies also may include patients’ and community pharmacists’ opinion about the feasibility and cost of such service.
6. ACKNOWLEDGEMENTS
This study was part of a PhD degree research conducted at the University of Queensland, Australia. The author wishes to thank the School of Pharmacy University of Queensland for providing facilities and funding the resources for the study, and also International Islamic University Malaysia (IIUM) and Ministry of Higher Education (MOHE) Malaysia for the sponsorship of PhD study.
REFERENCES
- National Sleep Foundation (2011) Diet, exercise and sleep. http://www.sleepfoundation.org/article/sleep-topics/diet-exercise-and-sleep
- Institute of Medicine (2006) Sleep disorders and sleep deprivation: An unmet public health problem. The National Academies Press, Washington DC.
- Deloitte Access Economics (2010) Re-awakening Australia: The economic cost of sleep disorders in Australia. http://www.deloitte.com/assets/Dcom-Australia/Local%20Assets/Documents/Industries/LSHC/Deloitte_Reawakening_Australia_Oct2011.pdf
- Strine, T.W. and Chapman, D.P. (2005) Associations of frequent sleep insufficiency with health-related quality of life and health behaviors. Sleep Medicine, 6, 23-27. doi:10.1016/j.sleep.2004.06.003
- National Sleep Foundation (2011) Fatigue and excessive sleepiness. http://www.sleepfoundation.org/article/sleep-related-problems/excessive-sleepiness-and-sleep
- American Psychological Association (2012) Why sleep is important and what happens when you don’t get enough. http://www.apa.org/topics/sleep/why.aspx
- Heath, A.C., Eaves, L.J., Kirk, K.M. and Martin, N.G. (1998) Effects of lifestyle, personality, symptoms of anxiety and depression, and genetic predisposition on subjective sleep disturbance and sleep pattern. Twins Research, 1, 176-188.
- Stein, M.D. and Friedman, P.D. (2006) Disturbed sleep and its relationship to alcohol use. Substance Abuse, 26, 1-13. doi:10.1300/J465v26n01_01
- Shilo, L., Sabbah, H., Hadari, R., Kovatz, S., Weinberg, U., Dolev, S., Dagan, Y. and Shenkman L. (2002) The effects of coffee consumption on sleep and melatonin secretion. Sleep Medicine, 3, 271-273. doi:10.1016/S1389-9457(02)00015-1
- Hersberger, K.E., Renggli, V.P., Nirkko, A.C., Mathis, J., Schwegler, K. and Bloch, K.E. (2006) Screening for sleep disorders in community pharmacies—Evaluation of a campaign in Switzerland. Journal of Clinical Pharmacy and Therapeutics, 31, 35-41. doi:10.1111/j.1365-2710.2006.00698.x
- Kashyap, K.C., Nissen, L.M., Smith, S.S., Douglas, J.A. and Kyle G.J. (2012) Can community pharmacy sleep assessment tool aid the identification of patients at risk of sleep disorders in the community: A pilot study. Integrated Pharmacy Research and Practice, 1, 3-12. doi:10.2147/IPRP.S36328
- Standards of Practice Committee of the American Academy of Sleep Medicine (2003) Practice parameters for the role of actigraphy in the study of sleep and circadian rhythms: An update for 2002. Sleep, 26, 337-341.
- Kushida, C.A., Littner, M.R., Morgenthaler, T., et al. (2005) Practice parameters for the indications for polysomnography and related procedures: An update for 2005. Sleep, 28, 499-521.
- Natale, V., Drejak, M., Erbacci, A., Tonetti, L., Fabbri, M. and Martoni, M. (2012) Monitoring sleep with a smartphone acceloremeter. Sleep and Biological Rhythms, 10, 287-292. doi:10.1111/j.1479-8425.2012.00575.x
- Lockley, S.W., Skene, D.J. and Arendt, J. (1999) Comparison between subjective and actigraphic measurement of sleep and sleep rhythms. Journal of Sleep Research, 8, 175-183. doi:10.1046/j.1365-2869.1999.00155.x
- Chesson, A.L., Ferber, R.A., Fry, J.M., et al. (1997) Practice parameters for the indications for polysomnography and related procedures. Sleep, 20, 406-422.
- Penzel, T., Kesper, K., Pinnow, I., Heinrich, F.B. and Vogelmeier, C. (2004) Peripheral arterial tonometry, oximetry and actigraphy for ambulatory recording of sleep apnea. Physiological Measurement, 25, 1025. doi:10.1088/0967-3334/25/4/019
- Van De Water, A.T.M., Holmes, A. and Hurley, D.A. (2011) Objective measurements of sleep for non-laboratory settings as alternatives to polysomnography—A systematic review. Journal of Sleep Research, 20, 183-200. doi:10.1111/j.1365-2869.2009.00814.x
- Standards of Practice Committee of the American Academy of Sleep Medicine (2007) Practice parameters for the use of actigraphy in the assessment of sleep and sleep disorders: An update for 2007. Sleep, 30, 519-529.
- American Academy of Sleep Medicine (2005) International classification of sleep disorders: Diagnostic and coding manual. American Academy of Medicine, Westchester.
- Curie, S.R., Malhotra, S. and Clark, S. (2004) Agreement among subjective, objective, and collateral measures of insomnia in post withdrawal recovering alcoholics. Behavioral Sleep Medicine, 2, 148-161. doi:10.1207/s15402010bsm0203_4
- Edinger, J.D., Means, M.K., Stechuchak, K.M. and Olsen MK. (2004) A pilot study of inexpensive sleep-assessment devices. Behavioral Sleep Medicine, 2, 41-49. doi:10.1207/s15402010bsm0201_4
- Katzenberg, D., Young, T., Finn, L., Lin, L., King, D.P., Takahashi, J.S. and Mignot, E. (1998) A clock polymorphism associated with human diurnal preference. Sleep, 21, 569-576.
- Blackwell, T., Redline, S., Ancoli-Israel, S., Schneider, J.L., Surovec, S., Johnson, N.L., Cauley, J.A. and Stone, K.L. (2008) Comparison of sleep parameters from actigraphy and polysomnography in older women: The SOF study. Sleep, 31, 283-291.
- Deak, M. (2009) Use of actigraphy in neurological patient population. Neuroscience Bulletin, 1, 17-23.
- Lichstein, K.L., Stone, K.C., Donaldson, J., Nau, S.D., Soeffing, J.P., Murray, D.W., Lester, K. and Aguillard, R.N. (2006) Actigraphy validation with insomnia. Sleep, 29, 232-239.
- Vallieres, A. and Morin, C.M. (2003) Actigraphy in the assessment of insomnia. Sleep, 26, 902-906.
- Fatigue Science (n.d.) Readiband. http://www.fatiguescience.com/products/readiband
- WHO-5 Well Being Index (1995) http://www.who-5.org/
- Saini, B., Wong, K.K., Krass, I. and Grunstein, R. (2009) The role of pharmacists in sleep health—A screening, awareness and monitoring program: Final report. University of Sydney, Sydney.
- Hursh, S.R., Redmond, D.P., Johnson, M.L., Thorne, D.R., Belenly, G., Balkin, T.J., Miller, J.C., Eddy, D.R. and Storm, W.F. (2004) The DOD sleep, activity, fatigue, and task effectiveness model. Aviation Space and Environmental Medicine, 75, A44-A53.
- Hursh, S.R., Raslear, T.G., Kaye, A.S. and Fanzone, J.F. (2006) Validation and calibration of a fatigue assessment tool for railroad work schedules, summary report. US Department of Transportation, Washington DC.
- Fatigue Science Inc. (2012) Individual sleep and effectiveness analysis: Sleep report.
- IBM SPSS Statistics 20 Documentation (n.d.) http://www-01.ibm.com/support/docview.wss?uid=swg27021213#en
- Peters, B. (2009) Sleep efficiency. http://sleepdisorders.about.com/od/glossary/g/SleepEfficiency.htm
- O’Donoghue, G.M., Fox, N., Heneghan, C. and Hurley, D.A. (2009) Objective and subjective assessment in chronic low back pain patients compared with healthy age and gender matched controls: A pilot study. BMC Musculoskeletal Disorders, 10, 122. doi:10.1186/1471-2474-10-122
- American Sleep Apnea Association. (2013) Sleep study report. http://sleepapneafaq.wikispaces.com/Sleep+Study+report
- Augner, C. (2011) Association of subjective sleep quality with depression score, anxiety, physical symptoms and sleep onset latency in students. Central European Journal of Public Health, 19, 115-117.
- Shochat, T., Umphress, J., Israel, A.G. and Ancoli-Israel, S. (1999) Insomnia in primary care patients. Sleep, 22, S359-S365
- Hohagen, F., Rink, K., Kappler, C., Schramm, E., Riemann, D., Weyerer, S. and Berger, M. (1993) Prevalence and treatment of insomnia in general practice. A longitudinal study. European Archives of Psychiatry and Clinical Neuroscience, 242, 329-336. doi:10.1007/BF02190245
- Girschik, J., Fritschi, L., Heyworth, J. and Waters, F. (2012) Validation of self-reported sleep against actigraphy. Journal of Epidemiology, 22, 462-468. doi:10.2188/jea.JE20120012
- NSW Government (2007) Health. http://www0.health.nsw.gov.au/factsheets/drugandalcohol/caffeine.html
- Levy, M. and Zylber-Katz, E. (1983) Caffeine metabolism and coffee-attributed sleep disturbances. Clinical Pharmacology & Therapeutics, 33, 770-775. doi:10.1038/clpt.1983.105
- Mindell, J.A., Meltzer, L.J., Carskadon, M.A. and Chervin, R.D. (2009) Developmental aspects of sleep hygiene: Findings from the 2004 National Sleep Foundation Sleep in America Poll. Sleep Medicine, 10, 771-779. doi:10.1016/j.sleep.2008.07.016
- Paterson, L.M., Wilson, S.J., Nutt, D.J., Hutson, P.H. and Ivarsson, M. (2009) Characterisation of the effects of caffeine on sleep in the rat: A potential model of sleep disruption. Journal of Psychopharmacology, 23, 475-486. doi:10.1177/0269881109104846
- Pollack, C.P. and Bright, D. (2003) Caffeine consumption and weekly sleep patterns in US seventh-, eighth-, and ninth-graders. Paediatrics, 111, 42-46. doi:10.1542/peds.111.1.42
- Kruger, P.M. and Friedman, E.M. (2009) Sleep duration in the United States: A cross-sectional population-based study. American Journal of Epidemiology, 169, 1052- 1063. doi:10.1093/aje/kwp023
- Jackson, S. and Peterson, G. (2006) Health screening in community pharmacy: An update. Pharmacist, 25, 846- 851.
NOTES
*Competing Interest: The authors declare that they have no competing interests.