Materials Sciences and Applications
Vol.4 No.12(2013), Article ID:41135,9 pages DOI:10.4236/msa.2013.412105
Experimental Study of the Drying Kinetics of the Coconut Shells (Nucifera) of Cameroon
![]()
1IUT FV de Bandjoun, University of Dschang, Dschang, Cameroon; 2ENSET, University of Douala, Douala, Cameroon; 3Chemestry School, University of Haute Alsace, Mulhouse, France; 4ENSISA, University of Haute Alsace, Mulhouse, France; 5Faculty of Science, University of Buea, Buea, Cameroon.
Email: *ndapeu@yahoo.fr
Copyright © 2013 Dieunedort Ndapeu et al. This is an open access article distributed under the Creative Commons Attribution License, which permits unrestricted use, distribution, and reproduction in any medium, provided the original work is properly cited.
Received October 23, 2013; revised November 26, 2013; accepted December 9, 2013
Keywords: Coconut Shells; Drying Model; Drying Kinetics; Effective Diffusivity; Activation Energy
ABSTRACT
Water diffusion of two species of coconut shells (CS) nucifera from Cameroon, in the case of drying, was experimentally studied. The experiment was done with the aid of an oven, by the method of gravimetric batch control of the mass of the test samples with the temperatures varied from 70˚ to 180˚ Celsius. The shells of mature coconuts from two species were conserved in the laboratory at a temperature ranging between 20˚ and 23˚ Celsius for two months before being mechanically cleaned. This study allows not only the determination of the water content of the shells, but also the identification of the drying model. It is thus from the ten model tests, and the statistical analysis shows that the Midilli model best predicted this drying phenomenon. The coefficient of effective diffusion was determined at different temperatures which permitted the evaluation of the activation energy per the Arrhenius equation.
1. Introduction
Coconuts are a harvest largely cultivated in many regions of the planet to the point where coconut tree is considered in certain countries as the tree of life. The worldwide production is estimated at more than 54 million tons. Even though Cameroon is not amongst the top ten worldwide producers, it is not far away that coconut is a part of the daily food habits of these populations. This product is consumed in many forms: coconut milk, coconut flour, coconut juice, and dried coconut almonds. Although the by-products of the coconuts tree are for the most part thrown away into our environment, thus causing pollution, the populations look non-stop for ways to use them. It is thus the fibers of the trunk and the CS that are exploited in the elaboration of composites [1]; the CS is used in the elaboration of active carbon [2], in decoration, in kitchen utensils and in art objects. Outside of this, a non-negligible quantity of the CS is thrown away into our immediate environment. In order to optimize the potential that represents these plants for the worldwide population, along with protecting our environment, some works are oriented on the utilization of those shells. CSs are used as charge in the composites [3] and also in concrete [4]. Other works are based on the utilization of the CS as a stabilizing agent of cheap lateritic soil [5]. Recent studies have determined certain mechanical and physiochemical characteristics of the CS [6]. The utilization of CS in composites implies the phenomena of water diffusion which are currently unknown. The study of the model of drying kinetics of coconut almond has already been done for the food need [7].
In the present work, the attention is brought to the experimental study of the model of the drying kinetics of the CS (nucifera) at different temperatures including the estimate of the water content of CS. All the abbreviations of the quantities used in this text are given in Table 1.
2. Materials and Procedure
2.1. Materials
The coconuts used in this study come from the southern, littoral, and southwestern regions of Cameroon. Two
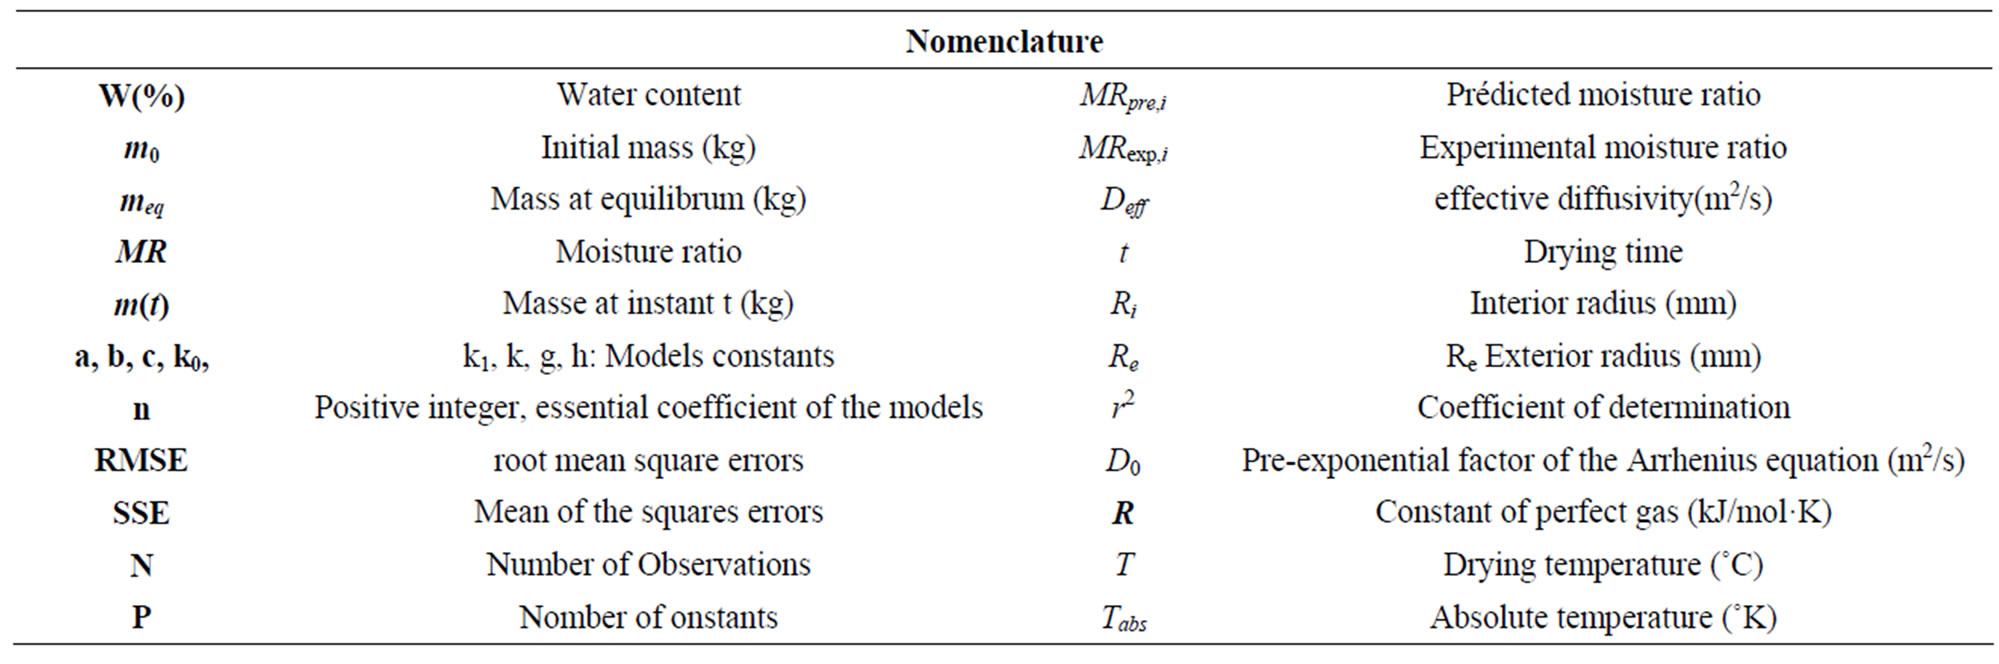
Table 1. Nomenclature of quantities.
varieties of coconut are concerned and they are distinguished by the form of their nut: one has an oblong form (species 1) and another has a round form (species 2). CS were separated from nuts and remained at the laboratory in approximate ambient moisture of 60% and at a temperature varying between 20˚ and 23˚C, for two months. They were cut and cleaned to eliminate the fibers and white matter that covered the inside of the shell. The cutting and the cleaning were done manually with the help of a workbench vise, a manual saw, and sandpaper. The test samples intended for the tests have geometry comparable to a portion of sphere as shown in Figure 1; they were cut in the southernmost direction of nut. For each of the test samples, we estimated the interior radius, marked Ri, and the exterior radius, marked Re by the geometric traces. For each isothermal and for each species, 8 samples were tested for a total of 80 test samples.
2.2. Procedure
The undertaken experiments made it possible to determine the water content and the kinetics of drying of these CS using the method by stoving following the prescription of standard NF P 94-050. A drying oven of mark memmert model UN 160 with a precision of 5˚C was used to maintain samples to the following isotherms: 70˚C; 100˚C; 130˚C; 160˚C and 180˚C. A numerical balance of 0.01 g of precision was used to measure the masses. For each trial at each of the temperatures above, the oven was regulated until the desired isotherm was reached before the test samples were introduced. The test samples were weighed to determine their humid mass m0 before being placed in the oven. The hour at which the samples were introduced into the oven was noted, and after a determined duration in the oven, the test sample is taken out and weighed in a lapse of time in order to minimize the incertitude of measure: the humid mass of the sample  was noted after duration of “t” in the oven. The experiment was repeated until the mass of the
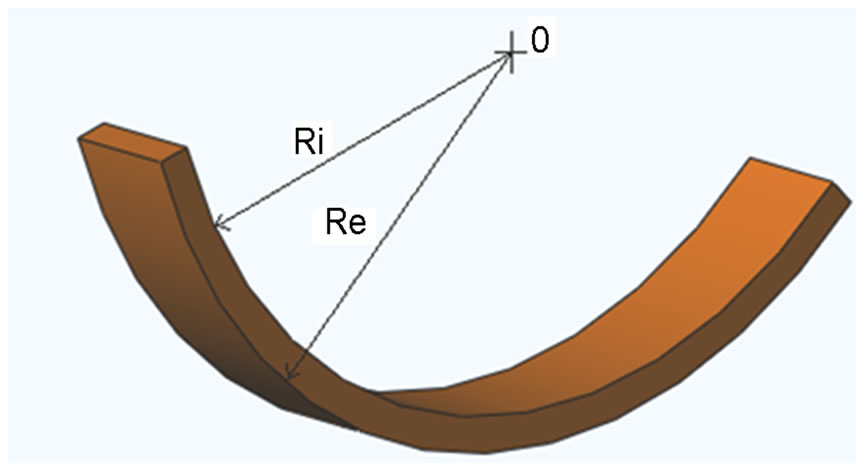
Figure 1. The geometry of the samples.
test sample no longer varied: the equilibrium mass meq of the sample was recorded.
2.3. Theoretic Considerations
2.3.1. Mathematical Model of the Phenomenon of Diffusion
The water content W compared to the dry matter of the test samples is calculated from the humid mass m0 and the equilibrium mass meq in the following formula (1). The moisture ratio (MR) which is the dimensionless equivalent of humidity can be calculated following the formula (2).
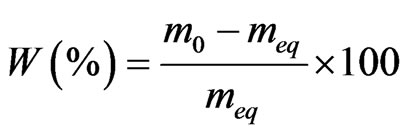 (1)
(1)
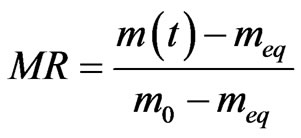 (2)
(2)
where  represents the humid mass at the instant (t). Table 2 below presents the mathematical models characteristic of the drying kinetics of plant products used to test those of the CS.
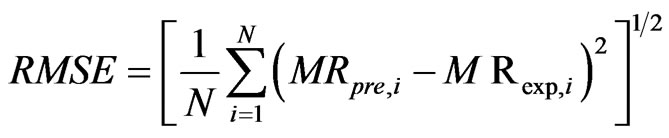
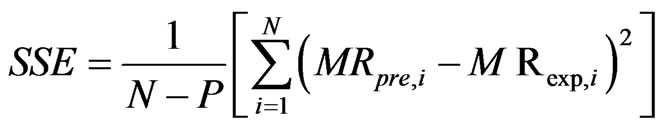
The program Matlab (2009) was used to identify the parameters of the different models from a non-linear regression. The effectiveness of a model was evaluated via statistical criteria such as coefficient of determination r2, square root of error (SSE), root mean square error
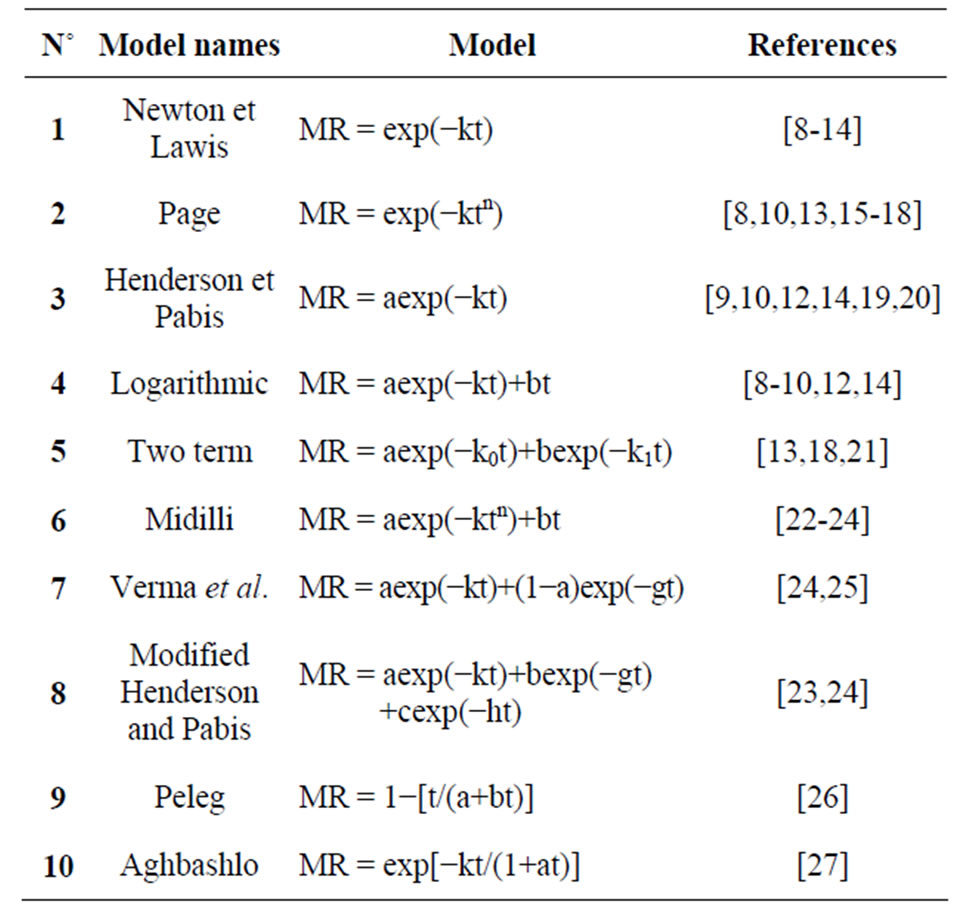
Table 2. Mathematical models used in the drying kinetics of the CSs.
(RMSE. In fact, a model is better if the higher r2 is close to 1 and the lowest value of and with RMSE and SSE. Equations (3) and (4) give the expressions of those parameters.
 (3)
(3)
 (4)
(4)
where MRpre,i and MRexp,i are the moisture ratios of the predicted and experimental respectively for the ith observation. N is the number of observations and P is the number of constants.
2.3.2. Estimation of the Effective Diffusivity
Fick’s Equation (5) determines the diffusion of mass across the plant products [28]. In recognizing that the coefficient of effective diffusivity depends neither on the concentration, nor the position, it yields:
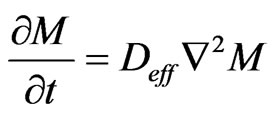 (5)
(5)
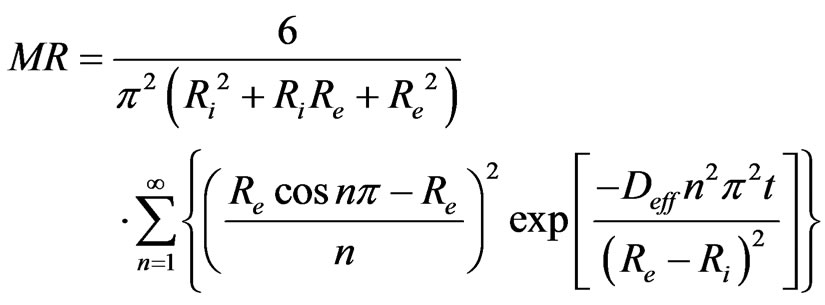
where Deff is the coefficient of effective diffusisity and M is the levels of humidity. The analytical solution to Equation (5), for a radial diffusion in a hollow sphere ( ) was developed by Carslaw and Jaeger in 1959 [28]. The solution of Carslaw and Jaeger (6) applies in cases where the internal surface at r = Ri and at the external r = Re are maintained at concentrations C1 and C2 respectively so that C1 = C2. This way, the coefficient of effective diffusivity is constant.
 (6)
(6)
where Deff is the coefficient of effective diffusivity (m2/s) and “n” is positive integer. In limiting to the first term of this series, the Equation (7) becomes
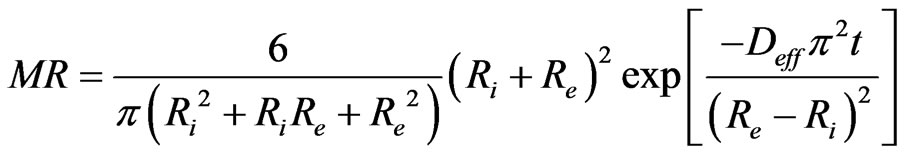 (7)
(7)
The natural logarithm of Equation (7) gives Equation (8) which permits to determine experimentally the coefficient of effective diffusivity Deff.
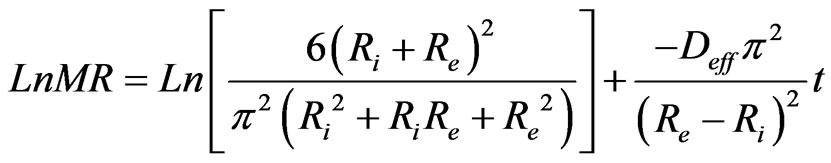 (8)
(8)
The slope of the linear regression of Ln(MR) in function of time (t) permit to calculate Deff in the following Equation (9).
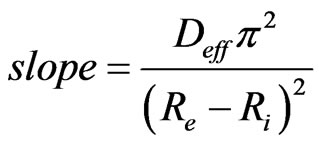 (9)
(9)
2.3.3. Computation of the Activation Energy
The activation energy is necessary for the activation of the phenomenon of diffusion studied. It is calculated from the Arrhenius equation [29] which results from the dependence of the coefficient of effective diffusivity to the absolute temperature (10). The natural logarithm of the Equation (10) gives the Equation (11) which allows the determination of the activation energy Ea using the slope of the line Ln(Deff) in function of (1/Tabs).
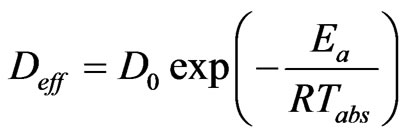 (10)
(10)
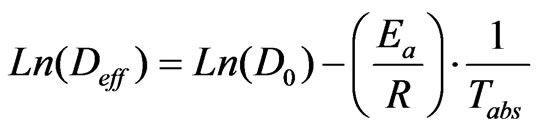 (11)
(11)
In Equation (11), D0 (m2/s) is the pre-exponential factor of the Arrhenius equation; Ea is the activation energy (kJ/mol); R is the constant of perfect gas (kJ/molK).
3. Results and Discussion
3.1. Water Content
The humid mass m0 and the equilibrium mass meq allowed the calculation of the water content of each of the samples tested using Equation (1). The Table 3 shows the median values and the standard deviations obtained from 20 samples tested per species.
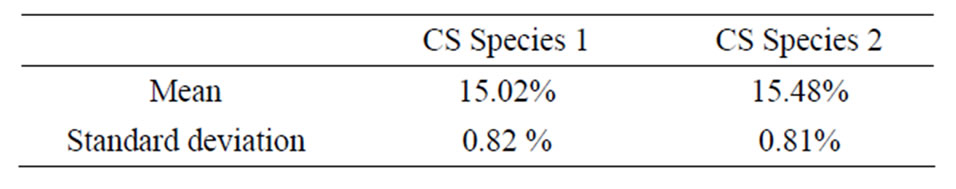
Table 3. Values in water content of the CS.
3.2. Analysis of the Drying Kinetics
With an initial moisture content of 15.5 ± 2% (d.b), test samples was dried in the oven to a final moisture content of around 1% d.b. at drying temperature 70˚C; 100˚C; 130˚C; 160˚C; 180˚C. Figure 2 shows the evolution of the moisture ratio (MR) in function of time, for different temperatures and for the two species of CS and the durations of drying are those necessary to reach a water content estimated at 1%.
It is noted that the drying kinetics of the two species of CS is not very different. It clearly appears that the drying temperature has an influence on the drying kinetics. The Figure 3 shows the duration of drying as a function of the temperature. It is clear that between 70˚C and 130˚C, the duration of drying decreases rapidly, while between 130˚C and 180˚C this decreasing is slow. The fall of duration of drying which one observes around 100˚C is certainly due to a water departure by vaporization coupled with the destruction of the hydrogen bond between the shell and the molecules of water. Similarly T. Madhiyanon et al. (2009) [7], by studying the models of fluidized bed drying for thin-layer chopped coconut, they observed that the rate of moisture reduction was greater at a higher temperature, in response to influence of drying temperature on the ability to diffuse moisture.
The evolution of the moisture ratio (MR) obtained experimentally from the two species at different temperatures was tested by 10 mathematical models presented in Table 1; in the goal of identify the model that best predicted the drying kinetics. The statistical criteria r2; RMSE and SSE were used to evaluate these models. It is clear that the Midilli, Logarithmic, and Modified Henderson models are more distinguished than the others and for the samples tested and at all the temperatures, with and  and very weak values of RSME and SSE inferior. More particular, the Midilli model with and
 ; RMSE and SSE inferior to 10−2, proves to be the best model for the prediction of the drying kinetics of the CS. As per the illustration, Table 4 presents the values of these criteria for specie 2 at 100˚C. Figure 4 shows a good concordance of the experimental results with this model.
To have a complete model, an interest in the variation of the parameters of the Midilli model in function of temperature must be taken. Figure 5 presents the given experimental of the Midilli parameters in function of temperature. It is evident that only the parameter “n” is susceptible to the temperature and its evolution seems to be linear as shown in Figure 6.
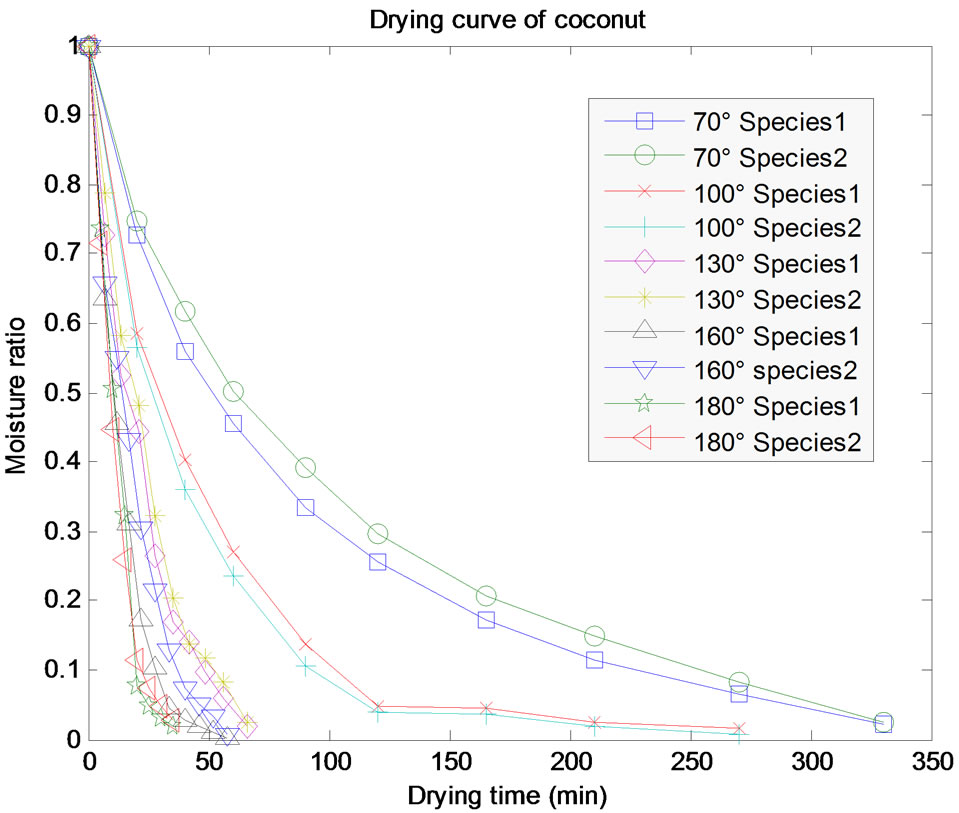
Figure 2. Experimental curves of the drying kinetics of the CS of species 1 and 2 at different temperatures.
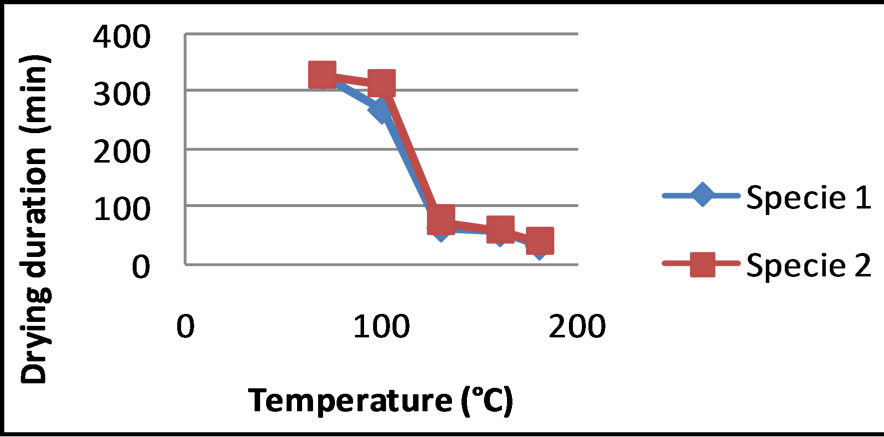
Figure 3. Influence of the temperature on the drying kinetics of the CSs.
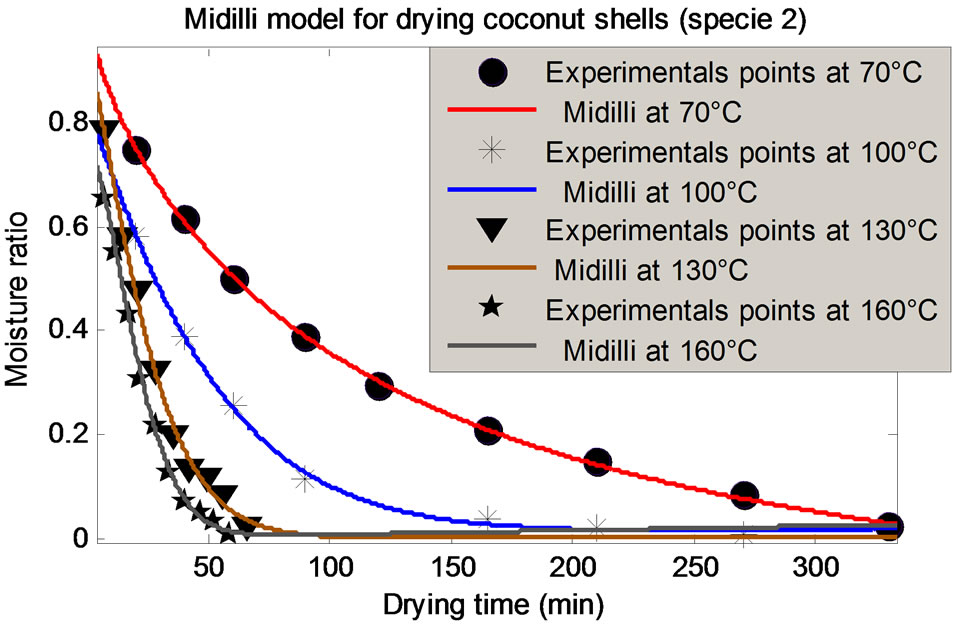
Figure 4. Modeling of the given experimental of species 1 and 2 per Midilli.
A complete expression of the modeling of the drying kinetics of the CS, in accounting for the dependence of the parameter “n” to the temperature, can be given by the Equation (12).
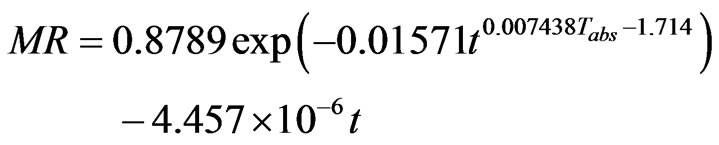 (12)
(12)
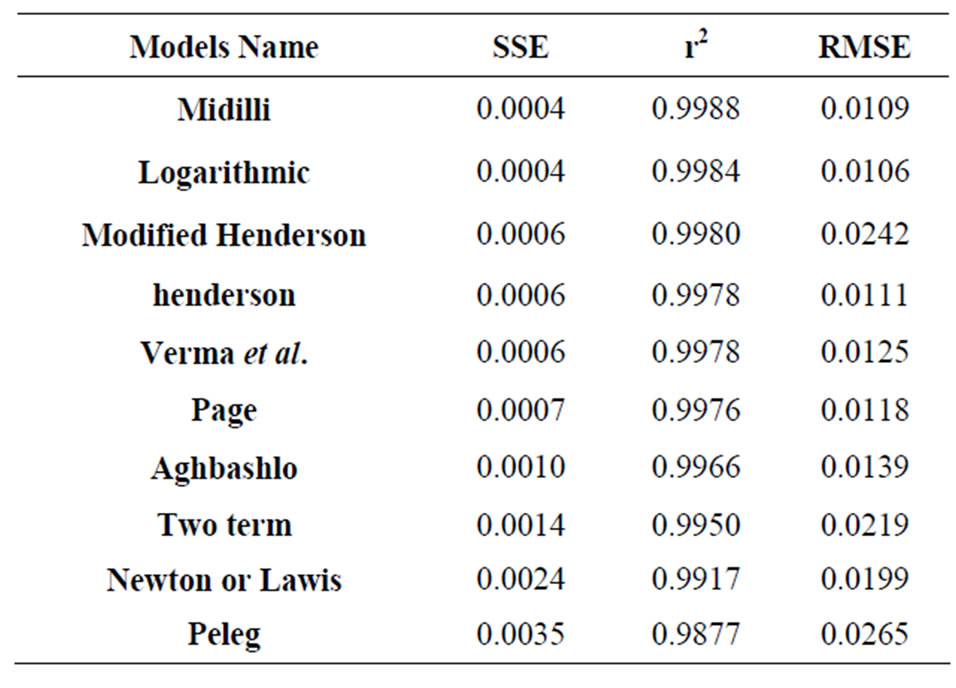
Table 4. Statistical criteria of the different models of specie 2 at 100˚C.
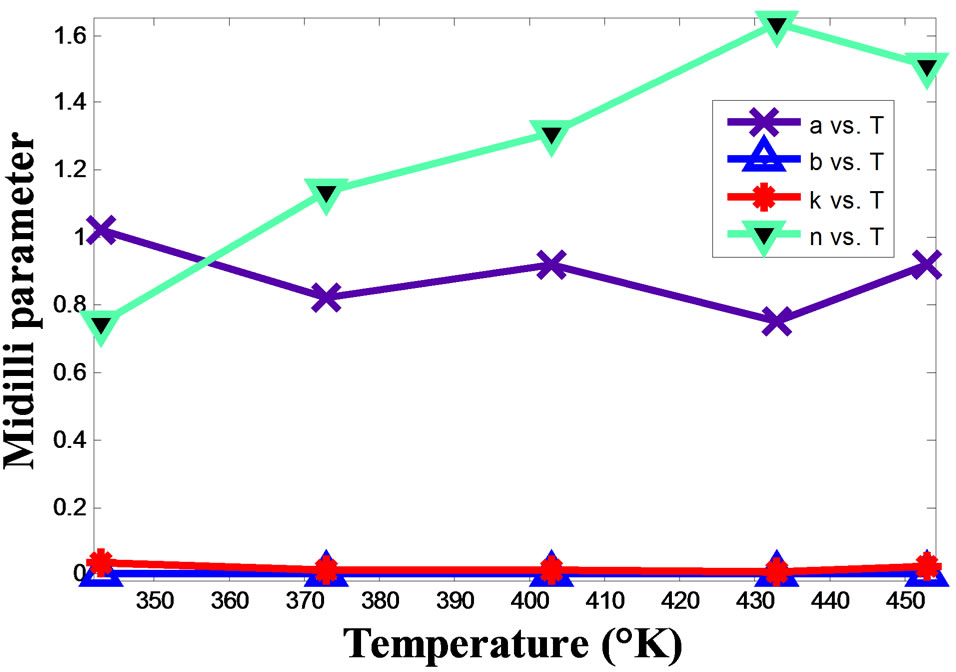
Figure 5. Variation of the Midilli parameters in function of temperature.
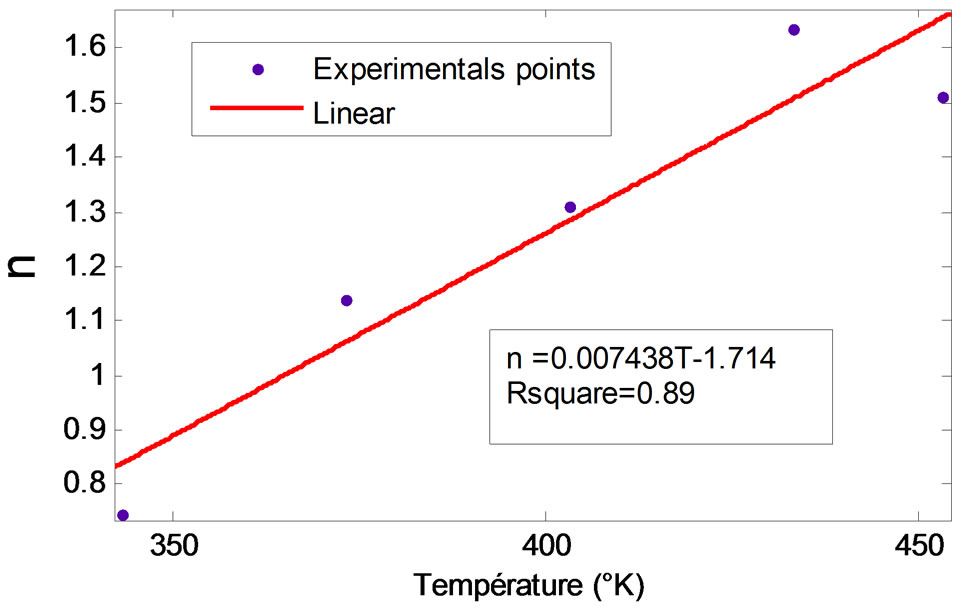
Figure 6. Linear regression of the parameter n in function of T.
where “t” is the time in seconds and Tabs is the absolute temperature
3.3. Effective Diffusivity
The mathematical model of the drying kinetics (12) has a linear part which is negligible in front of the exponential part. Fick’s Law expressed by Equation (8) can therefore be adopted for the estimation of the effective diffusivity. This coefficient is simply obtained from the slope of Equation (9), once the slope of the line Ln (MR) in function of time “t” is known. The values of Deff for the two species of shell are recorded in Table 5. It clearly seems that the effective diffusivity Deff increases considerably with the temperature. Furthermore, Deff does not differ much from one species to another.
Table 6 presents a way of comparing the effective diffusivity of different plants. It is apparent that those of the CS appears among highest but remains close to that of the flax and the bamboo used in the composites.
3.4. Activation Energy
The value of the activation energy noted Ea was determined by exploiting the Arrhenius equation. Indeed, the curve which connects the experimental points of Ln(Deff) and the inverse of the absolute temperature 1/Tabs (Figure 7) is almost linear. The slope of the linear regression line of these experimental points permits to deduce Ea from Equation (11), which is 31.69 and 34.46 kJ/mol for species 1 and 2 respectively. The intercept at the origin of this line permits to deduce the pre-exponential factor D0 of the Arrhenius equation which is 4.7025 × 10⁻⁷ and 1.4306 × 10⁻⁷ for species 1 and 2 respectively.
Table 7 presents the comparing of the activation energy of some plant products. It is clear from this table that the activation energy of the diffusion of water across the CS is amongst the median values but remain close to some wood like Sapin.
4. Conclusion
The CS of the two species, having initial water retention of 15.5 ± 2%, sized relative to a portion of a hollow sphere, is dried in an oven at temperatures ranging between 70˚C and 180˚C, in the goal of studying their drying kinetics. It was clear that the drying kinetics of the two species was almost identical. Of the 10 model tests, 4 had well simulated the given experiment with a correlation coefficient r2 > 0.998. Amongst these 4 models, the Midilli model was the most precise with an r2 > 0.999 and very small values of RMSE and of SSE. The coefficient of effective diffusivity obtained from the Arrhenius equation varies from 1.46 × 10⁻⁸ to 16.10 × 10⁻⁸ in m2/s for the species 1 and from 1.34 × 10⁻⁸ to 24.50 × 10⁻⁸ in m2/s for species 2, in the temperature range going from 70˚C to 180˚C. The activation energy was found and was 31.69 and 34.46 kJ/mol for species 1 and 2, respectively. Within sight of the results obtained, it appears that the CS is a material prone to the phenomenon of diffusion of
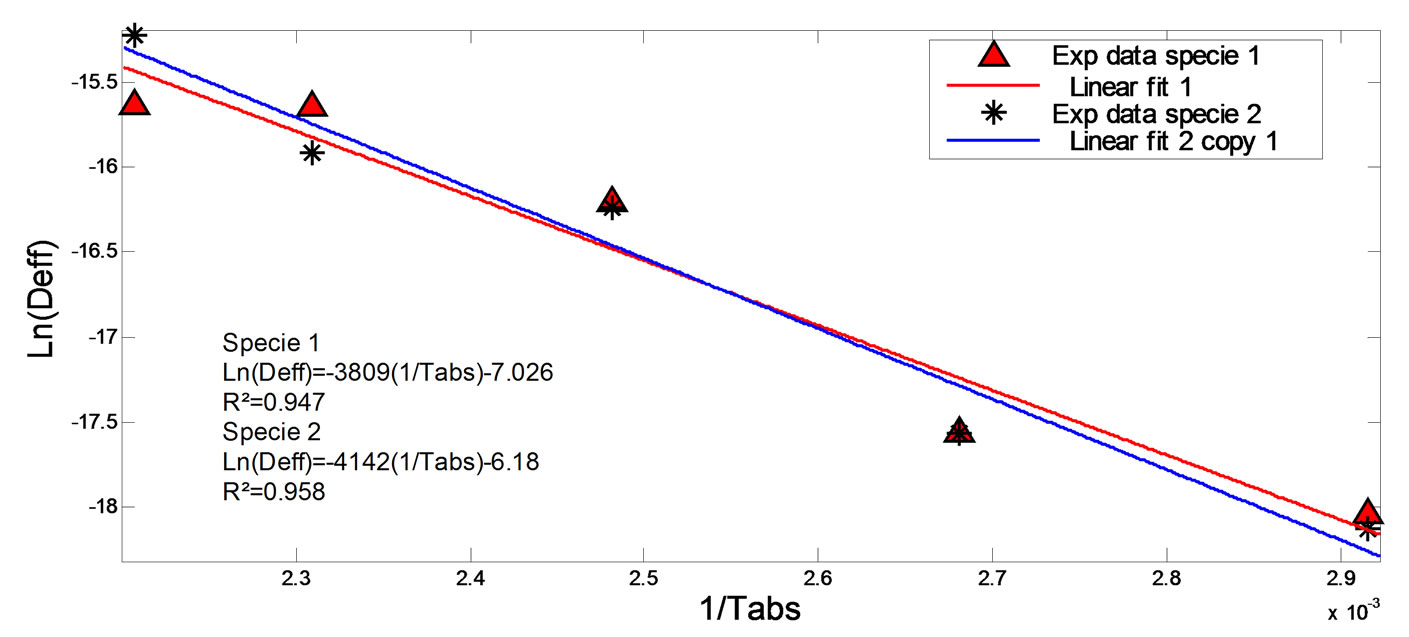
Figure 7. Relation between Deff and 1/Tabs.
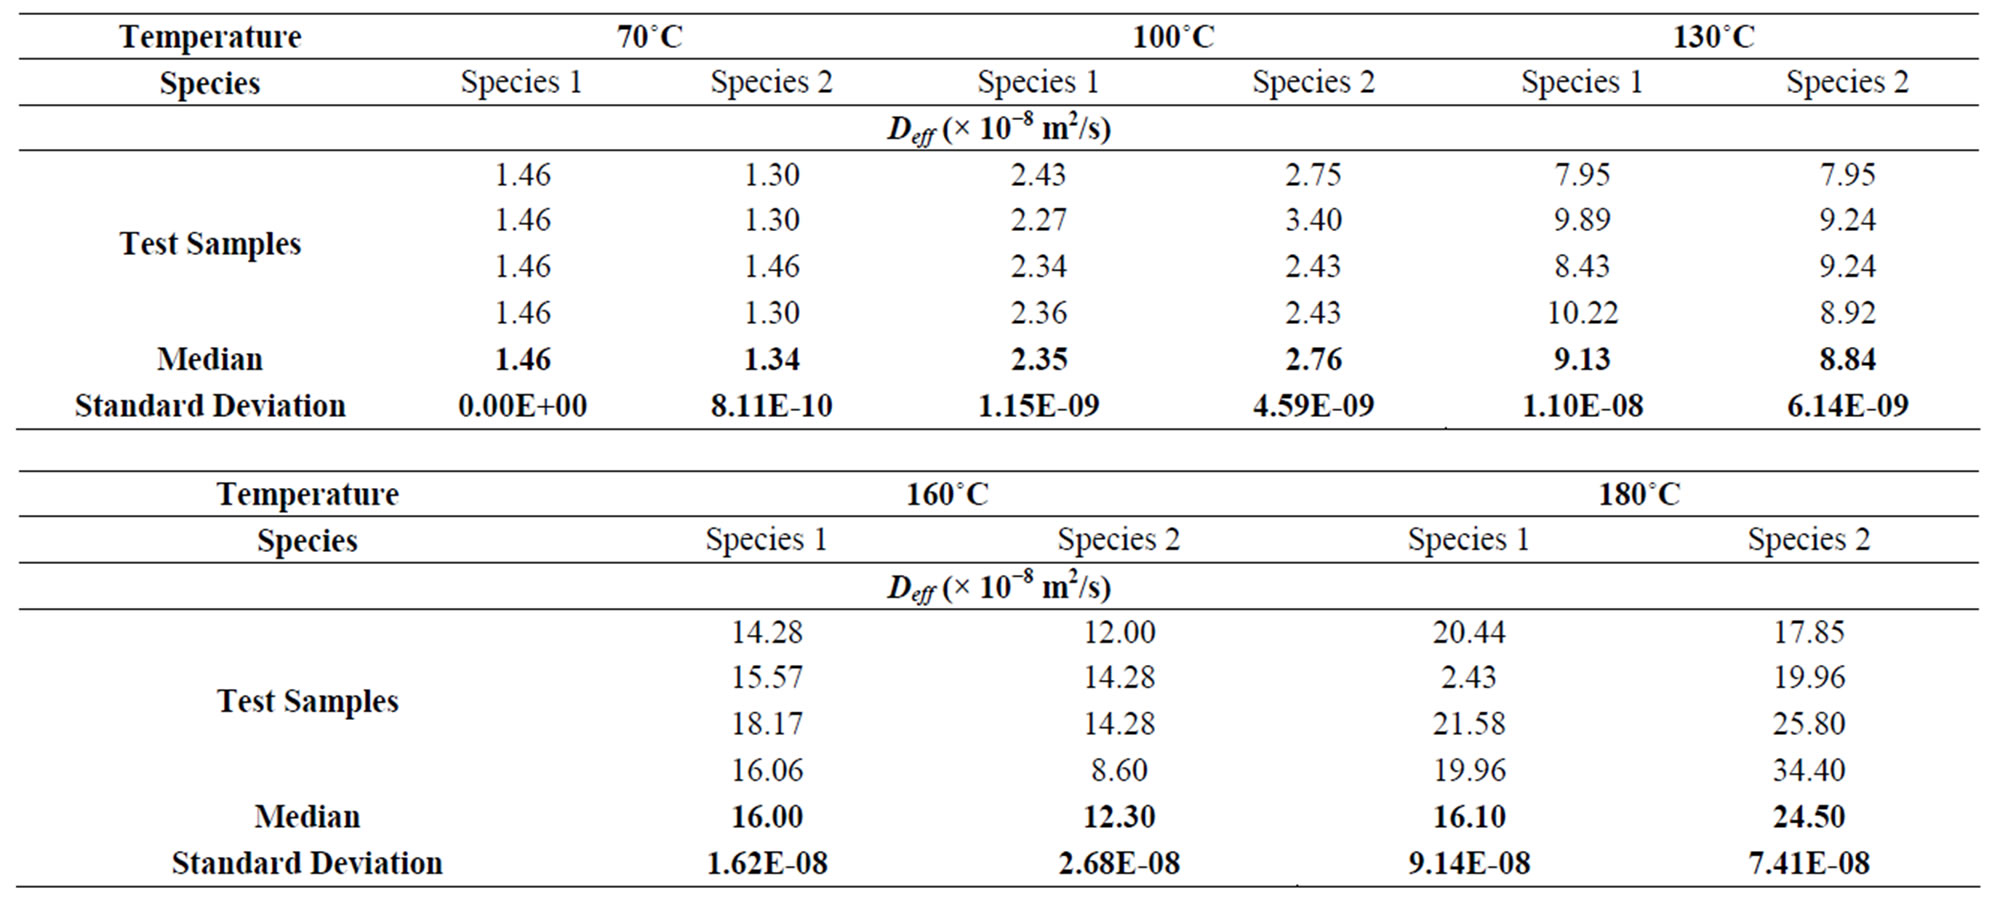
Table 5. Values of the coefficients of diffusion of the two species of coconut shells.
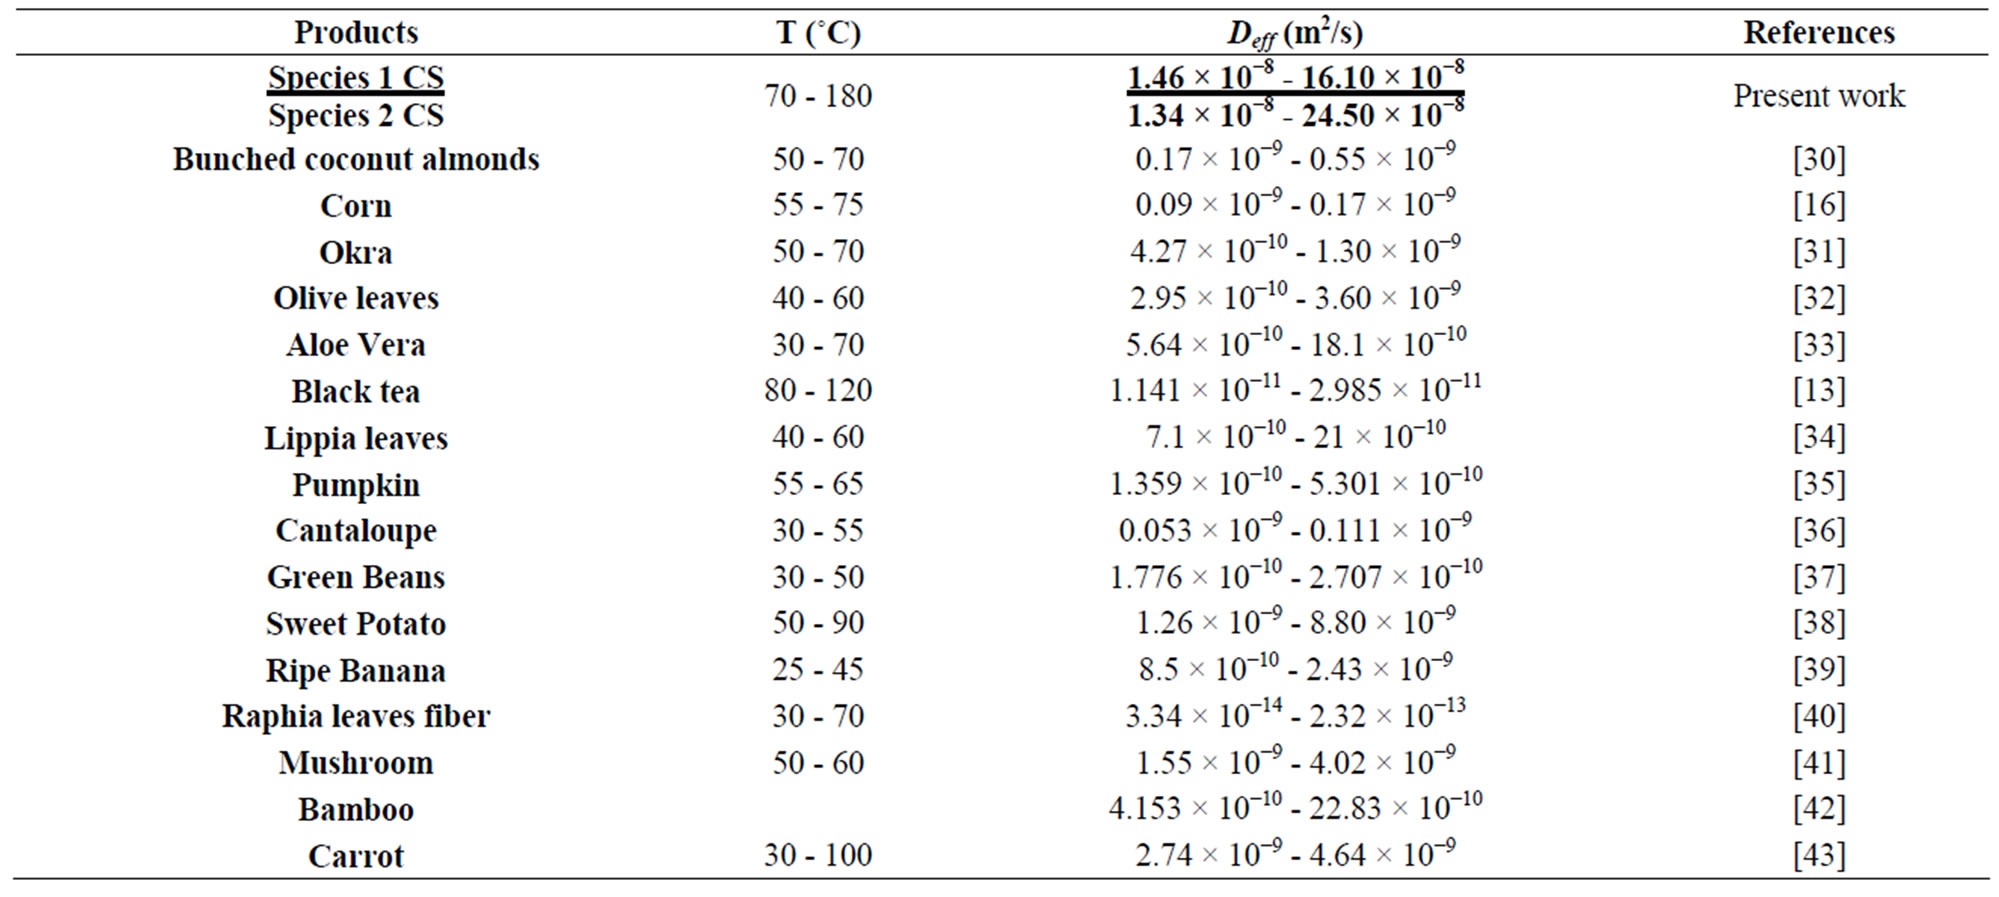
Table 6. Values of coefficients of effective diffusivity of some plants.
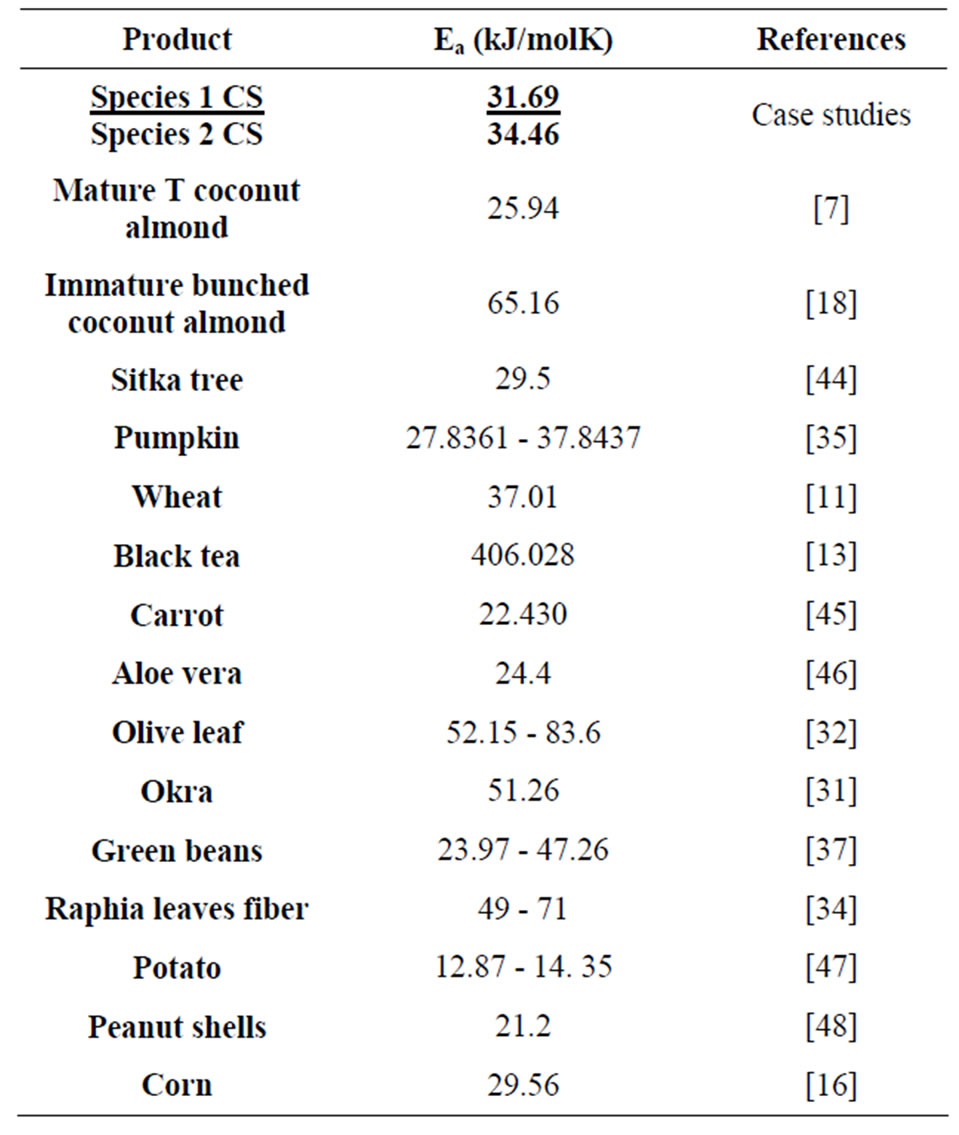
Table 7. Activation energy of some plants.
water during drying. It would be significant to study the influence of drying on mechanical properties of CS.
REFERENCES
- A. Shrikant, Survase, C. Bacigalupi, U. S. Annapure and R. S. Singhal, “Use of Coconut Coir Fibers as an Inert Solid Support for Production of Cyclosporin A,” Biotechnology and Bioprocess Engineering, Vol. 14, No. 6, 2009, pp. 769-774. http://dx.doi.org/10.1007/s12257-009-0121-0
- V. F. Olontsev, I. A. Borisova and E. A. Sazonova, “Pyrolysis of Coconut Shells for the Manufacture of Carbon Sorbents,” Solid Fuel Chemistry, Vol. 45, No. 1, 2011, pp. 44-49. http://dx.doi.org/10.3103/S0361521911010095
- P. B. Madakson, D. S. Yawas and A. Apasi, “Characterization of Coconut Shell Ash for Potential Utilization in Metal Matrix Composites for Automotive Applications,” International Journal of Engineering Science and Technology, Vol. 3, No. 4, 2012, pp. 1190-1198.
- A. Yerramala and C. Ramachandrudu, “Properties of Concrete with Coconut Shells as Aggregate Replacement,” International Journal of Engineering Inventions, Vol. 1, No. 6, 2012, pp. 21-23.
- O. A. Olugbenga, S. Opeyemi, et al., “Potentials of Coconut Shell and Husk Ash on the Geotechnical Properties of Lateritic Soil for Road Works,” International Journal of Engineering and Technology, Vol. 3, No. 2, 2011, pp. 87-94.
- E. Njeugna, D. Ndapeu, S. Bistac, J. Y. Drean, J. Ngenefeme Foba and M. Fogue, “Contribution to the Characterization of the Coconut Shells (Coco Nucifera) of Cameroon,” International Journal of Mechanics Structural, Vol. 4, No. 1, 2013, pp. 1-23.
- T. Madhiyanon, A. Phila and S. Soponronnarit, “Models of Fluidized Bed Drying for Thin-Layer Chopped Coconut,” Applied Thermal Engineering, Vol. 29, No. 14-15, 2009, pp. 2849-2854. http://dx.doi.org/10.1016/j.applthermaleng.2009.02.003
- I. Doymaz, “Thin-Layer Drying Behavior of Mint Leaves,” Journal of Food Engineering, Vol. 74, No. 3, 2006, pp. 370-375. http://dx.doi.org/10.1016/j.jfoodeng.2005.03.009
- N. A. Akgun and I. Doymaz, “Modelling of Olive Cake Thin-Layer Drying Process,” Journal of Food Engineering, Vol. 68, No. 4, 2005, pp. 455-461. http://dx.doi.org/10.1016/j.jfoodeng.2004.06.023
- I. Doymaz, “Convective Drying Kinetics of Strawberry,” Chemical Engineering and Processing, Vol. 47, No. 5, 2008, pp. 914-919. http://dx.doi.org/10.1016/j.cep.2007.02.003
- D. Mohaprtra and P. S. Rao, “A Thin Layer Drying Model of Parboiled Wheat,” Journal of Food Engineering, Vol. 66, No. 4, 2005, pp. 513-518. http://dx.doi.org/10.1016/j.jfoodeng.2004.04.023
- S. Erenturk, M. S. Gulaboglu and S. Gultekin, “The ThinLayer Drying Characteristics of Rosehip,” Biosystems Engineering, Vol. 89, No. 2, 2004, pp. 159-166. http://dx.doi.org/10.1016/j.biosystemseng.2004.06.002
- P. C. Panchariya, D. Popovic and A. L. Sharma, “ThinLayer Modeling of Black Tea Drying Process,” Journal of Food Engineering, Vol. 52, No. 4, 2002, pp. 349-357. http://dx.doi.org/10.1016/S0260-8774(01)00126-1
- R. K. Goyal, A. R. P. Kingsly, et al., “Thin-Layer Drying Kinetics of Raw Mango Slices,” Biosystems Engineering, Vol. 95, No. 1, 2006, pp. 43-49. http://dx.doi.org/10.1016/j.biosystemseng.2006.05.001
- G. E. Page, “Factors Influencing the Maximum Rates of Air Drying Shelled Corn in Thin Layers,” M.Sc. Thesis, Purdue University, West Lafayette, 1949.
- I. Doymaz and M. Pala, “The Thin-Layer Drying Characteristics of Corn,” Journal of Food Engineering, Vol. 60, No. 2, 2003, pp. 125-130. http://dx.doi.org/10.1016/S0260-8774(03)00025-6
- I. Doymaz, “Drying Behavior of Green Beans,” Journal of Food Engineering, Vol. 69, No. 2, 2005, pp. 161-165. http://dx.doi.org/10.1016/j.jfoodeng.2004.08.009
- P. S. Madamba and R. I. Lopez, “Optimization of the Osmotic Dehydration of Mango (Mangifera india) Slices,” Drying Technology, Vol. 20, No. 6, 2002, pp. 1227-1242. http://dx.doi.org/10.1081/DRT-120004049
- S. M. Henderson and S. Pabis, “Grain Drying Theory I. Temperature Effect on Drying Coefficient,” Journal of Agricultural Engineering Research, Vol. 6, 1961, pp. 169-174.
- I. Doymaz, “Convective Air Drying Characteristics of Thin Layer Carrot,” Journal of Food Engineering, Vol. 61, 2004, pp. 359-364. http://dx.doi.org/10.1016/S0260-8774(03)00142-0
- Z. F. Wang, J. H. Sun, X. J. Liao, F. Chen, G. H. Zhao, J. H. Wu and X. S. Hu, “Mathematical Modeling on Hot Air Drying of Thin Layer Apple Pomace,” Food Research International, Vol. 40, No. 1, 2007, pp. 39-46. http://dx.doi.org/10.1016/j.foodres.2006.07.017
- A. Midilli, H. Kucuk and Z. Yapar, “A New Model for Single Layer Drying of Some Vegetables,” Drying Technology: An International Journal, Vol. 20, No. 7, 2002, pp. 1503-1513. http://dx.doi.org/10.1081/DRT-120005864
- K. Sacilik and A. K. Elicin, “The Thin Layer Drying Characteristics of Organic Apple Slices,” Journal of Food Engineering, Vol. 73, No. 4, 2006, pp. 281-289. http://dx.doi.org/10.1016/j.jfoodeng.2005.03.024
- A. R. Celma, S. Rojas, F. Lopez, I. Montero and T. Miranda “Thin-Layer Drying Behaviour of Sludge of Olive Oil Extraction,” Journal of Food Engineering, Vol. 80, No. 4, 2007, pp. 1261-1271. http://dx.doi.org/10.1016/j.jfoodeng.2006.09.020
- L. R. Verma, R. A. Bucklin, J. B. Endan and F. T. Wratten, “Effets of Drying Air Parameter on Rice Grying Model,” Transactions of the ASABE, Vol. 28, No. 1, 1985, pp. 296-301. http://dx.doi.org/10.13031/2013.32245
- M. Peleg, “An Empirical Model for the Description of Moisture Sorption Curves,” Journal of Food Science, Vol. 53, No. 4, 1988, pp. 1216-1217. http://dx.doi.org/10.1111/j.1365-2621.1988.tb13565.x
- M. Aghbashlo, et al., “Mathematical Modeling of Carrot Thin-Layer Drying Using New Model,” International Agrophysics, Vol. 23, 2009, pp. 313-317.
- J. Crank, “The Mathematics of Diffusion,” Oxford University Press, Oxford, 1975.
- L. Athinoula, Petrou, M. Roulia and K. Tampouris, “The Use of the Arrhenius Equation in the Study of Deterioration and of Cooking of Foods: Some Scientific and Pedagogic Aspect,” Science-Technology-Environment-Society (STES), Vol. 3, No. 1, 2002, pp. 87-97.
- P.S. Madamba, “Thin Layer Drying Models for Osmotically Pre-Dried Young Coconut,” Drying Technology: An International Journal, Vol. 21, No. 9, 2003, pp. 1759- 1780. http://dx.doi.org/10.1081/DRT-120025507
- I. Doymaz, “Drying Characteristics and Kinetics of Okra,” Journal of Food Engineering, Vol. 69, No. 3, 2005, pp. 275-279. http://dx.doi.org/10.1016/j.jfoodeng.2004.08.019
- B. Nourhène, K. Mohammed and K. Nabila, “Experimental and Mathematical Investigations of Convective Solar Drying of Four Varieties of Olive Leaves,” Food and Bioproducts Processing, Vol. 86, No. 3, 2008, pp. 176-184. http://dx.doi.org/10.1016/j.fbp.2007.10.001
- S. Simal, A. Femenia, M. C. Garau and C. Rossello, “Use of Exponential, Page’s and Diffusional Models to Simulate the Drying Kinetics of Kiwi Fruit,” Journal of Food Engineering, Vol. 66, No. 3, 2005, pp. 323-328. http://dx.doi.org/10.1016/j.jfoodeng.2004.03.025
- R. G. Elenga, G. Tsiba and G. J. Maniongui, “Effects of Drying Methods on the Drying Kinetics and the Essential Oil of Lippia Multiflora Moldenke Leaves,” Research Journal of Applied Sciences, Engineering and Technology, Vol. 3, No. 10, 2011, pp. 1135-1141.
- K. Limpaiboon, “Effects of Temperature and Slice Thickness on Drying Kinetics of Pumpkin Slices,” Walailak Journal of Science and Technology (WJST), Vol. 8, No. 2, 2011, pp. 159-166.
- G. O. I. Ezeiki and L. Otten, “Two-Compartment Model for Drying Unshelled Melon (egusi) Seeds,” American Society of Agricultural Engineers, Vol. 33, No. 1, 1991, pp. 73-78.
- B. Abbasi Souraki, A. Ghaffari and Y. Bayat “Mathematical Modeling of Moisture and Solute Diffusion in the Cylindrical Green Bean During Osmotic Dehydration in Salt Solution,” Food and Bioproducts Processing, Vol. 90, 2012, pp. 64-71. http://dx.doi.org/10.1016/j.fbp.2010.11.015
- N. J. Singh and R. K. Pandey, “Convective Air Drying Characteristics of Sweet Potato Cube (Ipomoea batatas),” Food and Bioproducts Processing, Vol. 90, No. 2, 2012, pp. 317-322. http://dx.doi.org/10.1016/j.fbp.2011.06.006
- N. K. Rastogi, K. S. M. S. Raghavarao and K. Niranjan, “Mass Transfert during Osmotic Dehydration of Banana: Fickian Diffusion in Cylindrical Configuration,” Journal of Food Engineering, Vol. 31, No. 4, 1997, pp. 423-432. http://dx.doi.org/10.1016/S0260-8774(96)00086-6
- R. G. Elenga, G. F. Dirras, J. G. Maniongui and B. Mabiala, “Thin-Layer Drying of Raffia Textiles Fiber,” BioResources, Vol. 6, No. 4, 2011, pp. 4135-4144.
- T. Arumuganathan, M. R. Manikantan, R. D. Rai, S. Anandakumar and V. Khare, “Mathematical Modeling of Drying Kinetics of Milky Mushroom in a Fluidized Bed Dryer,” International Agrophysics, Vol. 23, 2009, pp. 1-7.
- M. B. Lalit, A. Kar, S. Satya and N. N. Satya “Kinetics of Colour Change of Bamboo Shoot Slices during Microwave Drying,” International Journal of Food Science & Technology,Vol.46, No. 4, 2011, pp. 827-833.
- N. Kumar, B. C. Sarkar and H. K. Shama, “Mathematical Modeling of Thin Layer Hot Air Drying of Carrot Pomace,” Journal of Food Science Technology, Vol. 49, No. 1, 2012, pp. 33-41. http://dx.doi.org/10.1007/s13197-011-0266-7
- J. Stamm, “Diffusion in Cellulosic Materials,” Australian Pulp and Paper Industry Technical association Proceeding, Vol. 10, 1956, pp. 244-270.
- H. Togrul, “Suitable Drying Model for Infrared Drying of Carrot,” Journal of Food Engineering, Vol. 77, No. 3, 2006, pp. 610-619. http://dx.doi.org/10.1016/j.jfoodeng.2005.07.020
- S. Simal, A. Femenia, M. C. Garau and C. Rossello, “Use of Exponential, Page’s and Diffusional Models to Simulate the Drying Kinetics of Kiwi Fruit,” Journal of Food Engineering, Vol. 66, No. 3, 2005, pp. 323-328. http://dx.doi.org/10.1016/j.jfoodeng.2004.03.025
- W. Senadeera, R. Bhesh, Bhandari, G. Young, B. Wijesinghe, “Influence of Shapes of Selected Vegetable Materials on Drying Kinetics during Fluidized Bed Drying,” Journal of Food Engineering, Vol. 58, No. 3, 2003, pp. 277-283. http://dx.doi.org/10.1016/S0260-8774(02)00386-2
- D. Chen, K. Li and X. Zhu, “Determination of Effective Moisture Diffusivity and Activation Energy for Drying of Powdered Peanut Shell under Isothermal Conditions,” BioResources, Vol. 7, No. 3, 2012, pp. 3670-3678.
NOTES
*Corresponding author.