Journal of Modern Physics
Vol.08 No.01(2017), Article ID:73758,16 pages
10.4236/jmp.2017.81010
Dephasing Measurements in InGaAs/AlInAs Heterostructures: Manifestations of Spin-Orbit and Zeeman Interactions
Lior H. Tzarfati1, Rafi Hevroni1, Amnon Aharony1,2, Ora Entin-Wohlman1,2, Michael Karpovski1, Victor Shelukhin1, Vladimir Umansky3, Alexander Palevski1
1Raymond and Beverly Sackler School of Physics and Astronomy, Tel Aviv University, Tel Aviv, Israel
2Physics Department, Ben Gurion University, Beer Sheva, Israel
3Department of Condensed Matter Physics, Weizmann Institute of Science, Rehovot, Israel

Copyright © 2017 by authors and Scientific Research Publishing Inc.
This work is licensed under the Creative Commons Attribution International License (CC BY 4.0).
http://creativecommons.org/licenses/by/4.0/


Received: November 27, 2016; Accepted: January 20, 2017; Published: January 23, 2017
ABSTRACT
We have measured weak antilocalization effects, universal conductance fluctuations, and Aharonov-Bohm oscillations in the two-dimensional electron gas formed in InGaAs/AlInAs heterostructures. This system possesses strong spin-orbit coupling and a high Landé factor. Phase-coherence lengths of 2 - 4 μm at 1.5 - 4.2 K are extracted from the magnetoconductance measurements. The analysis of the coherence- sensitive data reveals that the temperature dependence of the decoherence rate complies with the dephasing mechanism originating from electron-electron interactions in all three experiments. Distinct beating patterns superimposed on the Aharonov- Bohm oscillations are observed over a wide range of magnetic fields, up to 0.7 Tesla at the relatively high temperature of 1.5 K. The possibility that these beats are due to the interplay between the Aharonov-Bohm phase and the Berry one, different for electrons of opposite spins in the presence of strong spin-orbit and Zeeman interactions in ring geometries, is carefully investigated. It appears that our data are not explained by this mechanism; rather, a few geometrically-different electronic paths within the ring’s width can account for the oscillations’ modulations.
Keywords:
Mesoscopic Physics, Decoherence, Aharonov Bohm, Spin Orbit Interaction, Berry Phase

1. Introduction
The electronic characteristic scale on which quantum interference can occur in a meso-scopic sample is the phase-coherence length . The study of decoherence in quantum-mechanical systems has gained much interest recently, because
  is relevant to spintronics, i.e., to spin-sensitive devices [1] [2] [3] [4] comprising materials with strong spin-orbit interactions. The variation of
  with the temperature
  serves to indicate the main scattering mechanism which limits phase coherence, be it electron-electron, electron-phonon, or spin-dependent, scattering processes. At low temperatures, though electron-electron scattering is the dominant mechanism respon- sible for dephasing. Theoretically, the dephasing rate,
  , due to this scattering vanishes linearly with
  as the temperature decreases towards zero, in agreement with the prediction of Altshuler et al. [5] . To determine experimentally the relevant dephasing mechanism and to estimate the coherence length, quantum-interference properties, such as weak localization and antilocalization [6] [7] , universal conductance fluctuations [8] , and Aharonov-Bohm oscillations [9] [10] [11] , are measured and ana- lyzed. These quantum effects have different dependencies on the coherence length; their combined study provides a comprehensive picture of the processes leading to decoherence in weakly-disordered nanostructures.
Here we focus on nanostructures in which the electrons are subjected to significant spin-orbit coupling, and report on studies of weak antilocalization (WAL) effects, uni- versal conductance fluctuations (UCF), and Aharonov-Bohm (AB) oscillations in the magnetoresistance data of mesoscopic samples of InGaAs/AlInAs. This material is well- known for its strong Rashba-type spin-orbit interaction [12] [13] , characterized by the coupling strength  of about of 10−11 eV m [14] [15] . This value corresponds to a spin-orbit energy [16]
  (the Fermi wave vector of our samples is
 ). The Landé factor of our material is about 15, and hence the Zeeman energy is
 , where the magnetic field
  is measured in Tesla.
The spin-orbit interaction, coupling the momentum of the electron to its spin, in conjunction with a Zeeman field gives rise to Berry phases [17] . The simplest illustra- tion of a Berry phase occurs when a spin 1/2 follows adiabatically a magnetic field whose direction varies in space [18] [19] . When that direction returns to its initial orientation the spin wave function acquires a geometrical phase factor. A spatially- inhomogeneous magnetic field can be produced by the joint operation of spinorbit coupling and a Zeeman field [16] . Because the Berry phase may modify periodicities related to the Aharonov-Bohm effect, it has been proposed that it can be detected in persistent currents, magnetoconductance, and universal conductance fluctuations of strongly spin-orbit coupled mesoscopic systems [16] [19] [20] [21] . Specifically, the Berry phase is expected to manifest itself in additional oscillations superimposed on the conventional Aharonov-Bohm ones, leading to peak-splitting in the power spectrum of those oscillations [18] , i.e., to a beating pattern. Beating magnetoconductance oscilla- tions have been indeed reported [22] [23] [24] [25] [26] for AB rings fabricated in materials with strong spin-orbit interactions at temperatures below 500 mK. In com- parison, our samples show beating patterns at much more elevated temperatures.
However, one should exercise caution when adopting the interpretation based on the effect of Berry phases for beating patterns superimposed on Aharonov-Bohm oscilla- tions. First, the Aharonov-Bohm oscillations appear at arbitrarily small magnetic fields, while the effect of the Berry phase reaches its full extent only in the adiabatic limit, realized when both  and
and  are larger [16] [18] [19] than the frequency of the electron rotation around the ring. Second, the Berry geometrical phase is restricted to the range
 , limiting the corresponding geometrical flux to the order of one flux quantum [19] , which may make it negligible as compared with the Aharonov-Bohm flux. Third, there can be other causes for the appearance of beating patterns: a recent experimental study [27] carried on InGaAs/InAlAs mesoscopic rings reports on beating patterns in the magnetoresistance as a function of the magnetic field, measured at tem- peratures up to 3 K. The authors attribute these patterns to the interplay of a few, geo- metrically-different, closed paths that are created in a finite-width ring [28] . We carry out below a thorough attempt to fit our AB oscillations’ data to the theoretical expres- sions predicting the beating patterns, in particular the expressions given in Ref. [16] . We find that the theoretical expression for the transmission of a strongly spin-orbit coupled Aharonov-Bohm ring does show a beating pattern. However, it seems to be due to the Zeeman interaction alone; the reason being the confinement of the Berry phase to the range
  mentioned above. Our conclusion is that, given the phy- sical parameters of our rings, the beating patterns we observe probably cannot be attributed to the effects of the Berry phase.
The remaining part of the paper is organized as follows. Section 2 describes the samples’ preparation and the measurements techniques. Section 3 includes the results of the measurements of the antilocalization effects (Section 3.1), the universal con- ductance fluctuations (Section 3.2), and the Aharonov-Bohm oscillations (Section 3.3). In each subsection we list the values of the coherence length extracted from the data. In the last subsection there we combine the results of all measurements to produce the dependence of the dephasing rate in our samples on the temperature (Section 3.4), from which we draw the conclusion that it is electron-electron scattering that dephases the interference in our InGaAs/AlInAs heterostructures. Section 4 presents our at- tempts to explain the beating pattern of the AB oscillations displayed in Section 3.3. Our conclusions are summarized in Section 5.
2. Samples’ Preparation and Measurements
Three types of samples were prepared, all comprising a single basic material. The schematic drawing of the layers in the InGaAs/AlInAs heterostructures used in our studies is given in Figure 1. This material was grown by molecular-beam epitaxy, as described in detail elsewhere [29] [30] . The geometrical shape of above-micron devices was patterned by a conventional photolithography, while that of the nanoscale ones were patterned using e-beam lithography. About 1 micron deep mesa was etched with phosphoric acid (of concentration 1:8) to prevent as much as possible parasitic conduc- tion in the structure below the quantum well. Vacuum deposition of a Au-Ge conven- tional alloy was used to form Ohmic contacts. Electron density of  and electron mobility of 1.8 × 105 cm2/(V sec) were deduced from resistivity and Hall-effect measurements taken at 4.2 K. These values were calculated for the samples which have a significant contribution of the parallel conduction of low mobility layers below the 2DEG in the quantum well, and therefore are different from the actual values of the mobility and carrier density of electrons in that quantum well.
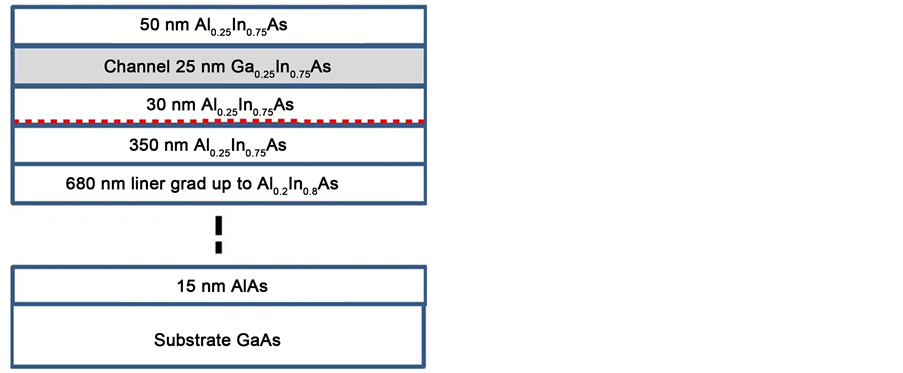
Figure 1. (Color online) Schematic structure of the sample layers. The dashed (red) line in the spacer layer is the Si  doping.
Measuring each of the coherence effects requires samples of different geometry. We have used a  long (i.e., the distance between the voltage probes) and
  wide Hall bar for the weak-localization studies, a shorter Hall bar of length
  and width
  for the UCF measurements, and two identically-prepared rings (denoted below by “A” and “B”), of average radius
 , and average width
  for the AB measurements, see Figure 2. The resistance was measured by the four-terminal method, exploiting a low-noise analog lock-in amplifier (EG & GPR- 124A) in perpendicularly-applied magnetic fields up to 5 Tesla. The measurements were performed in a 4He cryostat at temperatures in the range of
 .
.
3. Results
3.1. Weak Antilocalization
Weak-localization corrections to the average conductivity arise from interference between pairs of time-reversed paths that return to their origin. Application of a mag- netic field that destroys time-reversal symmetry suppresses the interference and thus increases the conductivity. Antilocalization appears in systems in which the electrons are subjected to (rather strong) spin-orbit coupling. Then, the interference-induced correction to the conductivity is reduced, because the contribution of time-reversed paths corresponding to wave functions of opposite spins’ projections is negative, while that of the equal spin-direction time-reversed paths remains positive. The reason is that upon following a certain closed path, the electron’s spin is rotated by , while for the time-reversed path with the opposite spin projection it is rotated by
 . These two phases add up to give a total rotation of
 , leading to a Berry’s phase factor of −1. This results in a higher net conductivity, and the positive magneto-conductivity caused by localization is turned into a negative one at low magnetic fields.
Measuring the magnetoconductivity as a function of the magnetic field allows for an accurate estimate of the phase-breaking length . The dotted curves in Figure 3 are the magnetoconductivity
  of the longer Hall bar as a function of a magnetic field
  directed normal to the sample. Upon increasing the magnetic-field strength
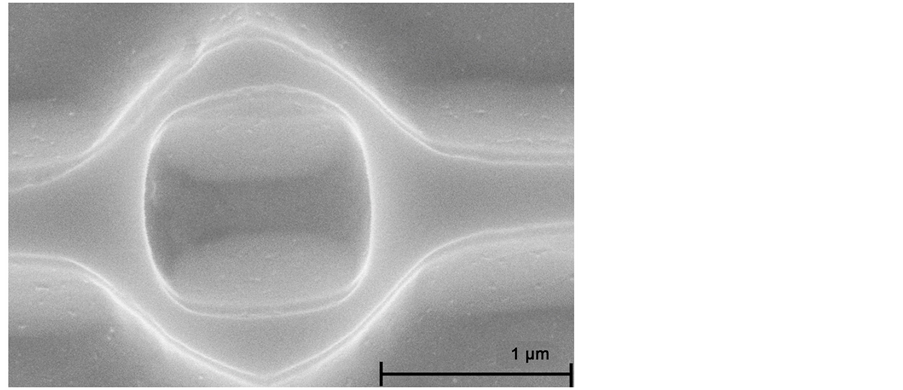
Figure 2. (Color online) High-resolution scanning-electron microscope image of one of the measured Aharonov-Bohm rings.
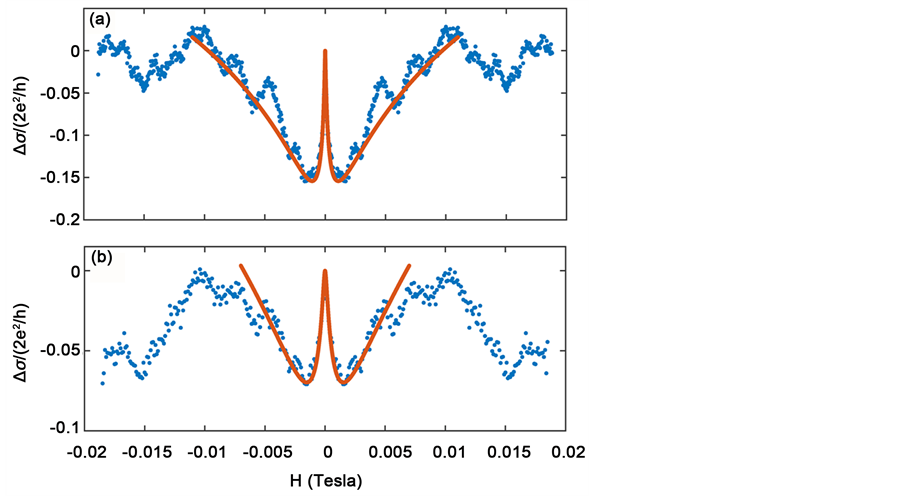
Figure 3. (Color online) The magnetoconductivity as a function of a magnetic field normal to the sample plane, at 1.6 K (a) and 4.2 K (b), for the WAL sample. The dotted (blue) lines are the data; the solid (red) curves represent the theoretical magnetoconductivity, calculated from Equation (1).
from zero, one observes a decreasing conductivity originating from the suppression of antilocalization, followed by an increase due to the destruction of localization. Indeed, the line shapes at small magnetic fields measured at 1.4 K and 4.2 K, are nicely fitted to the curves calculated from the theoretical expression derived in Refs. [6] [7] . As found there, the magnetoconductivity of a two-dimensional electron gas, in the presence of a perpendicular magnetic field, is
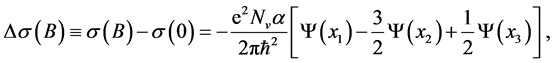 (1)
(1)
where
 (2)
(2)
 being the digamma function. In Equation (1),
  is the valley degeneracy, and
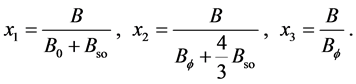 (3)
(3)
These parameters comprise , the “phase-coherence” magnetic field, roughly the field required to destroy phase coherence,
  that represents the spin-orbit coupling, with
 , and
, and , where
  is the mean- free path.
The comparison of the data with Equation (1) has yielded  for the spin-orbit characteristic length,
  at 1.6 K, and
  at 4.2 K for the phase-coherence length. The relatively large error bars do not arise from the fitting procedure; these are due to the scattering of the fitting values obtained for different samples.
As seen in Figure 3, the curves of the data-points deviate from the theoretical ones for magnetic fields exceeding  Tesla. We believe that at these fields there appear other quantum corrections, e.g., interaction effects, and contributions arising from the parasitic conductances of the layers below the quantum well.
Equation (1) derived in Refs. [6] [7] emphasizes the contribution to the conductivity resulting from the impurity-induced spin-orbit interaction or from the cubic (in-the- momentum) Dresselhaus coupling. The theory of Iordanskii et al. [31] accounts for the linear-in-the-momentum Rashba interaction, which is rather significant in InGaAs [32] . As shown in Ref. [31] Iordanskii, this linear interaction adds another characteristic spin-orbit field in addition to , representing the linear-in-the-momentum Rashba interaction. This additional field is denoted
 . Indeed, our data can be also fitted to Equation (13) of Ref. [31] ; we have found though, that due to the larger number of fitting parameters [as compared to Equation (1)] multiple sets of the fitting parameters
  and
and  can produce the same quality of fit as obtained for Equation (1), with the same values of
  as used in the latter. In order to distinguish between the sets of fitting parameters the range of magnetic fields should be much larger and the quality of the data, limited mostly by universal conductance fluctuation, should be much better. Unfortunately, out data do not meet these restrictions. As the focus of the present study is on dephasing mechanism, and since both theories produce the same values of
 , we present in Figure 3 the fitting curve of Equation (1).
Finally we note that for  and carrier density of
 , the mean-free path is about
 , which gives
  Tesla. We have found that
  is not very sensitive to the value of
 .
.
3.2. Universal Conductance Fluctuations
Like weak localization and weak antilocalization effects, the universal conductance fluc- tuations of a mesoscopic system result from interference of the electronic wave func- tions corresponding to pairs of time-reversed paths. As such, these fluctuations are do- minated by the phase-coherence length . The UCF are expressed by the ensemble- average autocorrelation function of the dimensionless conductance,
  [8] ,
[8] ,
 (4)
(4)
where . The angular brackets denote the ensemble average. Theoretically, the average is over an ensemble of mesoscopic systems of various im- purity configurations; the experiment is carried out on a single sample and the average is accomplished by ramping a magnetic field over the range
  (
( was in the range
  Tesla). This can generate sample-specific, random-looking but repro- ducible fluctuations in the conductance.
The phase-coherence length is derived from the magnetic correlation field , i.e., the field corresponding to the half width at half height of
 . This magnetic correlation field is found from the correlation function using the condition
 (5)
(5)
where  is the root-mean-square (rms) of the conductance fluctuations,
  ,
,
 (6)
(6)
( is the length of the specimen) [33] . The coefficient
  represents the effect of the spin- orbit coupling on the magnitude of the fluctuations. The correlation field is given by
 (7)
(7)
where  is the sample’s width.
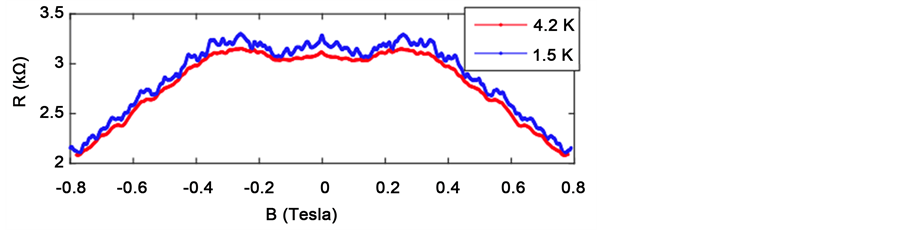
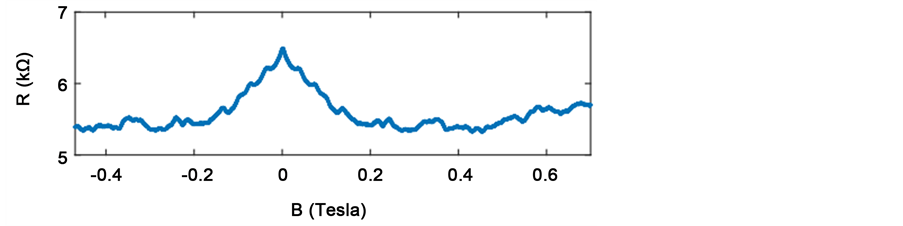
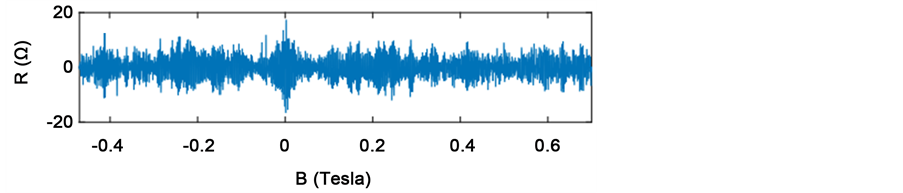
The resistance of the shorter Hall bar, measured at 1.52 K and at 4.2 K, is shown in Figure 4(a). The reproducible conductance fluctuations are displayed in Figure 4(b); the curve there is obtained by subtracting the slowly-varying background of the average conductance from the measured one. Taking  (corresponding to strong spin- orbit coupling [33] [34] ) in Equation (6) yields that the coherence length of our short Hall bar is
  at 1.52 K and is
  at 4.2 K; Equation (7) yields the values
  at 1.52 K and
  at 4.2 K.
3.3. The Frequency and the Amplitude of the Aharonov-Bohm Oscillations
Perhaps the most conspicuous manifestation of the Aharonov-Bohm effect [9] in con- densed matter are the periodic oscillations of the magnetoconductance of a meso- scopic ring as a function of the magnetic flux penetrating it, whose periodicity is the flux quantum . These oscillations are utilized to probe the sensitivity of the electronic wave functions to magnetic fluxes. Their amplitudes, i.e., their “visibility” is the hallmark of quantum coherence.
The average area of the two rings we measured (see Section 2 and Figure 2) is ; the periodicity of the AB oscillations with respect to the magnetic field is thus expected to be
  Tesla−1. The magnetoresistance of our ring A as a function
 (a)
(a)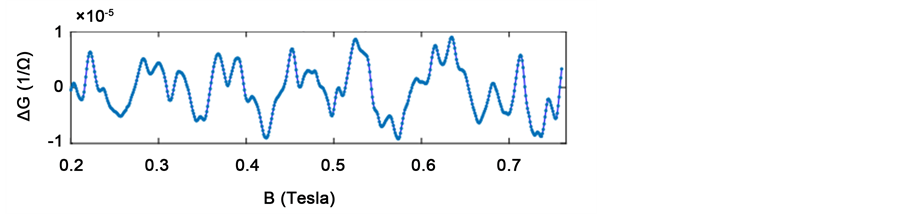 (b)
(b)
Figure 4. (Color online) (a) The resistance as a function of the magnetic field of a UCF sample at 1.52 K and at 4.2 K; (b) The deviation of the magnetoconductance from the average background average.
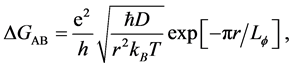
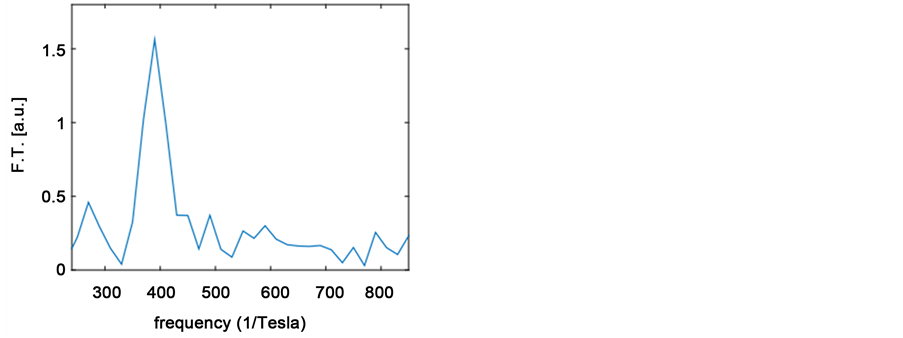
of the magnetic field measured at 1.5 K is portrayed in Figure 5. Panel (a) there depicts the raw data, and panel (b) magnifies the low-field part of the data. Once the low- frequency data points are filtered out [see panels (a) and (b) in Figure 6], one can indeed observe fast oscillations with a frequency of about 400 Tesla−1, consistent with the estimated periodicity for the AB oscillations. On top of these, one sees beats, with a frequency of about 40 Tesla−1. These observations are consistent with the Fourier transform of the resistance, shown in Figure 7. Panel (a) there, (at magnetic fields in the range 0.1 - 0.15 Tesla) is peaked around the expected AB frequency  Tesla−1. Panel (b), based on data points from the range 0.65 - 0.7 Tesla, has two peaks, at
  Tesla−1 and at
  Tesla−1. Analysis of data between these ranges shows a gradual decrease of the (average) AB frequency and a gradual increase of the splitting between the two peaks. Although the coherence length of our rings is of the order of the ring circumference (see below), Figure 7(b) also shows small peaks around
  Tesla−1, probably corresponding to the second harmonic of the AB oscillations.
The splitting of the main peak in the power spectrum is the hallmark of the beating pattern [18] , expected to result from the joint effect of the strong spin-orbit coupling and the Zeeman interaction [16] [24] . The appearance of the beating patterns, and their comparison with theoretical expectations, are discussed in Section 4.
The Fourier transforms of the magnetoresistance of our sample B are similar to those shown in Figure 7 for sample A. The amplitude of the AB oscillations (the “visibility”), and therefore also the heights of the leading peak in the Fourier transforms of the magnetoresistance, decrease with increasing temperature, because of the decrease of the coherence length. To deduce this length, we used measurements on our sample B, at magnetic fields below 0.05 Tesla, taken at 1.54 K, 1.78 K and 2.3 K. The narrow range of
 (a)
(a)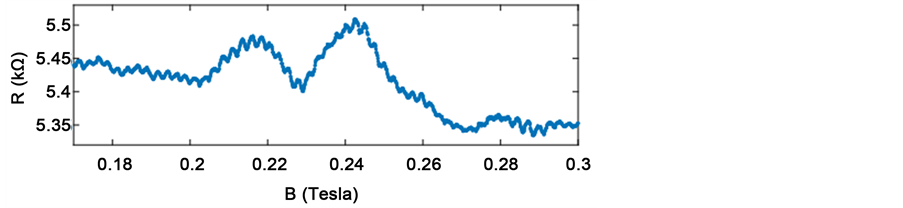 (b)
(b)
Figure 5. (Color online) (a): The magnetoresistance of an Aharonov-Bohm ring at 1.5 K, as a function of the magnetic field, up to  Tesla; (b) The magnified data in the low-field region, showing the tiny oscillations superimposed on the Aharonov-Bohm ones.
 (a)
(a)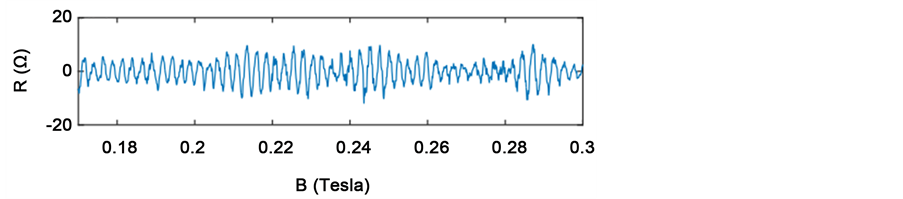 (b)
(b)
Figure 6. (Color online) (a) and (b) The data shown in Figure 5(a) and Figure 5(b), once the low-frequency data points are filtered out.
magnetic fields has been chosen because it contains mainly an amplitude of only a “single” harmonic. According to Ref. [11] , the amplitude of the  oscillation in the conductance,
  , is
, is
 (8)
(8)
where  is the radius of the ring and
  is the diffusion coefficient.
 (a)
(a)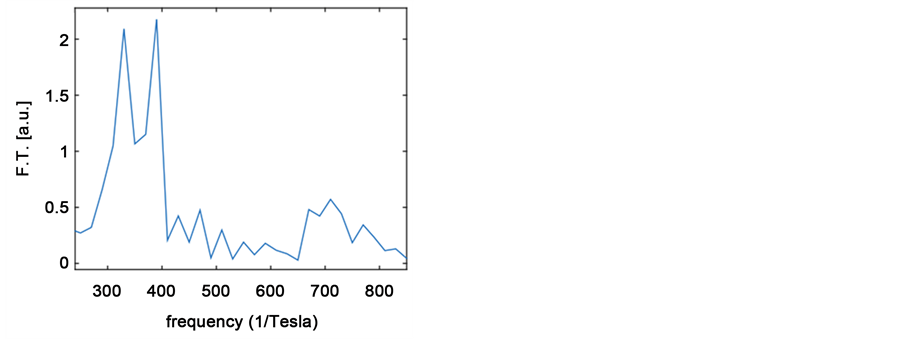 (b)
(b)
Figure 7. (Color online) (a) The Fourier transform of the magnetoresistance for magnetic fields in the range 0.1 - 0.15 Tesla; the main peak is at  Tesla−1; (b) The Fourier transform of the magnetoresistance for magnetic fields in the range 0.65 - 0.7 Tesla, where the peaks are at
  Tesla−1 and
  Tesla−1.
3.4. The Dephasing Rate
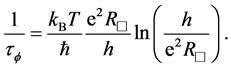
The dephasing rate of the electrons,  , due to electron-electron interactions was calculated by Altshuler et al. [35] ; it is linearly proportional to the temperature and to the sheet resistance,
  , of the sample,
 (9)
(9)
It is related to the coherence length by
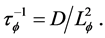 (10)
(10)
Using the diffusion coefficient,  , from the Einstein relation,
  , we obtain the inverse of the dephasing length squared,
  , in the form
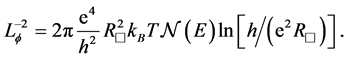 (11)
(11)
The two-dimensional electronic density of states,  , can be calculated, by taking the effective mass of electrons in Ga0.25In0.75As to be
 .
.
The symbols in Figure 8 mark the values of the inverse of the dephasing length squared, as extracted from our experiments. Had the sheet resistance been identical for all samples, all the points would have fallen on a straight line. However, since the widths of the samples fabricated for the UCF and the AB measurements were narrower than those for the WL ones, the sheet resistance is expected to be higher [36] and therefore the slopes in Figure 8 are steeper. Note that the values of the sheet resistances which can be calculated from the density of electrons and their mobility quoted in this paper would have produced much lower values than those quoted in the caption. In addition to a certain numerical uncertainty in the theoretical expression (11), we believe that the main reason for the discrepancy seen in Figure 8 between the slopes and the measured values arises from parallel conduction as mentioned above.
4. The Beating Patterns in the Magnetoconductance of the Rings
The combined effect of strong spin-orbit and Zeeman interactions, in the adiabatic limit, is expected to induce a Berry phase on the spin part of the electronic wave function. The possibility that this geometrical phase can be detected in power spectra of the magnetoconductance oscillations of mesoscopic rings has been pursued quite actively, both theoretically and experimentally (see Section 1 for a brief survey). An interesting (theoretical) observation has been made in Ref. [18] . Carrying out numeri- cally a rather complicate calculation of the AB oscillations and the corresponding power spectrum (computed by zero-padding the data before applying the Fourier transform code), the authors found that the peak splitting in diffusive rings depends strongly on the different dephasing sources, and that for small dephasing the splitting is totally masked.
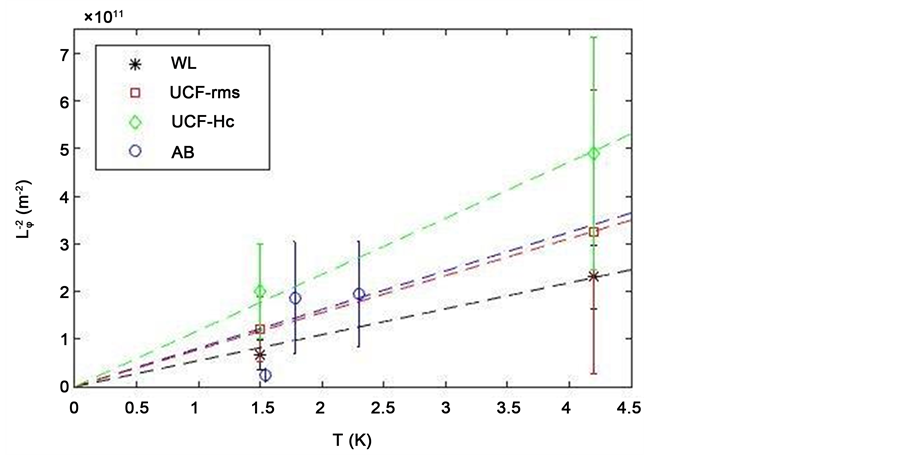
Figure 8. (Color online) The inverse dephasing length squared, extracted from all three experiments, as a function of the temperature. The lines represent the theoretical expression, Equation (11), with the following sheet-resistance values:  for the lowest curve (black);
  for the two middle lines (blue and red); and
  for the top line (green).
Our data are not sufficient to examine this observation. We have therefore analyzed the simpler expression given in Ref. [16] for the transmission  of a clean Aharonov- Bohm ring1 subjected to strong spin-orbit and Zeeman interactions,
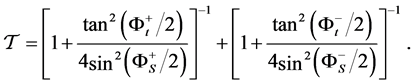 (12)
(12)
This expression is valid in the adiabatic limit, pertaining to the case where, as mentioned in Section 1, both  and
and  are larger than the rotation frequency around the ring,
  [16] . This condition is fulfilled by our rings, whether the rotation frequency is calculated in the clean limit,
  , leading to
 , or in the diffusive limit,
  , in which case
 . The trans- mission
  is given in terms of two phases, each of which is different for the two spin orientations. The phase
  comprises the Aharonov-Bohm phase and the Berry phase,
  ,
,
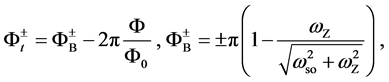 (13)
(13)
where  is the magnetic flux through the ring. With our experimental parameters,
  , where
  is measured Tesla. The other phase,
  (termed “stand- ard” in Ref. [16] ), is in fact the optical path along the ring perimeter; it is different for each spin direction since the Zeeman energy modifies the Fermi energy of each spin. This phase is given by
 (14)
(14)
where  are the solutions of
 (15)
(15)
The effective electron mass  in our samples is
  times the free-electron mass, and the Fermi energy
 . Solving Equation (15) yields
 (16)
(16)
For our samples’ parameters , while
  becomes comparable to
  at about
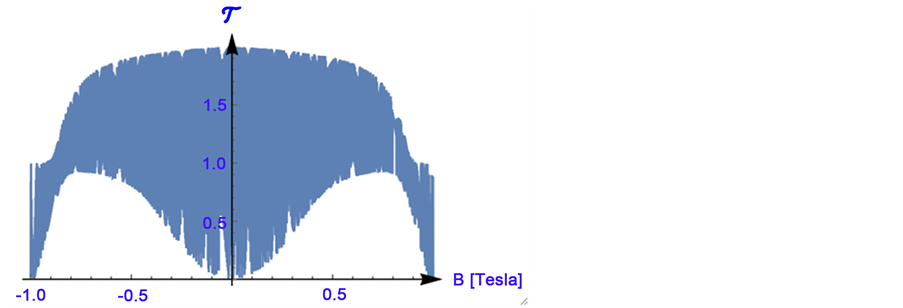
  Tesla. The transmission as a function of the magnetic field as derived from Equation (12) is illustrated in Figure 9 (the parameters use are those quoted in Section 1 and above).
The two panels in Figure 9 display the transmission for two different ranges of the magnetic field. Both show an envelope of the AB oscillations, which varies slowly. Figure 9(a) clearly exhibits beats, superimposed on fast AB oscillations. From Equation
 (a)
(a)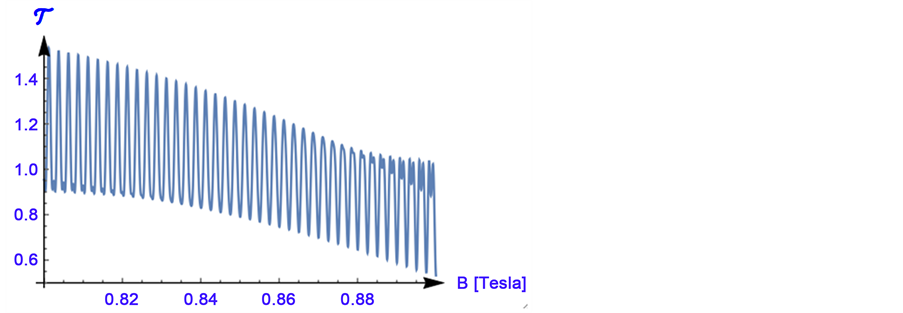 (b)
(b)
Figure 9. (Color online) The transmission, Equation (12), as a function of the magnetic field over a wider range of fields (a) and over a restricted range (b). The parameters are given in Sections 1 and 4.
(13), the Berry phase is of order , and the AB phase is of order
  (
( in Tesla). Therefore, the Berry phase affects the results only for
  Tesla, and it is practically irrelevant for the interpretation of our data. Equation (12) shows that the modulations of the AB oscillations, which result from the factors
 , are modified by the prefactors
 , which create beats due to the dependence of
  on
on . At
. At , Equations (14)-(16) yield
  (
( in Tesla). Then the transmission given in Equation (12) should exhibit beats at a very small frequency of order 2.7 Tesla−1. In our samples
 , and then the two functions
  are appro- ximately parabolic in
  (for small
 ), with slopes that increase with
 . Specifi-
cally, one has 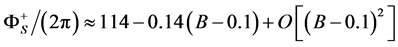 and
and 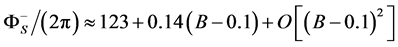 near
near  Tesla, while
 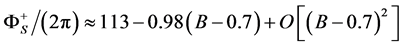 and
and
 near
near  Tesla. The correspond
ing beats have even smaller frequencies, of order 0.14 Tesla−1 and 1 Tesla−1, respectively. These frequencies seem consistent with the envelopes of the fast oscillations in Figure 9. Although the theory exhibits a slow decrease of the average frequency, and a gradual increase of the beating frequencies, similar to the experimental observations, all of these theoretical beat frequencies are much smaller than those seen in the experiments. Fourier transforms of the data in Figure 9 (with or without zero-padding) indeed yield single peaks at the first harmonic of the AB oscillations, somewhat broadened by the Zeeman contributions. Higher harmonics do show small splittings of the peaks.
5. Summary
We have measured weak antilocalization effects, universal conductance fluctuations, and Aharonov-Bohm oscillations in the two-dimensional electron gas formed in InGaAs/ AlInAs heterostructures. This system possesses strong spin-orbit coupling and a high Landé factor. Phase-coherence lengths of  at
at  were extracted from the magnetoconductance measurements. The analysis of the coherence-sensitive data reveals that the temperature dependence of the decoherence rate complies with the dephasing mechanism originating from electron-electron interactions in all three ex- periments.
Distinct beating patterns superimposed on the Aharonov-Bohm oscillations are ob- served over a wide range of magnetic fields, up to 0.7 Tesla at the relatively high tem- perature of 1.5 K. The Berry phase is much smaller than the AB phase, and therefore cannot be responsible for these beats. Qualitatively, the theory of Aronov and Lyanda- Geller [16] does exhibit beats due to the interplay between the Zeeman and the spin- orbit interactions. However, the beating frequencies found in this theory are much smaller than those observed experimentally. It thus seems that the source of the beating pattern in the magnetoconductance of our rings is the different electronic paths through the ring, each penetrated by a slightly different magnetic flux [28] . For example, since the AB frequencies are proportional to the area encompassed by the electronic paths, the measured ratio of the two frequencies in Figure 7(b), i.e.,  , implies a radii ratio of about 1.1. The width of our rings (see Figure 2) can easily accommodate two paths with such a radii ratio, and hence may explain the beating pattern.
Acknowledgements
We thank Y. Lyanda-Geller for very useful comments. This work was partially support- ed by the Israeli Science Foundation (ISF) grant 532/12 and grant 252/11, and by the infrastructure program of Israel Ministry of Science and Technology under contract 3-11173.
Cite this paper
Tzarfati, L.H., Hevroni, R., Aharony, A., Entin-Wohlman, O., Karpovski, M., Shelukhin, V., Umansky, V. and Palevski, A. (2017) Dephasing Mea- surements in InGaAs/AlInAs Heterostructures: Manifestations of Spin-Orbit and Zee- man Interactions. Journal of Modern Physics, 8, 110-125. http://dx.doi.org/10.4236/jmp.2017.81010
References
- 1. Fert, A. (2008) Reviews of Modern Physics, 80, 1517.
https://doi.org/10.1103/RevModPhys.80.1517 - 2. Wolf, S.A., Awschalom, D.D., Buhrman, R.A., Daughton, J.M., von Molnár, S., Roukes, M.L., Chtchelkanova, A.Y. and Treger, D.M. (2001) Science, 294, 1488.
https://doi.org/10.1126/science.1065389 - 3. Zutić, I., Fabian, J. and Das Sarma, S. (2004) Reviews of Modern Physics, 76, 323.
https://doi.org/10.1103/RevModPhys.76.323 - 4. Bratkovsky, A.M. (2008) Reports on Progress in Physics, 71, 026502.
https://doi.org/10.1088/0034-4885/71/2/026502 - 5. Altshuler, B.L., Aronov, A.G. and Khmel’nitskii, D.E. (1982) Journal of Physics C, 15, 7367.
- 6. Hikami, S., Larkin, A.I. and Nagaoka, Y. (1980) Progress of Theoretical Physics, 63, 707.
https://doi.org/10.1143/PTP.63.707 - 7. Maekawa, S. and Fukuyama, H. (1981) Journal of the Physical Society of Japan, 50, 2516.
https://doi.org/10.1143/JPSJ.50.2516 - 8. Lee, P.A., Stone, A.D. and Fukuyama, H. (1987) Physical Review B, 35, 1039.
https://doi.org/10.1103/PhysRevB.35.1039 - 9. Aharonov, Y. and Bohm, D. (1959) Physical Review, 115, 485.
https://doi.org/10.1103/PhysRev.115.485 - 10. Washburn, S. and Webb, R.A. (1986) Advances in Physics, 35, 375.
https://doi.org/10.1080/00018738600101921 - 11. Milliken, P., Washburn, S., Umbach, C.P., Laibowitz, R.B. and Webb, R.A. (1987) Physical Review B, 36, 4465.
https://doi.org/10.1103/PhysRevB.36.4465 - 12. Bychkov, Y.A. and Rashba, E.I. (1984) Journal of Physics C, 17, 6039.
- 13. Winkler, R. (2003) Spin-Orbit Coupling Effects in Two-Dimensional Electron and Hole Systems. Springer-Verlag, Berlin.
https://doi.org/10.1007/b13586 - 14. Schäpres, T., Engels, E., Lange, J., Klocke, T., Hollfelder, M. and Lüth, H. (1998) Journal of Applied Physics, 83, 4324.
https://doi.org/10.1063/1.367192 - 15. Nitta, S., Choi, H. and Yamada, S. (2010) Physica E, 42, 987.
https://doi.org/10.1016/j.physe.2009.11.106 - 16. Aronov, A.G. and Lyanda-Geller, Y.B. (1993) Physical Review Letters, 70, 343.
- 17. Berry, M.V. (1984) Proceedings of The Royal Society A, 392, 45.
https://doi.org/10.1098/rspa.1984.0023 - 18. Engel, H.-A. and Loss, D. (2000) Physical Review B, 62, 10238.
https://doi.org/10.1103/PhysRevB.62.10238 - 19. Stern, A. (1992) Physical Review Letters, 68, 1022.
https://doi.org/10.1103/PhysRevLett.68.1022 - 20. Van Langen, S.A., Knops, H.P.A., Paasschens, J.C.J. and Beenakker, C.W.J. (1999) Physical Review B, 59, 2102.
https://doi.org/10.1103/PhysRevB.59.2102 - 21. Loss, D., Schoeller, H. and Goldbart, P.M. (1999) Physical Review B, 59, 13328.
https://doi.org/10.1103/PhysRevB.59.13328 - 22. Morpurgo, A.F., Heida, J.P., Klapwijk, T.M., van Wees, B.J., and Borghs, G. (1998) Physical Review Letters, 80, 1050.
https://doi.org/10.1103/PhysRevLett.80.1050 - 23. Yau, J.-B., De Poortere, E.P. and Shayegan, M. (2002) Physical Review Letters, 88, Article ID: 146801.
https://doi.org/10.1103/PhysRevLett.88.146801 - 24. Yang, M.J., Yang, C.H. and Lyanda-Geller, Y.B. (2004) Europhysics Letters, 66, 826.
https://doi.org/10.1209/epl/i2003-10263-3 - 25. Grbić, B., Leturcq, R., Ihn, T., Ensslin, K., Reuter, D. and Wieck, A.D. (2007) Physical Review Letters, 99, Article ID: 176803.
https://doi.org/10.1103/PhysRevLett.99.176803 - 26. Meijer, F.E., Morpurgo, A.F., Klapwijk, T.M., Koga, T. and Nitta, J. (2004) Physical Review B, 69, Article ID: 035308.
https://doi.org/10.1103/PhysRevB.69.035308 - 27. Ren, S.L., Heremans, J.J., Gaspe, C.K., Vijeyaragunathan, S., Mishima, T.D. and Santos, M.B. (2013) Journal of Physics: Condensed Matter, 25, Article ID: 435301.
https://doi.org/10.1088/0953-8984/25/43/435301 - 28. Aharony, A., Entin-Wohlman, O., Otsuka, T., Katsumoto, S., Aikawa, H. and Kobayashi, K. (2006) Physical Review B, 73, Article ID: 195329.
https://doi.org/10.1103/PhysRevB.73.195329 - 29. Zeng, Y., Cao, X., Cui, L., Kong, M., Pan, L., Wang, B. and Zhu, Z. (2001) Journal of Crystal Growth, 210, Article ID: 227228.
- 30. Hoke, W.E., Kennedy, T.D., Torabi, A., Whelan, C.S., Marsh, P.F., Leoni, R.E., Xu, C. and Hsieh, K.C. (2003) Journal of Crystal Growth, 251, 827.
https://doi.org/10.1016/S0022-0248(02)02373-4 - 31. Iordanskii, S.V., Lyanda-Geller, Y.B. and Pikus, G.E. (1994) JETP Letters, 60, 199-206.
- 32. Knap, W., Skierbiszewski, C., Zduniak, A., Litwin-Staszewska, E., Bertho, D., Kobbi, F., Robert, J.L., Pikus, G.E., Pikus, F.G., Iordanskii, S.V., Mosser, V., Zekentes, K. and Lyanda-Geller, Y.B. (1996) Physical Review B, 53, 3912.
https://doi.org/10.1103/PhysRevB.53.3912 - 33. Beenakker, C.W.J. and van Houten, H. (1991) Solid State Physics, 44, 1.
https://doi.org/10.1016/S0081-1947(08)60091-0 - 34. Chandrasekhar, V., Santhanam, P. and Prober, D.E. (1990) Physical Review B, 42, 6823.
https://doi.org/10.1103/PhysRevB.42.6823 - 35. Altshuler, B.L., Khmel’nitskii, D., Larkin, A.I. and Lee, P.A. (1980) Physical Review B, 22, 5142.
https://doi.org/10.1103/PhysRevB.22.5142 - 36. Beenakker, C.W.J. and van Houten, H. (1988) Physical Review B, 38, 3232.
https://doi.org/10.1103/PhysRevB.38.3232
NOTES

1Reference [24] gives another expression for the transmission. The setup considered in that paper is however, different from ours.