Applied Mathematics
Vol.4 No.5(2013), Article ID:31454,3 pages DOI:10.4236/am.2013.45111
Mathematical Tools of Cluster Analysis*
Department of Industrial Engineering and Management, Technical University of Košice, Košice, Slovakia
Email: peter.trebuna@tuke.sk, jana.halcinova@tuke.sk
Copyright © 2013 Peter Trebuňa, Jana Halčinová. This is an open access article distributed under the Creative Commons Attribution License, which permits unrestricted use, distribution, and reproduction in any medium, provided the original work is properly cited.
Received March 1, 2013; revised April 5, 2013; accepted April 12, 2013
Keywords: Cluster Analysis; Hierarchical Cluster Analysis Methods; Non-Hierarchical Cluster Analysis Methods
ABSTRACT
The paper deals with cluster analysis and comparison of clustering methods. Cluster analysis belongs to multivariate statistical methods. Cluster analysis is defined as general logical technique, procedure, which allows clustering variable objects into groups-clusters on the basis of similarity or dissimilarity. Cluster analysis involves computational procedures, of which purpose is to reduce a set of data on several relatively homogenous groups-clusters, while the condition of reduction is maximal and simultaneously minimal similarity of clusters. Similarity of objects is studied by the degree of similarity (correlation coefficient and association coefficient) or the degree of dissimilarity-degree of distance (distance coefficient). Methods of cluster analysis are on the basis of clustering classified as hierarchical or non-hierarchical methods.
1. Introduction
“Cluster analysis is a general logic process, formulated as a procedure by which groups together objects into groups based on their similarities and differences.” [1]
Having a data matrix X type n × p, where n is the number of objects and p is the number of variables (features, characteristics). Next there is a decomposition S(k) of set n objects to k certain groups (clusters), i.e.
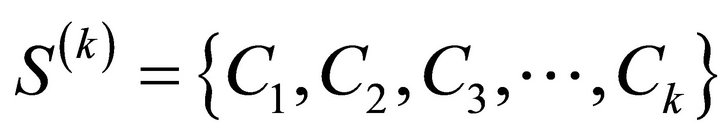 , [2]:
 comprises all the space.
If that set of objects  and any dissimilarity coefficient of objects D, then a cluster is called a subset of p sets of objects o to which it applies [2]:

where  and
and . This means that the maximum distance of objects belonging to the cluster must always be less than the minimum distance any object from the cluster and object outside cluster.
The input for the clustering of the input data matrix and output are specific identification of clusters. The input matrix X of size n × p contains the i-th row of characters xij object Ai, where  and
and . Therefore
 .
.
2. Cluster Analysis Methods
Classification of cluster analysis methods is shown in Figure 1.
2.1. Hierarchical Cluster Analysis Methods
Hierarchical cluster analysis methods included of the analyzed objects into a hierarchical system of clusters. This system is defined as a system of mutually distinct non-empty subsets of the original set of objects. The main characteristic of hierarchical methods of cluster analysis is creating a decomposition of the original set of objects, in which each of the partial decomposition refines next or previous decomposition.
According to the way of creating decompositions (Figure 2) the hierarchical clustering methods are divided into several groups:
• Agglomerative clustering—at the beginning of clustering are considered individual objects as separate

Figure 1. Classification of cluster analysis methods.
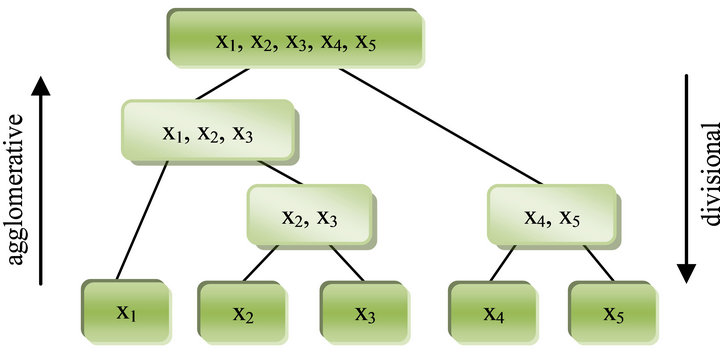
Figure 2. Principle of the agglomerative hierarchical cluster analysis methods.
clusters. The next steps will then be the most similar clusters combine into larger clusters until the specified criteria of quality decomposition is fulfilled.
• Divisional clustering—at the beginning of the clustering process all objects are in one cluster. This cluster is then divided into smaller clusters.
Agglomerative hierarchical clustering methods assign to set of objects O the sequence of its decomposition  to clusters and hereby the real nonnegative number
  is assigned to each cluster
 .
.
1) The decomposition of the set of objects  are its individual objects, i.e., single element clusters whereby the number
  for
for  belongs to each single element cluster
 .
.
2) There is a decomposition  and the numbers
  for
for  are assigned to clusters. A pair of cluster which has the minimal dissimilarity of coefficient D is chosen, it means, they are the most similar. These clusters are combined to form one cluster. Other clusters stay unchanged and they pass to next decomposition.
2.1.1. Simple Linkage Method
The simple linkage method can be defined as follows: if D is a random coefficient of dissimilarity, symbols C1, C2 are two different clusters, Ai object belongs to a cluster C1 and object Aj belongs to cluster C2 then
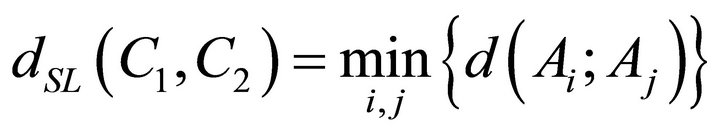
determines the distance of clusters for the Simple linkage method [3].
2.1.2. Complete Linkage Method
The complete linkage method is a dual method to the simple linkage method its principle is following [3]:
If D is a random coefficient of dissimilarity, symbols C1, C2 are two different clusters, Ai object belongs to a cluster C1 and object Aj belongs to cluster C2 then

determines the distance of clusters for the complete linkage method.
2.1.3. Average Linkage Method
The distance between the clusters for the average linkage method is defined as follows [3]:
If D is a random coefficient of dissimilarity, symbols C1, C2 are two different clusters, Ai object belongs to a cluster C1 and object Aj belongs to cluster C2 then
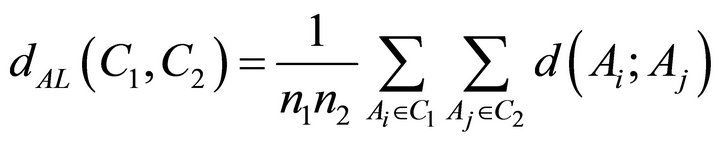
determines the distance of clusters for the average linkage method, where n1 and n2 are the number of objects in clusters C1 and C2.
2.1.4. Centroid’s Method
In Centroid’s method the dissimilarity of 2 clusters is expressed as the distance of centroids of these clusters. Each cluster is represented by the average of its elements, which is called the centroid. The distance between clusters is determined by the Lance-William correlation:

where n1, n2 and n3 are the number of objects in clusters C1, C2 and C3.
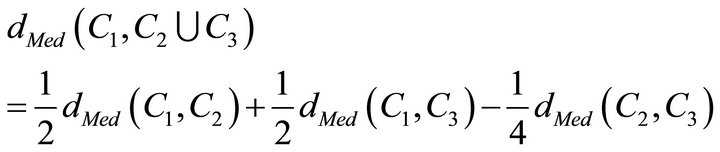
2.1.5. The Median Method
If the size of the clusters is different, the centroid of new cluster may lie within a larger cluster or near the larger cluster. The median method tries to reduce this deficiency in that way that it does not reflect the size of clusters, but it reflects its average. The distance between newly-formed clusters and other clusters is calculated by equation [3]:
2.1.6. Ward’s Method
Ward’s method is also marked as a method of minimizing the increases of errors of sum squares. It is based on optimizing the homogeneity of clusters according to certain criteria, which is minimizing the increase of errors of sum squares of deviation points from centroid. This is the reason why this method is different from previous methods of hierarchical clustering, which are based on optimization of the distance between clusters [4].
The loss of information is determined at each level of clustering, which is expressed as the increase of total sum of aberrance square of each cluster point from the average ESS value. Then it comes to a connection of clusters where there is a minimal increase in the errors of sum of squares [5].
The accruement of ESS function is calculated according to [5]:
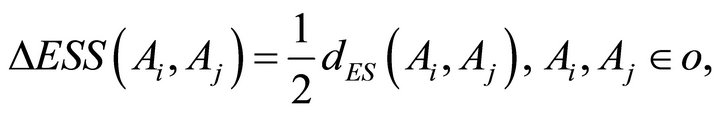
where .
.
2.2. Non-Hierarchical Cluster Analysis Methods
For non-hierarchical cluster analysis methods is the typical classification of objects into a predetermined number of disjunctive clusters. These clustering methods can be divided into 2 groups [6]:
• Hard clustering methods—assignment an object to a cluster is clear;
• Fuzzy cluster analysis—it calculates the rate of relevancy of objects to clusters.
3. Conclusion
In recent years, many companies, institutions and organizations collect a full range of database. The process of accumulation of data has an explosive character, that it’s why it is important to find one’s way in these data and extract some relevant information. The importance of clustering methods increases for that reason.
REFERENCES
- M. Palumbo, C. N. Lauro and M. J. Greenacre, “Data Analysis and Classification,” Springer, Berlin, 2010, p. 505. doi:10.1007/978-3-642-03739-9
- L. Kaufmann, “Finding Groups in Data: An Introduction in Cluster Analysis,” Wiley, Hoboken, 2005, p. 342.
- B. S. Everitt, S. Landau, M. Leese and D. Stahl, “Cluster Analysis,” Wiley, London, 2011, p. 348.
- J. Bacher, A. Poge and K. Wenzig, “Clusteranalyse— Anwendungsorientierte Einfuhrung in Klassifikationsverfahren,” Oldenbourg, Munchen, 2010, p. 432. doi:10.1524/9783486710236
- J. Han and M. Kamber, “Data Mining—Concepts and Techniques,” MK Publisher, San Francisco, 2006, p. 772.
- P. Trebuňa and J. Halčinová, “Experimental Modelling of the Cluster Analysis Processes,” Procedia Engineering, Vol. 48. 2012, pp. 673-678. doi:10.1016/j.proeng.2012.09.569
NOTES
*This article was created by implementation of the grant project VEGA no. 1/0102/11 Experimental methods and modeling techniques in-house manufacturing and non-manufacturing processes.