Applied Mathematics
Vol.3 No.10A(2012), Article ID:24098,8 pages DOI:10.4236/am.2012.330186
Optimization of Osmotic Drying Parameters for Button Mushroom (Agaricus bisporus)
Department of Processing and Food Engineering, College of Technology and Engineering, Maharana Pratap University of Agriculture and Technology, Udaipur, India
Email: sanjaykjain16@hotmail.com,sanjaykumarjain16@gmail.com
Received June 20, 2012; revised October 8, 2012; accepted October 15, 2012
Keywords: Button Mushroom; Osmotic Dehydration; Optimization; Response Surface Methodology; Water Loss; Salt Gain
ABSTRACT
Response surface methodology was used to investigate the effect of brine concentration (10% - 20%) solution temperature (35˚C - 55˚C), and duration of osmosis (30 - 60 min) with respect to water loss (WL) and salt gain (SG). The solution to sample ratio of 5/1 (w/w) was used. The Box-Behnken design of three variables and three levels including seventeen experiments formed by five central points were used for optimizing input parameters. Linear, quadratic and interaction effects of three variables were analyzed with respect to water loss and solid gain. For each response, second order polynomial models were developed using multiple regression analysis. Analysis of variance (ANOVA) was performed to check the adequacy and accuracy of the fitted models. The response surfaces and contour maps showing the interaction of process variables were constructed. The optimum operating conditions were: solution temperature 44.89˚C, brine concentration of 16.53 per cent and duration of osmosis of 47.59 min. At this optimum point, water loss and salt gain were predicted to be 44.55 per cent and 2.98 per cent respectively.
1. Introduction
Mushroom cultivation is of recent origin in India. Its production has tremendous scope as an income generating activity. It requires little space or land, hence it is of great importance for landless and marginal farmers. Mushrooms can be treated as a healthy and nutritive food, supplying good amount of protein, minerals and vitamins. They are recommended as alternative source of proteins for bringing the protein malnutrition gap in the developing countries of the world [1]. Besides their nutritive value, mushrooms also exhibit certain medicinal properties. They have traditionally been used for medicinal and tonic properties for treating hepatitis and other diseases of liver and for promoting longevity and cosmetic products such as skin whitening agent. Compounds extracted from white button mushroom have been reported to have anti-fungal and anti-bacterial properties. The high proteins, sterols, macro-elements and low calorie content (i.e. low fat, starch and sugar) make mushroom ideal for prevention of cardiovascular diseases. Thus, they are an ideal food for patients, old people, pregnant ladies and children. Therapeutic properties of mushroom include enhancement of macrophase function and host resistance to many bacterial, viral, fungal and parasitic infections, activation of non-specific immune stimulation and reduction of blood cholesterol and glucose levels.
The production of mushroom in our country is increasing at fast rate from 4000 tonnes in 1985-1986 to 120,000 tonnes in 2009 [2]. The world’s largest button mushroom growing unit is located in India (Punjab). Punjab alone produces about 32 per cent mushrooms out of the total production in India. Unfortunately, mushrooms are highly perishable commodities in nature due to its high moisture content and they start deteriorating immediately within a day after harvest due to microbial, enzymatic and chemical reactions.
Thus, it is very important to evolve a better method of preservation for increasing the shelf life besides maintaining the quality of button mushroom and this can be achieved by some type of processing e.g. heating, dehydration. The main purpose of drying products is to allow longer periods of storage, minimize packaging requirements and reduce shipping weights.
Osmotic dehydration is widely used to remove part of the water content of fruit to obtain a product of intermediate moisture or as a pre-treatment before further processing [3]. Osmotic dehydration is also used to treat fresh produce before further drying to improve sensory, functional and even nutritional properties. The shelf life quality of the final product is better than without such treatment due to the increase in sugar/acid ratio, the improvement in texture and the stability of the colour pigment during storage. Osmotic dehydration combined with other drying technologies provides an opportunity to produce novel shelf stable types of high quality products for the local as well as export market.
Response surface methodology (RSM) is a statistical procedure frequently used for optimization studies. It uses quantitative data from an appropriate experimental design to determine and simultaneously solve multivariate problems. Equations describe the effect of test variables on responses, determine interrelationships among test variables and represent the combined effect of all test variables in any response. This approach enables an experimenter to make efficient exploration of a process or system. Therefore, RSM has been frequently used in the optimization of food processes [4].
Limited efforts have so far been made to process button mushroom into dehydrated product. An expanding interest currently exists for osmo-convective dehydrated mushroom in the domestic and world market. No attempt has been made to optimize the osmotic process parameters for mushroom. The purpose of the present work was to study the effect of osmotic process parameters viz. brine temperature, salt concentration and duration of osmosis on water loss and solid gain and to optimize these parameters for developing higher quality finished product. The purposed model will be able to predict the moisture content, water loss and solid gain the mushroom slices during the experimental range of duration for various concentration and temperature of brine solution.
2. Materials and Methods
2.1. Sample and Solution Preparation
Mushroom of Agaricus bisporus variety, having about 87 - 91 per cent moisture content (wet basis), was procured on daily basis from All India Co-ordinated Research Project on Mushroom, Rajasthan College of Agriculture, Maharana Pratap University of Agriculture and Technology, Udaipur, Rajasthan. Freshly harvested, firm, dazzling white, mature mushrooms of uniform size were manually sorted and selected as the raw material for all the experiments. Mushrooms of uniform size were thoroughly washed under tap water to remove adhering impurities. They were then dried on a blotting paper, and then cut into 5 ± 0.5 mm thick slices with the help of sharp stainless steel knife. Common salt (Brand name Tata) used as an osmotic agent, was procured from the local market of Udaipur. The brine solution of desired concentration was prepared by dissolving the required quantity of salt (weight/volume) in tap water.
2.2. Osmotic Dehydration
In the process of osmotic dehydration, sample is placed in the hypertonic solution and due to concentration difference, water comes out from sample to solution. Simultaneously transports of solids take place from solution to sample and vice versa. The mass transport in terms of water loss, mass reduction and solid gain were studied as detailed below.
2.3. Calculation for Mass Transport Data for Osmotic Dehydration
Terminologies were defined first, for calculating mass transport data during osmotic dehydration [5] and same have been used for many food products by various researchers such as [6-9].
Water loss (WL)
Water loss is the net loss of water from food material on an initial mass basis.
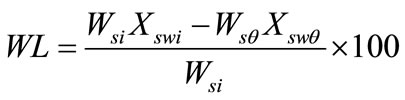 (1)
(1)
Mass reduction (WR)
Mass reduction is the net mass reduction of the food material on initial mass basis.
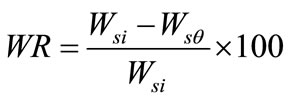 (2)
(2)
Solid gain (SG)
Solid gain is the net uptake of solids by food material on an initial mass basis.
 (3)
(3)
From Equations (1) and (2), the solid gain (SG) can be correlated with mass reduction (MR) and water loss (WL) as
 (4)
(4)
where, WL =water loss (g water per 100 g initial mass of sample);
WR = mass reduction (g mass per 100 g initial mass of sample);
SG = solid gain (g solids per 100 g initial mass of sample);
Wsi = initial mass of sample, g;
Wsθ = mass of the sample after time θ, g;
Xswi = water content as a fraction of the initial mass of the sample;
Xswθ = water content as a fraction of the brine at time θ.
2.4. Experimental Design
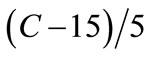
Box-Behnken design of three variables and three levels including seventeen experiments formed by five central points were used [9]. This design fulfilled almost all requirements needed for optimization of the osmotic dehydration process prior to convective drying. The osmotic dehydration was assumed to be affected mainly by three independent variables (factors), viz., brine temperature (T) (35˚C, 45˚C and 55˚C), salt concentration (C) (10%, 15% and 20%) and duration of osmosis (θ) (30, 45 and 60 min). All these variables were closely controlled and accurately measured during experimentation.
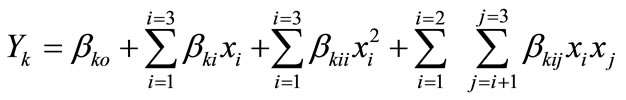
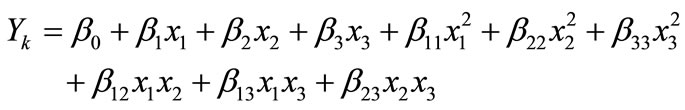
The exact mathematical representation of the function (f) is either unknown or extremely complex. However, second order polynomial equation of the following form was assumed to relate the response, Yk and the factors, ri as
 (5)
(5)
where, Yk is response (i.e. water loss or salt gain) βko, βki, βkii, and βkij are constant coefficients and xi and xj are the coded independent variables that are linearly related to T, C and θ. In practice, the levels of the independent variables change from one application to another. Therefore, the general designs are given in terms of standardized coded variables (xi), which in any particular application are linearly related to ri by the following equation:
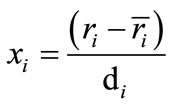 (6)
(6)
where, ri = actual value in original units,
 = mean of high and low levels of ri;
di = spacing between low and high levels of ri.
In present study, n = 2 and m = 3 and hence Equation (6) can be written as
 (7)
(7)
where, T = brine temperature in ˚C, C = salt concentration in %, θ = duration of osmosis in min, Yk = water loss or salt gain in per cent, in osmotic dehydration of mushroom slices. Hence, Equation (7) takes the following form as
 (8)
(8)
Response surface methodology (RSM) was applied to the experimental data using the package, design-expert version 8.0.6 software (Stat-Ease Inc, Minneapolis, USA).
3. Results and Discussion
The process parameters (brine concentration, solution temperature and duration of osmosis) were optimized for maximum water loss and optimum salt gain (2.98%). This optimum salt gain was decided by taking sensory evaluation of osmo-convectively dried mushroom samples having different salt gain levels. Values of various responses (water loss and salt gain) at different experimental combinations for coded variables are given in Table 1.
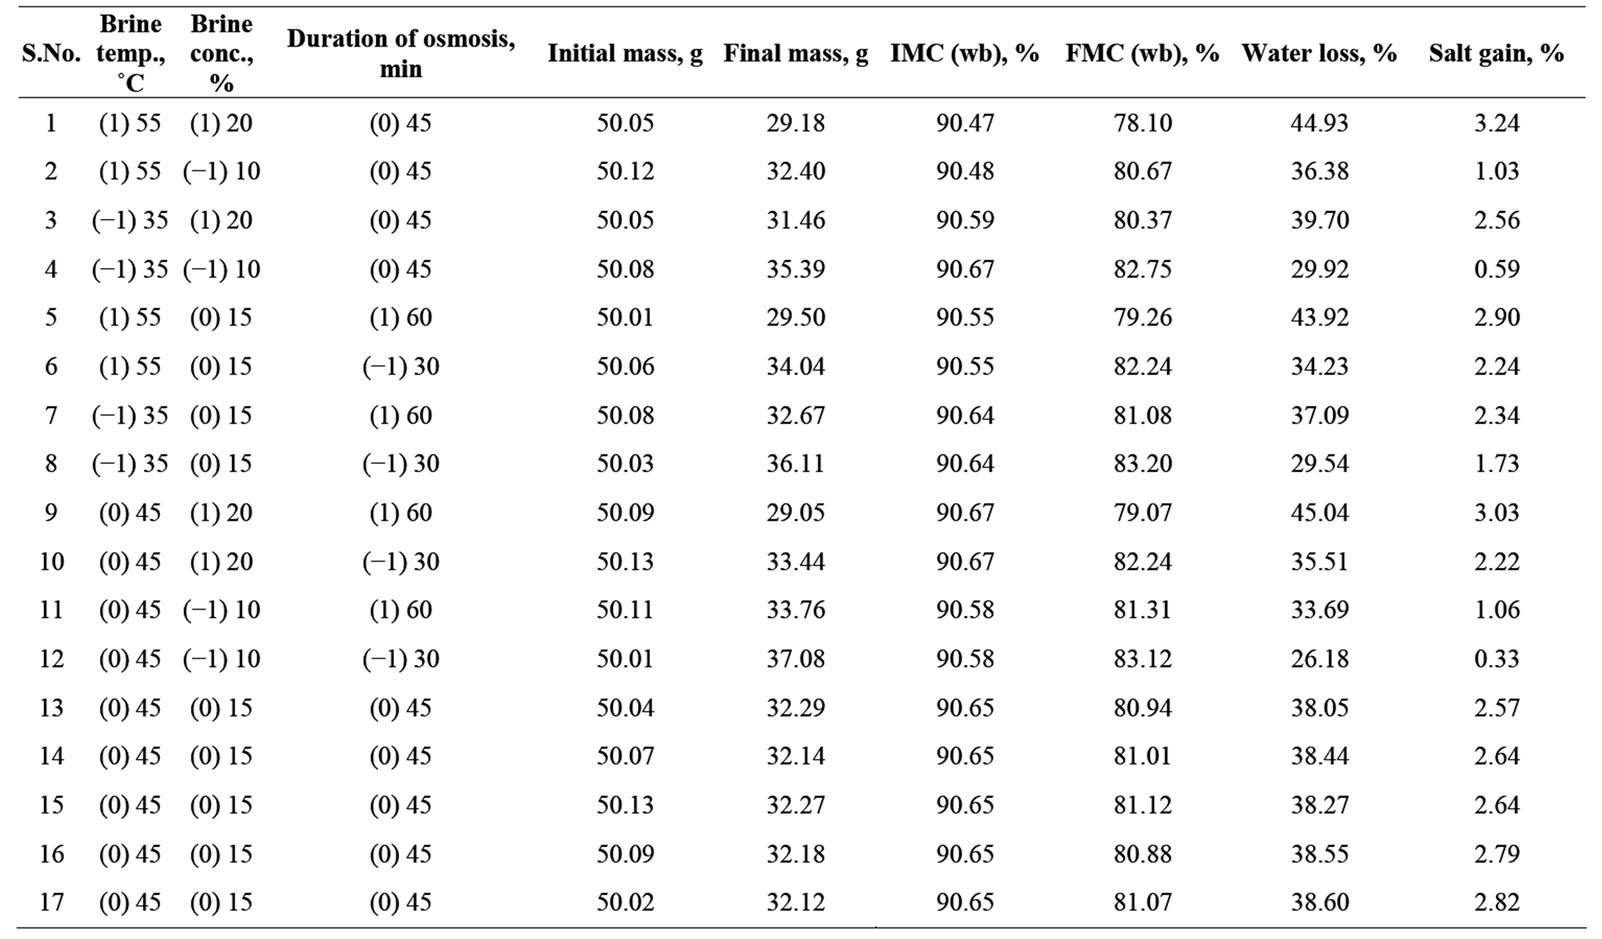
Table 1. Experimental data for three-variables and three levels response surface analysis.
3.1. Effect of Variables on Water Loss
The variation in water loss by changing brine temperature, concentration and osmosis duration has been presented in Table 1. A second order polynomial equation [Equation (8)] was fitted with the experimental data presented in Table 1. Equation (10) gives the predicted water loss, per cent as a function of brine temperature (x1), concentration (x2) and duration of osmosis (x3) expressed in coded form. This equation was obtained using stepdown regression method where factors with F-values less than one were rejected as described by researchers [10]. The data for water loss were analysed for stepwise regression analyses as shown in Table 2. The quadratic model was fitted to the experimental data and statistical significance for linear, quadratic and interaction terms was calculated for water loss as shown in Table 2. The R2 value was calculated by least square technique and found to be 0.997 showing good fit of model to the data. The model F value of 377.07 implies that the model is significant (P < 0.01). The linear terms (T, C and θ) are significant (P < 0.01). The “lack of fit F value” of 5.08 was not significant which indicates that the developed model was adequate for predicting the response. Moreover the predicted R2 of 0.983 was in reasonable agreement with adjusted R2 of 0.995. Therefore this model could be used to navigate the design space.
High value of coefficient of determination (R2 = 0.997) obtained for response variable indicated that the developed model for water loss accounted for and adequately explained 99.7 per cent of the total variation. The result of analysis of variance of Equation (9) indicated that the linear terms of brine temperature, concentration and duration of osmosis were highly significant at 5 per cent level (Table 2). The quadratic terms of concentration of brine and duration of osmosis were also highly signifycant at 5 per cent level while interaction terms of temperature of brine and duration of osmosis as well as concentration of brine and duration of osmosis were signifycant at 1 per cent level.
The comparative effect of each factor on water loss was observed by the F values in the ANOVA (Table 2) and also by the magnitudes of coefficients of the coded variables. The F values indicated that concentration of brine was the most influencing factor followed by duration of osmosis and temperature of brine was least effecttive over water loss. The regression equation describing the effects of process variables on water loss in terms of coded values of variable is given as
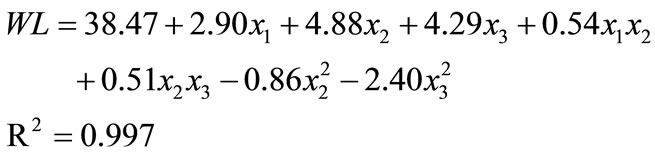 (9)
(9)
Replacing x1, x2 and x3 with ,
, 
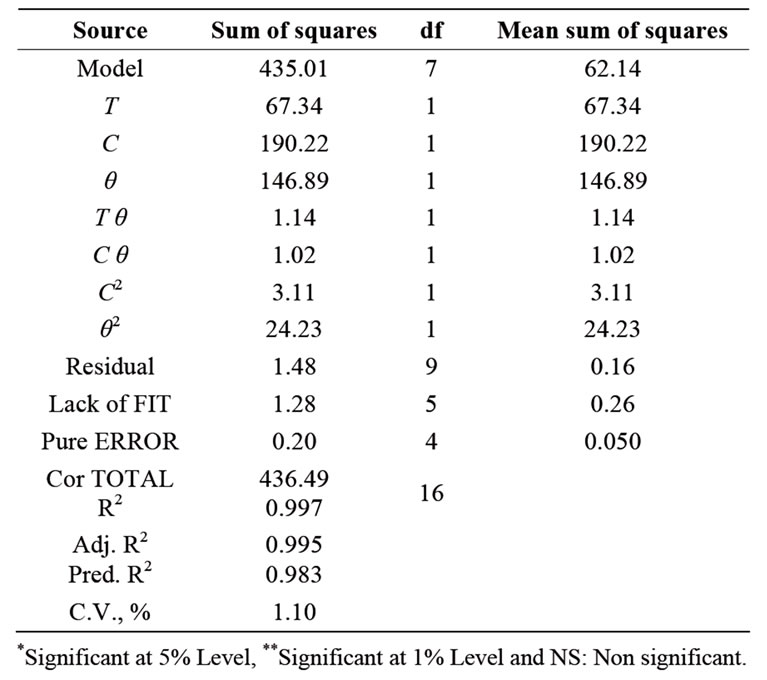
Table 2. Analysis of variance for water loss during osmotic dehydration of mushroom sample.
and  respectively in Equation (9), the water loss in real terms of brine temperature, concentration and duration of osmosis can be given by
 (10)
(10)
The linear positive terms [Equation (10)] indicated that water loss increased with increase in brine temperature, brine concentration and duration of osmosis. The presence of positive interaction terms between brine temperature and duration of osmosis as well as brine concentration and duration of osmosis indicated that increase in their levels increased water loss. The negative values of quadratic terms of brine concentration and duration of osmosis indicated that higher values of these variables further reduced water loss.
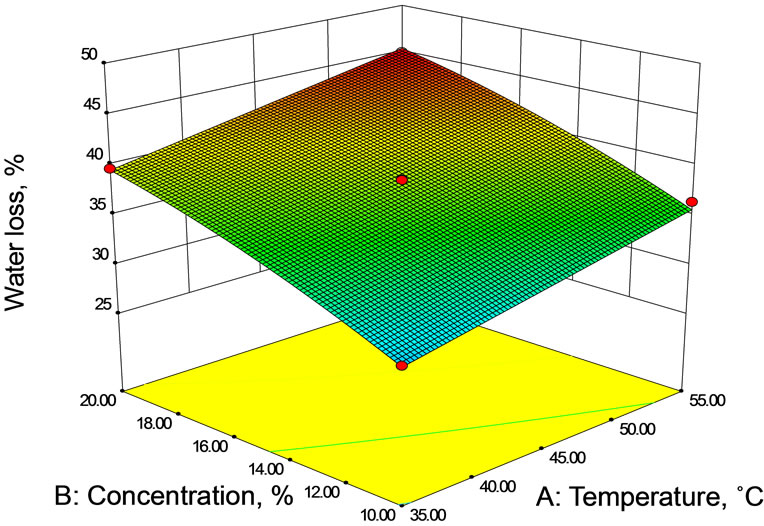
To visualize the combined effect of two variables on the water loss, the response surface and contour plots (Figures 1(a)-(c)) were generated for the fitted model as a function of two variables while keeping third variable at its central value. The water loss increased rapidly in the early stages of osmosis, after which the rate of water loss from mushroom sample into salt solution gradually slowed down with time. Rapid removal of water in early stages of osmosis has been reported for litchi [11], Aloe-vera [7,12], papaya [8], mushroom [13,14] etc.
Higher temperatures seem to promote faster water loss (Figures 1(a) and (b)) through swelling and plasticizing of cell membranes as well as the better water transfer characteristics on the product surface due to lower viscosity of the osmotic medium [12]. Water loss increased with concentration of salt (Figures 1(a) and (c)) as well as with duration of osmosis (Figure 1(b) and (c)) over
 (a) At 45 min duration of osmosis.
  (b) At 15% brine concentration.
 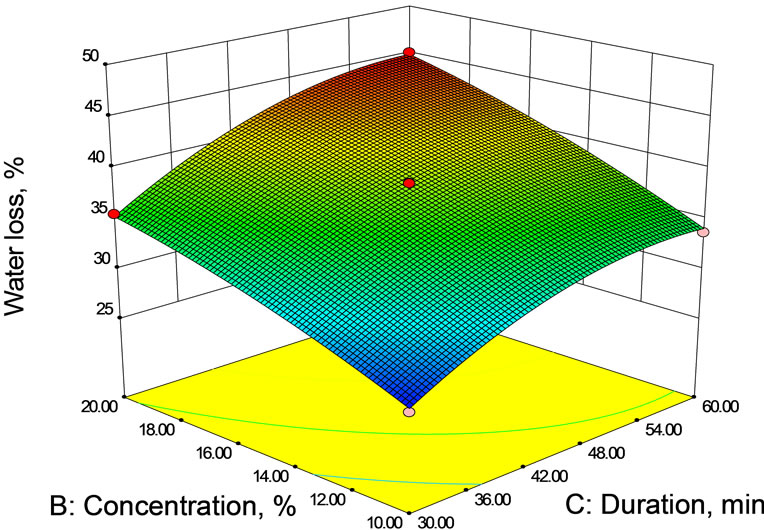 (c) At 45˚C brine temperature
Figure 1. Contour and Response surface showing the effect of temperature, concentration and duration on water loss during osmotic dehydration.
the entire osmotic dehydration process. In the osmosis of other fruits and vegetables, also such effect has been observed by various researchers [8,13,15,16].
3.2. Effect of Variables on Salt Gain
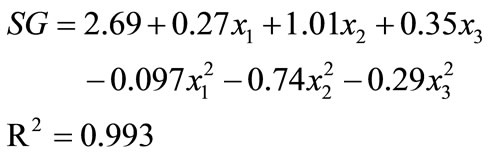
The salt gain during the osmotic dehydration was found to be dependent on the brine temperature, concentration and duration of osmosis (Table 1). A second order polynomial equation [Equation (8)] was fitted with the experimental data presented in Table 1. Equation (11) gives the predicted salt gain, per cent as a function of brine temperature (x1), concentration (x2) and duration of osmosis (x3) expressed in coded form. This equation was obtained using step-down regression method where factors with F-values less than one were rejected as described by researchers [10]. The data for salt gain were analyzed for stepwise regression analysis as shown in Table 3. The quadratic model was fitted to the experimental data and statistical significance for linear and quadratic terms was calculated for salt gain as shown in Table 3. The R2 value was calculated by least square technique and found to be 0.993 showing good fit of model to the data. The model F value of 245.41 implies that the model is significant (P < 0.01). The linear terms (T, C and θ) are significant (P < 0.01). The lack of fit was non significant, which indicates that the developed model was adequate for predicting the response. Moreover the predicted R2 of 0.982 was in reasonable agreement with adjusted R2 of 0.989. This revealed that the non-significant terms have not been included in the model. Therefore this model could be used to navigate the design space.
High value of coefficient of determination (R2 = 0.993) obtained for response variable indicated that the developed model for salt gain accounted for and adequately explained 99.3 per cent of the total variation. The result of analysis of variance indicated that the linear terms of brine temperature, concentration and duration of osmosis were highly significant at 5 per cent level (Table 3). The presence of quadratic terms of concentration of brine and
Table 3. Analysis of variance for salt gain during osmotic dehydration of mushroom sample.
duration of osmosis indicated curvilinear nature of response surface and were also highly significant at 5 percent level.
The comparative effect of each factor on salt gain could be observed by F values in the ANOVA (Table 3) and also by the magnitudes of the coded variables. The F values indicated that concentration of brine was the most influencing factor followed by duration of osmosis and temperature of brine was least effective over salt gain.
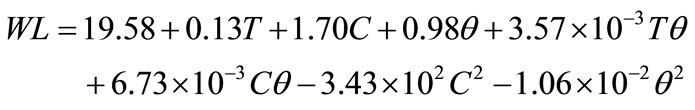
The regression equation describing the effects of process variables on salt gain in terms of coded values of variables is given as
 (11)
(11)
Replacing x1, x2 and x3 with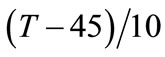 ,
,  and
and 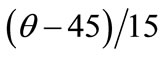 respectively [Equation (8)] in Equation (11), the salt gain in real terms of brine temperature, concentration and duration of osmosis is given by
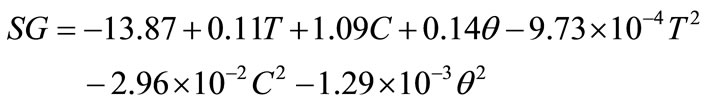 (12)
(12)
The linear positive terms [Equation (12)] indicated that salt gain increased with increase in brine temperature, concentration and duration of osmosis. The negative values of quadratic terms of temperature and concentration of brine and duration of osmosis indicated that higher values of these variables further reduced salt gain.
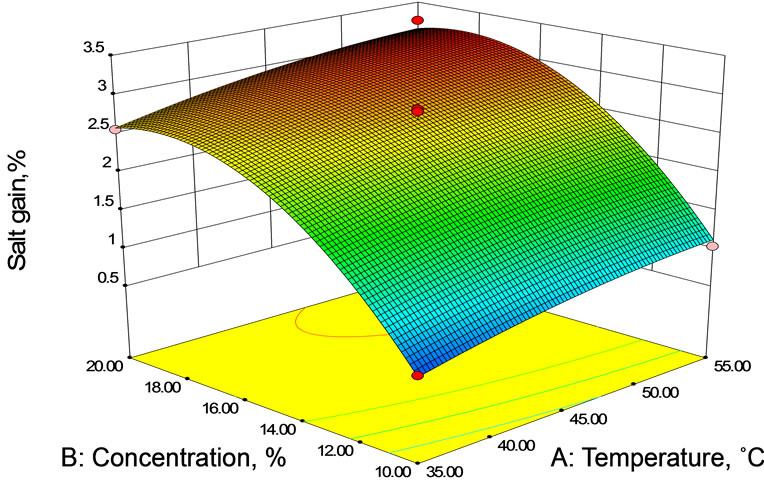
The response surface and contour plots (Figures 2(a)- (c)) were generated for the fitted model to visualize the combined effect of two variables on the salt gain, while keeping third variable at its central value. The salt gain increased rapidly in the early stages of osmosis after which the rate of salt gain from brine solution to mushroom sample slowed down with duration. The salt gain was found to increase with temperature (Figures 2(a) and (b)). As it was explained for water loss, temperature has an effect on the cell membrane permeability that could allow solute to enter by loosing its selectivity. Decrease of solution viscosity at higher temperature may influence salt gain due to fact that lower viscosity decreases the resistance to diffusion of solutes into the sample (food product) tissue. Increased concentration of the brine solution also led to increase in salt gain (Figures 2(a) and (c)) probably due to an increase of osmotic pressure gradient and consequent loss of functionality of cell plasmatic membrane that allows solute to enter.
It was observed from these figures (Figures 2 and 3) that the moisture loss as well as the solid gain increased non-linearly with time at all concentrations. Both moisture loss and solid gain were faster in the initial period of osmosis and then the rate decreased. This was because
 (a) At 45 min duration of osmosis.
 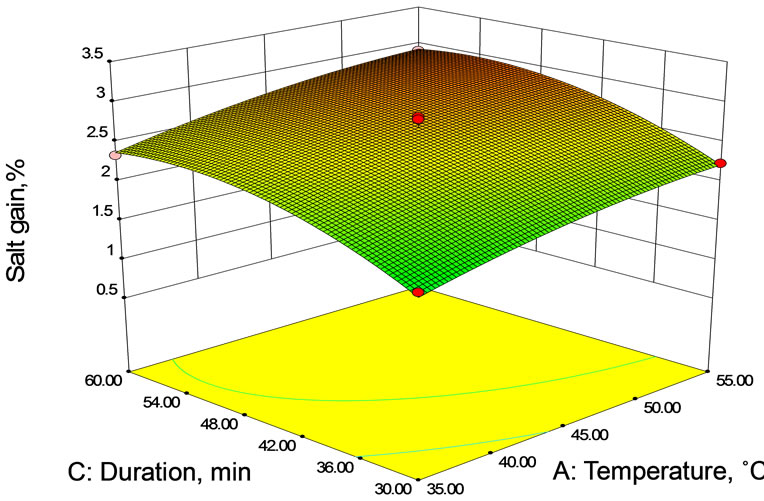 (b) AT 15% Brine Concentration.
  (c) At 45˚C brine temperature.
Figure 2. Contour and Response surface showing the effect of temperature, concentration and duration on salt gain during osmotic dehydration.
osmotic driving potential for moisture as well solid transfer will keep on decreasing with time as the moisture keeps moving from sample to solution and the solids from solution to sample. Further progressive solid uptake would result in the formation of high solid sub surface layer, which would interface with the concentration gradients across the sample solution interface and would set as barrier against removal of water and uptake of solid [17]. Besides, rapid loss of water and uptake of solids
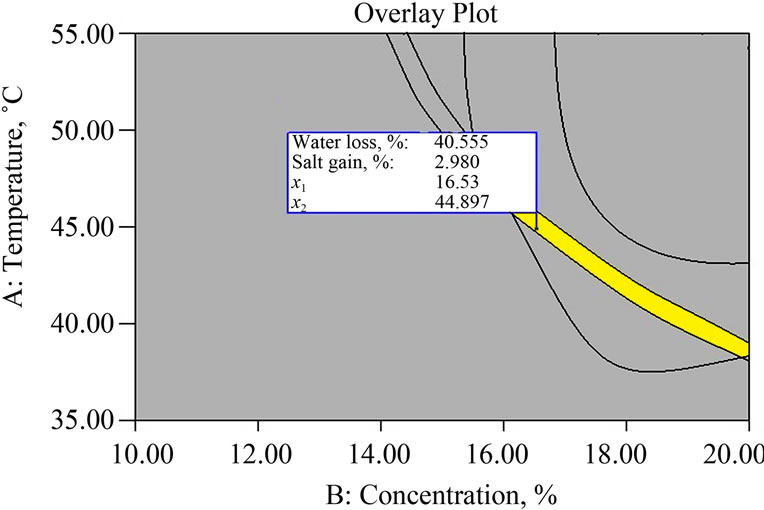 (a) At duration of osmosis = 47.59 min.
 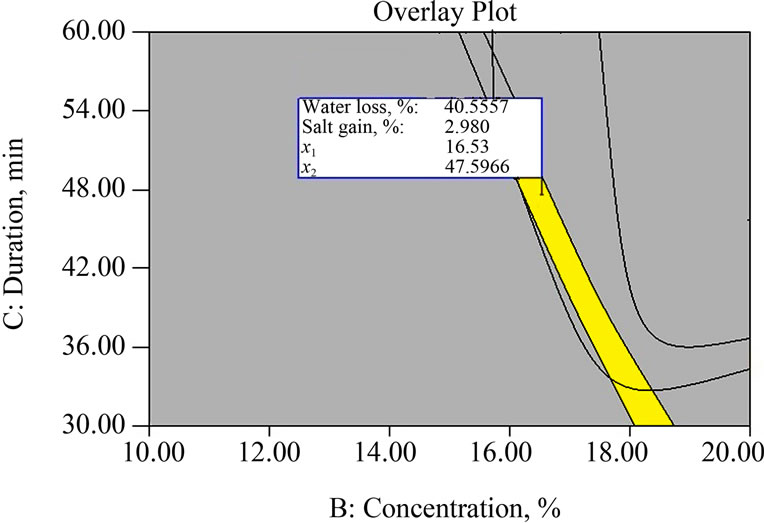 (b) At temperature of brine = 44.89˚C.
Figure 3. Superimposed contour plots for responses during osmotic dehydration of mushroom sample.
near the surface in the beginning may result in structural changes leading to compaction of this surface layers and increased mass transfer resistance for water and solids [5]. Similar trends have been reported for other fruits and vegetables during osmosis [15,18,19].
3.3. Optimization of Osmotic Dehydration of Mushroom
Numerical multi response technique was carried out for optimization of process parameters such as temperature, concentration of brine and duration of osmosis. Design expert version 8.0.6 of STAT-EASE software (Stat ease Inc, Minneapolis, USA), as discussed in section 3.8.1 was used for simultaneous optimization of the multiple responses.
The constraints were set such that the selected variables (T, C and θ) would be minimum from economical point of view for the most important product attribute and close to the optimum for the others [8]. The main criteria for constraints optimization were maximum possible water loss and targeted salt gain of 2.98 per cent as most important quality (saltiness) attribute mentioned by [4,20,21]. The desired goals for each factor and response are shown in Table 4. The process parameters for osmotic dehydration process were numerically optimized for desirability function having equal importance (+) to all the three process parameters and equal importance (+++++) to two responses. The goal setting begins at a random starting point and proceeds up the steepest slope on the response surface for a maximum value of water loss and targeted value of salt gain.
Table 5 shows the software generated optimum conditions of independent variables with the predicted values of responses.
A graphical multi response optimization technique was adapted to determine the workable optimum conditions for the osmotic dehydration of mushroom sample. The contour plots for all responses were superimposed and regions that best satisfy all the constraints were selected as optimum conditions. The criteria for constraint optimization are already given in Table 4. These constraints resulted in feasible zone of the optimum solutions (yellow coloured area in the superimposed contour plots). Superimposed contour plots having common superimposed area for all responses for osmotic dehydration of mushroom sample are shown in Figure 3.
4. Conclusion
The RSM was effective in optimizing process parameters for osmotic dehydration of mushroom slices in osmotic aqueous solution of salt having concentration in the range of 10% to 20%, solution temperature 35˚C to 55˚C and immersion time 30 to 60 min. The regression equation obtained can be used for optimum conditions for desired responses within the range of conditions applied in the study. Optimum solutions obtained by numerical
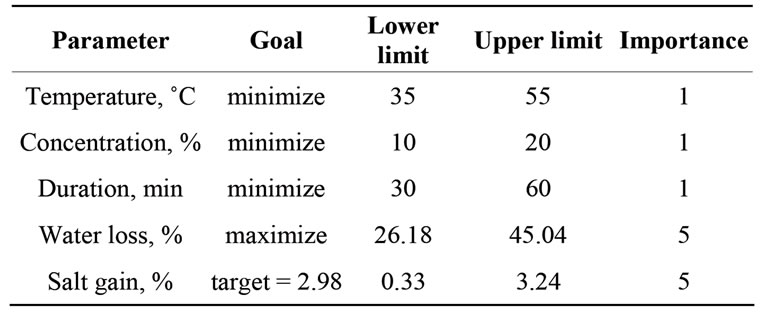
Table 4. Range of process variables and responses for optimization of osmotic dehydration process.
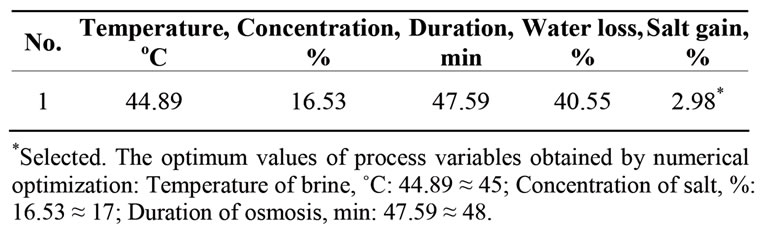
Table 5. Solution generated by the software for osmotic dehydration of mushroom sample.
optimization were 16.53% brine concentration, 44.89˚C osmotic solution temperature and 47.59 min of immersion time to get maximum possible water loss (40.55%). The model equation for the response variables predicted values under the identified optimum conditions, which were experimentally verified to be in general agreement in the model.
REFERENCES
- Anonymous, “The Food and Agriculture Organization of the United Nations,” 1971.
- M. E. Venturini, J. E. Reyes, C. S. Rivera, R. Oria and D. Blanco, “Microbiological Quality and Safety of Fresh Cultivated and Wild Mushrooms Commercialized in Spain,” Food Microbiology, Vol. 28. No. 8, 2011, pp. 1492-1498. doi:10.1016/j.fm.2011.08.007
- B. D. Shukla and S. P. Singh, “Osmo-Convective Drying of Cauliflower, Mushroom and Green Pea,” Food Engineering, Vol. 80, No. 2, 2007, pp. 741-747. doi:10.1016/j.jfoodeng.2006.06.025
- L. Shi, C. H. Xue, Y. Zhao, Z. J. Li, X. Y. Wang and D. L. Luan, “Optimization of Processing Parameters of Horse Mackerel (Trachurus Japonicus) Dried in a Heat Pump Dehumidifier Using Response Surface Methodology,” Food Engineering, Vol. 87, 2008 pp. 74-81.
- A. Lenart and J. M. Flink, “Osmotic Concentration of Potato. I Criteria for the End Point of the Osmotic Process,” Food Technology, Vol. 19, No. 1, 1984, pp. 45-63. doi:10.1111/j.1365-2621.1984.tb00326.x
- S. Kaleemullah, R. Kailappan and N. Varadharaju, ”Studies an Osmotic Air Drying Characteristics of Papaya Cubes,” Food Science and Technology, Vol. 39, No. 1, 2002, pp. 82-84.
- P. S. Pisalkar, N. K. Jain and S. K. Jain, “Osmo-convective Drying of Aloe-Vera Gel,” Food Science Technology, Vol. 48, No. 2, 2011, pp. 183-189. doi:10.1007/s13197-010-0121-2
- S. K. Jain, R. C. Verma, L. K. Murdia, H. K. Jain and G. P. Sharma, “Optimization of Process Parameters for Osmotic Dehydration of Papaya Cubes,” Food Science and Technology, Vol. 48, No. 2, 2011, pp. 211-217. doi:10.1007/s13197-010-0161-7
- G. E. Box and D. W. Behnken, “Some New Three Level Designs for the Study of Quantitative Three Variables,” Technometrics, Vol. 2, No. 4, 1960, pp. 455-475. doi:10.1080/00401706.1960.10489912
- G. W. Snedecor and W. G. Cochran, “Statistical Methods,” 6th Edition, Oxford & IBH Co., Bombay/New Delhi, 1967.
- K. Vishal, K. Gunjan and P. D. Sharma, “Effect of OsmoConvective Drying on Quality of Litchi,” Agricultural Engineering, Vol. 46, No. 4, 2009, pp. 31-35.
- M. B. Uddin, P. Amswrth and S. Ibanoglu, “Evlauation of Mass Exchange during Osmotic Dehydration of Carrots Using Response Surface Methodology,” Food Engineering, Vol. 65, No. 4, 2004, pp. 473-477. doi:10.1016/j.jfoodeng.2004.02.007
- A. Kar and D. K. Gupta, “Osmotic Dehydration Characteristics of Button Mushroom,” Food Science and Technology, Vol. 40, No. 1, 2001, pp. 23-27.
- R. P. Murumkar, S. K. Jain, P. S. Pilaskar and R. C. Verma, “Osmo-Fluid Bed Drying of White Button Mushroom,” Bioved—An International Bi-Annual Journal of Life Science, Vol. 18, No. 1-2, 2007 pp. 47-52.
- S. M. Pokharkar and S. Prasad, “Air Drying Behaviour of Osmotically Dehydrated Pineapple,” Food Science and Technology, Vol. 39, No. 4, 2002, pp. 384-387.
- B. M. Dehkordi, “Optimization the Process of OsmoConvective Drying of Edible Button Mushroom,” World Academy of Science, Engineering and Technology, Vol. 38, 2010, pp. 153-157.
- J. Hawkes and J. M. Flink, “Osmotic Concentration of Fruit Slices Prior to Dehydration,” Food Process Preservation, Vol. 2, No. 4, 1978, pp. 265-267. doi:10.1111/j.1745-4549.1978.tb00562.x
- P. K. Ghosh, Y. C. Agrawal, D. S. Jayas and B. K. Kumbhar, “Process Development for Osmo Hot Air Drying of Carrot,” Food Science and Technology, Vol. 43, No. 1, 2006, pp. 65-68.
- M. S. Alam, A. Singh and B. K. Sawhney, “Response Surface Optimization of Osmotic Dehydration Process for Anola Slices,” Food Science Technology, Vol. 47, No.1, 2010, pp. 47-54. doi:10.1007/s13197-010-0014-4
- B. I. O. Ade-Omowaye, N. K. Rastogi, A. Angersbach and D. Knorr, “Osmotic Dehydration Behaviour of Red Paprika (Capsicum annuum L.),” Food Science, Vol. 67, No. 5, 2002, pp. 1790-1796. doi:10.1111/j.1365-2621.2002.tb08724.x
- R. V. Tonon, A. F. Baroni and M. D. Hubinges. “Osmotic Dehydration of Tomato in Ternary Solutions: Influence of Process Variables on Mass Transfer Kinetics and an Evaluation of the Retention of Arytenoids,” Food Engineering, Vol. 82, No. 4, 2007, pp. 509-517.